Histone deacetylase (HDAC) inhibitors are emerging as a new class of anticancer therapeutic agents and have been demonstrated to induce differentiation in some myeloid leukemia cell lines. In this study, we show that HDAC inhibitors have a novel action on osteoclast differentiation. The effect of 2 HDAC inhibitors, trichostatin A (TSA) and sodium butyrate (NaB), on osteoclastogenesis was investigated using rat and mouse bone marrow cultures and a murine macrophage cell line RAW264. Both TSA and NaB inhibited the formation of preosteoclast-like cells (POCs) and multinucleated osteoclast-like cells (MNCs) in rat bone marrow culture. By reverse transcription-polymerase chain reaction analysis, TSA reduced osteoclast-specific mRNA expression of cathepsin K and calcitonin receptor (CTR). In contrast, TSA and NaB did not affect the formation of bone marrow macrophages (BMMs) induced by macrophage colony-stimulating factor as examined by nonspecific esterase staining. Fluorescence-activated cell sorting analysis showed that TSA did not affect the surface expression of macrophage markers for CD11b and F4/80 of BMMs. TSA and NaB also inhibited osteoclast formation and osteoclast-specific mRNA expression in RAW264 cells stimulated with receptor activator of nuclear factor-κB (NF-κB) ligand (RANKL). Transient transfection assay revealed that TSA and NaB dose dependently reduced the sRANKL-stimulated or tumor necrosis factor α (TNF-α)–stimulated transactivation of NF-κB–dependent reporter genes. The treatment of RAW264 cells with TSA and NaB inhibited TNF-α–induced nuclear translocation of NF-κB and sRANKL-induced activation of p38 mitogen-activated protein kinase (MAPK) signals. These data suggest that both TSA and NaB exert their inhibitory effects by modulating osteoclast-specific signals and that HDAC activity regulates the process of osteoclastogenesis.
Introduction
Histone deacetylase (HDAC) inhibitors are known as agents that modulate the expression of genes by increasing histone acetylation, thereby regulating chromatin structure and transcription.1,2 However, these inhibitors were not discovered based on their ability to inhibit HDAC activity. HDAC inhibitors include several structurally diverse natural products. Currently, there are several classes of HDAC inhibitors, including butyrate, hydroxamic acid, benzamide, and cyclic peptides. The simplest compound, butyrate, is a short-chain fatty acid derived from bacterial metabolism of dietary fiber in the colon. Butyrate was thought to be important for proper epithelial cell regulation, but was also found to have an antiproliferative and differentiation-inducing activity on various human colon carcinoma cells, normal cells, and neoplastic cells.3-5 On the other hand, a hydroxamic acid, trichostatin A (TSA), is a more potent HDAC inhibitor that was identified as having potential therapeutic value against cancer in screens for agents that induce differentiation of murine erythroleukemia cells.6,7 These HDAC inhibitors induce differentiation, inhibit cell proliferation, and induce apoptosis of tumor cells in cultures and animal models3-7 8 and are emerging as a new class of potential therapeutic agents for the treatment of solid and hematologic malignancies.
The effect of both sodium butyrate (NaB) and TSA on myeloid cell differentiation was well investigated using human promyelocytic leukemia cell lines, HL-60, U937, and a novel myeloid cell line, SN-1.3,9,10 NaB treatment enhanced the promoter activity of a myeloid marker, the integrin CD11c/CD18 gene, in U937 cells and triggered differentiation of these 3 cell lines toward monocytic lineage.11,12 TSA alone showed a minimal effect on the expression of other monocyte cell surface markers, CD14 and CD11b, but TSA and 9-cis-retinoic acid (RA) synergistically stimulated the expression of CD14 in HL-60 cells.13 Likewise, the stimulatory effect of HDAC inhibitors on cell differentiation has been well investigated. In contrast, little is known about whether these factors have also an inhibitory effect on the differentiation of cells. Recently, it has been reported that another HDAC inhibitor, suberoylanilide hydroxamic acid (SAHA), represses the expression of cytokines such as tumor necrosis factor α (TNF-α) and interferon γ (IFN-γ) when human peripheral blood mononuclear cells (PBMCs) are stimulated with lipopolysaccharide (LPS).14 In addition, NaB and TSA have also been found to suppress activation of nuclear factor κB (NF-κB) in colon cells.5 These results suggest that HDAC inhibitors may exhibit anti-inflammatory properties.5,15 16 Thus, HDAC inhibitors not only up-regulate but also down-regulate the expression of genes.
Osteoclasts are bone-resorptive multinucleated cells derived from hematopoietic stem cells.17,18 Differentiation of osteoclasts is regulated by soluble or membrane-bound molecules expressed by osteoblasts and stromal cells in bone microenvironment.19 One such factor, receptor activator of NF-κB ligand (RANKL), a membrane-bound member of the TNF family, is essential for osteoclast differentiation. RANKL interacts with its receptor, RANK, on osteoclast progenitor cells and stimulates the signaling pathway for osteoclastogenesis.20 Recent studies have shown that the ligation of RANK with RANKL recruits TNF receptor–associated factors (TRAFs) such as TRAF6, which activates NF-κB and the mitogen-activated protein kinase (MAPK), c-jun N-terminal kinase (JNK) pathways.21,22 The role of NF-κB and TRAF6 in osteoclastogenesis has been shown by gene disruption studies.23-25 Other types of MAPKs, extracellular signal–regulated kinases (ERKs) and p38 MAPK, are also known to be activated by stimulation with RANKL.26,27 Recently, several investigators have reported that a p38 MAPK–specific inhibitor, SB203580, specifically inhibits osteoclast differentiation, suggesting that the p38 MAPK pathway also plays an important role in osteoclastogenesis.26 27
The cell lineage of osteoclasts is very close to that of macrophages, and both macrophages and osteoclasts are considered to be generated from common progenitor cells. Some macrophage cell lines can differentiate into osteoclasts in the presence of RANKL or in coculture with osteoblasts.28-30 In recent work, we have reported that the formation of mononuclear osteoclast precursor cells (POCs) and multinucleated osteoclasts (MNCs) were modulated by the addition of factors such as interleukin 15 (IL-15), IL-10, RANKL, and TNF-α to rat bone marrow culture systems.31-33 Because both NaB and TSA are able to induce monocyte differentiation in some hematopoietic cell lines, such agents may influence the differentiation of osteoclasts. In addition, it is not well known whether these agents have any effect on the differentiation of hematopoietic cells in primary bone marrow culture systems. We therefore attempted to examine the effect of TSA or NaB on osteoclast differentiation, using a rat bone marrow culture system. Surprisingly, we found that these HDAC inhibitors specifically suppressed osteoclast differentiation but did not affect macrophage formation. We have also investigated whether TSA or NaB affects NF-κB and MAPK signaling pathways that are stimulated with RANKL. Both TSA and NaB inhibited these signal activations.
Materials and methods
Materials
Male Sprague Dawley rats and ddY mice, aged 5 to 7 weeks, were obtained from Seac Yoshitomi (Fukuoka, Japan). α-Minimum essential medium (α-MEM) was purchased from Gibco (Grand Island, NY). Fetal calf serum (FCS) was purchased from Biowhittaker (Walkersville, MD). 1α,25-Dihydroxy vitamin D3(1α,25-(OH)2D3) was purchased from Bimol (Plymouth Meeting, PA). Recombinant human TNF-α was purchased from Boehringer Mannheim (Mannheim, Germany). Recombinant human soluble RANKL (sRANKL) and human macrophage colony-stimulating factor (hM-CSF) were purchased from Pepro-Tech (London, United Kingdom). The cytochemical staining kits for tartrate-resistant acid phosphatase (TRAP) and nonspecific esterase (NSE) staining were obtained from Sigma (St Louis, MO). TSA and NaB were purchased from Sigma. Rat monoclonal antibody, antimouse F4/80 (CI:A3-1) was purchased from BMA Biomedicals (Rheinstrasse, Switzerland). Fluorescein isothiocyanate (FITC)–conjugated rat monoclonal antibody, antimouse CD11b (Mac-1; M1.70) was purchased from Immunotech (Marseille, France). Rabbit polyclonal antibodies against NF-κB p65 and phosphorylated p38 (Tyr 182)–R and mouse monoclonal antibody against actin (C-2) were purchased from Santa Cruz Biotechnology (Santa Cruz, CA).
Bone marrow cell culture
Cultures of rat bone marrow cells were carried out as described by Kukita et al.34,35 Briefly, bone marrow cells were isolated from tibias and femurs of rats. For the formation of MNCs, whole bone marrow cells were cultured in 24-well culture plates (Falcon, Lincoln Park, NJ) for 5 days in α-MEM containing 15% FCS in the presence of 10−8 M 1α,25(OH)2D3 and 10% (vol/vol) heat-treated conditioned medium derived from rat osteoblastic cell line ROS17/2.8 (htROSCM), as described by Kukita et al.34 For the formation of POCs, stroma-free bone marrow cells (2 × 10⁶ cells/mL) were cultured in 96-well culture plates (Falcon) for 4 days in α-MEM containing 15% FCS in the presence of 10−8 M 1α,25(OH)2D3and 10% (vol/vol) heat-treated conditioned medium and TNF-α (10 ng/mL) as described previously.33 35 In some cultures, stroma-free bone marrow cells were cultured for 4 days in the presence of M-CSF (1 ng/mL) to induce macrophage cell formation. In the cultures of mouse bone marrow, cells were suspended in α-MEM containing 15% FCS and cultured in 48-well plates (1 × 10⁶ cells/mL). Osteoclast differentiation was induced in the presence of M-CSF (50 ng/mL) and sRANKL (50 ng/mL) for 4 days of culture. For the formation of bone marrow macrophages, cells were cultured in the presence of M-CSF (50 ng/mL) for 3 days. Various concentrations of TSA or NaB were added after 24 hours of culture. At the end of the culture, the cells were fixed and then stained using a commercial kit for TRAP or NSE, marker enzymes for osteoclasts or macrophages, respectively. TRAP+ cells with more than 3 nuclei were counted as MNCs, and TRAP+ mononuclear cells formed in stroma-free rat bone marrow cells were counted as POCs.
Culture of macrophage cell line
RAW-D is a subclone of murine macrophage cell line RAW264 and has high potential to differentiate into osteoclasts (Watanabe T et al, unpublished data, 2003). RAW-D cells were cultured in α-MEM containing 10% FCS. For osteoclast differentiation, cells were cultured at a density of 1.5 × 10⁵ cells/mL in the presence of sRANKL for 3 days. For immunoblotting, RAW-D cells were preincubated with TSA (100 nM) or NaB (1 mM) for 24 hours, then stimulated with TNF-α (100 ng/mL) or sRANKL (100 ng/mL) for 30 minutes.
Flow cytometry
At the end of culture, adherent mouse bone marrow cells or RAW-D cells were harvested with 0.02% EDTA (ethylenediaminetetraacetic acid) in phosphate-buffered saline (PBS). For staining for Mac-1 antigen, cells were stained with FITC-conjugated anti-CD11b (Mac-1) monoclonal antibody. For staining for F4/80 antigen, cells were incubated with rat antimouse F4/80 antibody, followed by incubation with a second antibody, FITC-conjugated antirat IgG. Cells were then analyzed by flow cytometry (FACSscan; Becton Dickinson, Erembodegem, Belgium).
RT-PCR analysis
Nonadherent rat bone marrow cells (1.1 × 10⁷) or RAW-D cells (1.5 × 10⁵ cells/mL) were cultured in 60-mm tissue culture dishes (Falcon) in the presence of various factors and TSA or NaB for 4 days or 3 days, respectively. Total RNA was extracted by using a commercial kit (Isogen; Nippon Gene, Toyama, Japan) and subjected to polymerase chain reaction (PCR) using a reverse transcription-PCR (RT-PCR) kit (Takara, Kyoto, Japan). The following primers were used for RT-PCR analysis: mouse calcitonin receptor (CTR; sense, 5′-TTTCAAGAACCTTAGCTGCCAGAG-3′, antisense, 5′-CAAGGCACGGACAATGTTGAGAAG-3′)36; mouse cathepsin K (sense 5′-ATGTGGGGGCTCAAGGTT-3′, antisense, 5′-CCACAAGATTCTGGGGACTC3′); rat CTR (sense 5′-AAGAACATGTT(C/T)CT(C/G/T)ACTTA-3′, antisense, 5′-ACAAACTGGA(T/C)(T/G)CCCAGCAGGGGCAC-3′)37; rat cathepsin K (sense, 5′-CAGTGTGGTTCCTGTTGGG-3, antisense, 5′-ACATCTTGGGGAAGCTGGC-3′)33; rat (mouse) RANK (sense, 5′-TTAAGCCAGTGCTTCACGGG-3′, antisense, 5′-ACGTAGACCACGATGATGTCGC-3′)38; mouse CD11b (sense, 5′-CTTAAAGCTCTTCTGGTCACAGCC-3′, antisense, 5′-GTATTCTCCTTGCAGTTTTGGTGC-3′)39; mouse Emr1 (F4/80) (sense, 5′-GAATCTTGGCCAAGAAGAGAC-3′, antisense, 5′-GAATTCTCCTTGTATATCATCAGC-3′)40; rat (mouse) glyceraldehyde-3-phosphate dehydrogenase (GAPDH) (sense, 5′-CATGGAGAAGGCTGGGGCTC-3′, antisense, 5′-AACGGATACATTGGGGTAG-3′).41 PCR products were separated on a 1.5% agarose gel and stained with ethidium bromide. As an internal control for RNA quantity, the same cDNA was amplified using primers specific for GAPDH mRNA.
Luciferase assays
Renilla luciferase plasmid, pΔTK-RL (provided by Dr Ouchida, Okayama University), which has basal thymidine kinase promoter, was used as an internal control, as described previously.42NF-κB–dependent reporter plasmid, p55IgKluci, and the control vector, p55luci, were provided by Dr Fujita (Tokyo Metropolitan Institute of Medical Science).43 RAW-D cells were cotransfected with p55IgKluci or p55luci and pΔTK-RL by using a commercial transfection reagent, fugene-6 (Roche Diagnostics, Basel, Switzerland). After 24 hours, cells were treated with different concentrations of TSA or NaB and sRANKL or TNF-α. The cells were then harvested 24 hours later in Promega (Madison, WI) lysis buffer. The activity of firefly and Renilla luciferase was measured using a reagent kit (Promega) and normalized to the Renilla luciferase activity of a cotransfected pΔTK-RL vector to correct for variation in transfection efficiency.
Protein isolation and Western blot analysis
Cells were grown in 60-mm plates. Cells treated with sRANKL were lysed in a sodium dodecyl sulfate (SDS) lysis buffer (0.12M Tris [tris(hydroxymethyl)aminomethane]–HCl, pH 6.8, 2% SDS, 10% glycerol). Whole-cell extracts were treated at 90°C for 2 minutes and then sonicated. Nuclear extracts were prepared from cells treated with TNF-α according to the method described previously.44Briefly, cells were washed with ice-cold PBS and incubated at 4°C for 8 minutes in 400 μL buffer containing 0.1% Nonidet P-40 (NP-40), 10 mM HEPES (N-2-hydroxyethylpiperazine-N′-2-ethanesulfonic acid)–KOH, pH 7.9, 10 mM KCl, 0.1 mM EDTA, 1 mM dithiothreitol (DTT), 2 mM MgCl2, 5 μM amidinophenyl methanesulfonyl fluoride hydrochloride (APMSF), 0.5 M sucrose, and 2 μg/mL leupeptin. The cells were then scraped into tubes and centrifuged at 14 000 rpm for 10 minutes at 4°C. The pellets were rinsed with the above buffer without NP-40. Nuclear extracts were prepared by resuspending the nuclear pellets with 20 μL of a high-salt buffer (20 mM HEPES-KOH, pH 7.9, 1.5 mM MgCl2, 420 mM NaCl, 0.2 mM EDTA, 1 mM DTT, 5% glycerol, 5 μM APMSF, 2 μg/mL leupeptin), incubating on ice for 40 minutes, and then centrifuging at 14 000 rpm for 10 minutes at 4°C. The nuclear extracts were then mixed with 30 μL of low-salt buffer (20 mM HEPES-KOH, pH 7.9, 50 mM KCl, 0.2 mM EDTA, 1 mM DTT, 20% glycerol, 5 μM APMSF, 2 μg/mL leupeptin). Protein concentrations of the nuclear extracts were determined using a commercial kit (Bio-Rad Laboratories, Hercules, CA). Ten microliters of whole cell extracts or an equal amount of proteins (10 μg) of nuclear extracts was fractionated under reducing conditions in 10% polyacrylamide gels and transferred to nitrocellulose filters (Schleincher and Schuell, Dassel, Germany). The filters were blocked in 5% low-fat milk and dissolved in PBS plus 0.1% Tween-20 (PBST) at room temperature for 2 hours. After extensive washing in PBST, the filters were probed with antiphosphorylated p38 (1:1000 dilution), anti–NF-κB p65 (1:500 dilution), or antiactin (1:1000 dilution) antibodies. The filters were then incubated with horseradish peroxidase (HRP)–conjugated antirabbit immunoglobulin G (IgG) or antimouse IgG and developed using the enhanced chemiluminescence (ECL) detection system (Amersham, Buckinghamshire, United Kingdom). For p38 Western blot analysis, the same sample was analyzed by antimouse actin antibody as a control for protein quantity.
Results
TSA or NaB inhibits osteoclast differentiation in bone marrow cultures
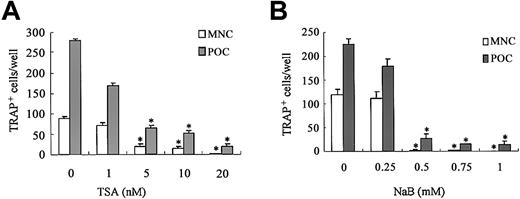
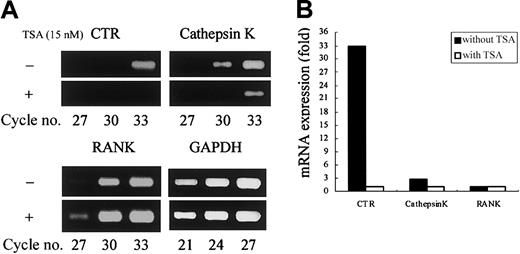
We first examined the effect of HDAC inhibitors on osteoclastogenesis using TSA and NaB. The TRAP+ MNCs or POCs are separately formed in 2 types of rat bone marrow culture systems.34 35 Both TSA and NaB inhibited the formation of TRAP+ MNCs in a dose-dependent manner in whole bone marrow culture (Figure 1A-B). As low as 5 nM TSA or 0.5 mM NaB was sufficient for 78% or 98% reduction of TRAP+ MNCs formation, respectively. Both TSA and NaB dose-dependently inhibited the formation of POCs in stroma-free rat bone marrow culture (Figure 1A-B). These results demonstrate that both TSA and NaB strongly suppress osteoclast differentiation directly by inhibiting the formation of precursor cells of osteoclasts. To determine whether the inhibitory effect of these agents correlates with expression of the osteoclast-specific CTR and cathepsin K mRNA, total RNA was prepared and analyzed by semiquantitative RT-PCR. Figure 2A-B shows RT-PCR analysis of CTR and cathepsin K mRNA expression treated with or without TSA. The level of CTR and cathepsin K mRNA was decreased in the cultures treated with TSA. In contrast, TSA did not have any effect on the level of RANK mRNA.
In cultures of mouse bone marrow cells, TRAP+osteoclast-like cells are formed in the presence of M-CSF and sRANKL.45-47 We also examined the effect of TSA and NaB on this formation of osteoclast-like cells. TSA or NaB dose-dependently inhibited the formation of TRAP+ MNCs in mouse bone marrow cell culture (data not shown). Figure 3demonstrates the mouse bone marrow cultures treated with or without 20 nM TSA or 1 mM NaB. TSA or NaB dramatically decreased the number of TRAP+, osteoclast-like cells. In contrast, the number of cells in the culture did not decrease compared to that of the cells in the culture without TSA or NaB. These data indicate that the effect of TSA or NaB is not toxic, but rather is selectively inhibitory to osteoclastogenesis.
Effect of TSA or NaB on osteoclast differentiation in rat bone marrow culture.
Whole rat bone marrow cells or stroma-free rat bone marrow cells for forming MNCs (■) or POCs (░) were cultured as described in “Materials and methods” in the presence of various concentrations of TSA (A) or NaB (B). TSA or NaB was added after 24 hours of incubation. The cells were stained for TRAP, and the number of TRAP+ MNCs and POCs was counted in each well. Each bar represents the mean ± SEM of quadruplicate cultures. Data were analyzed by Student t test. *P < .001 compared with the culture without TSA or NaB.
TSA selectively reduces osteoclast-specific mRNA expression.
(A) Stroma-free rat bone marrow cells were cultured for 4 days with or without 15 nM TSA for the formation of POCs. Total RNA was prepared and reverse transcribed, and cDNA was amplified for the number of PCR cycles, using specific primers designed for genes of CTR, cathepsin K, RANK, and GAPDH. The PCR products were stained with ethidium bromide. (B) Relative expression of CTR, cathepsin K, and RANK is shown. The intensity of the bands was determined by densitometry and normalized by the level of GAPDH.
Demonstration of TRAP+ MNCs in the mouse bone marrow culture treated with sRANKL and M-CSF in the presence of TSA or NaB.
Mouse bone marrow cells were cultured in the presence of hM-CSF (50 ng/mL) and sRANKL (50 ng/mL) with or without TSA or NaB for 4 days. (A) Without TSA or NaB; (B) with 20 nM TSA; (C) with 1 mM NaB. The cells were then fixed and stained for TRAP. A number of TRAP+ MNCs were observed in the culture without TSA or NaB (A). No TRAP+ MNCs were observed in cultures with TSA or NaB (B-C). Scale bars = 100 μm.
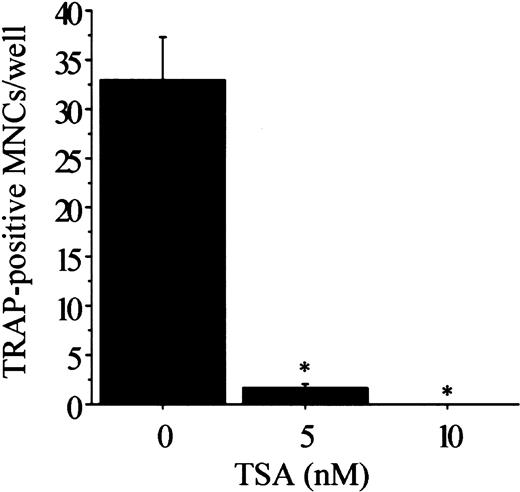
We next examined whether TSA affects the early stage or the late stage of the TRAP+ POC formation by performing temporal treatment with TSA. As shown in Figure 4, the effect on the number of TRAP+ POCs is more pronounced when TSA is added earlier. We recently showed that sRANKL induces the formation of TRAP+ MNCs from preformed POCs in rat bone marrow cell culture.34 To investigate whether TSA has any effect in the fusion of the preformed POCs in the presence of sRANKL, the preformed POCs were incubated for 3 days with different concentrations of TSA. TSA dose-dependently inhibited the fusion of POCs (Figure 5). Thus, TSA suppresses not only the formation of preosteoclasts but also the multinucleation of preosteoclasts.
Time course of the effect of TSA on the formation of TRAP+ POCs.
Stroma-free rat bone marrow cells were cultured under the conditions necessary to form POCs for 4 days with (▪) or without (░) 10 nM TSA, following the indicated treatment schedule. Culture was fed every day with fresh medium, hormone, factors, and TSA. Before changing to new medium, the culture was washed 3 times by replacing 80% of the culture medium with fresh medium to eliminate the remaining factors. Factors and TSA were then added for the indicated periods. After 4 days of culture, the cells were fixed and stained for TRAP. The number of TRAP+ mononuclear cells was counted in each well. Each value represents the mean ± SEM of quadruplicate cultures. Data were analyzed by Student t test. *P < .001 compared with the culture without TSA.
Effect of TSA on fusion of POCs in the presence of sRANKL.
Stroma-free rat bone marrow cells were cultured in 96-well culture plates under the condition to form POCs for 4 days. The cells were then washed 3 times with α-MEM containing 15% FCS and further incubated for 2 days in the presence of 30 ng/mL sRANKL with or without TSA. Cells were then fixed and stained for TRAP. The number of TRAP+ MNCs was counted in each well. Each value represents the mean ± SEM of quadruplicate cultures. Data were analyzed by Student t test. *P < .001 compared with the culture without TSA.
TSA or NaB does not affect Mac-1 or F4/80 expression in M-CSF–induced bone marrow macrophages
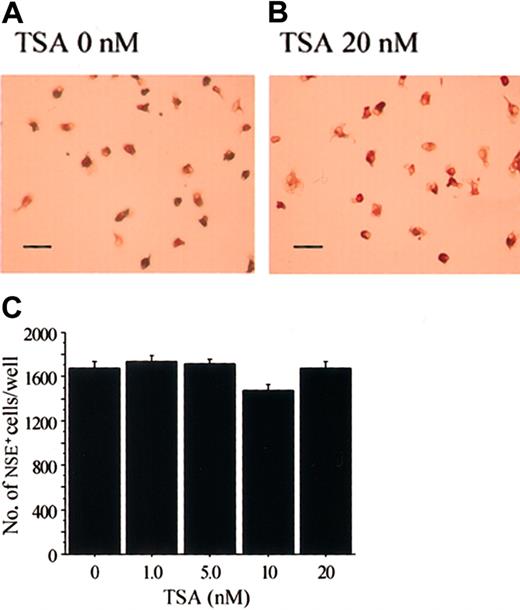
The cell lineage of the osteoclasts is considered to be very close to that of macrophages.48 When M-CSF stimulates bone marrow cells, M-CSF–dependent bone marrow macrophages (BMMs) appear.49 50 When we treated stroma-free rat bone marrow cells with hM-CSF for 3 days, most of the adherent cells were positive for NSE, which is a marker enzyme for macrophages (Figure6A). Addition of various concentrations of TSA did not have any effect on the formation of NSE+cells (Figure 6B-C). We also examined the effect of NaB, which also had no effect on the formation of NSE+ cells (data not shown).
TSA does not affect the formation of M-CSF–induced NSE+ cells.
Demonstration of NSE+ cells in rat bone marrow culture stimulated with M-CSF in the presence (B) or absence (A) of TSA. Scale bars = 100 μm. (C) Dose effect of TSA on the formation of NSE+ cells in stroma-free rat bone marrow culture. Stroma-free bone marrow cells were cultured in the presence of hM-CSF (1 ng/mL) for 4 days. Various concentrations of TSA were added after 24 hours of incubation. The cells were then fixed and stained for NSE (A-B), and the number of NSE+ cells was counted in each well (C). Each bar represents the mean ± SEM of quadruplicate cultures.
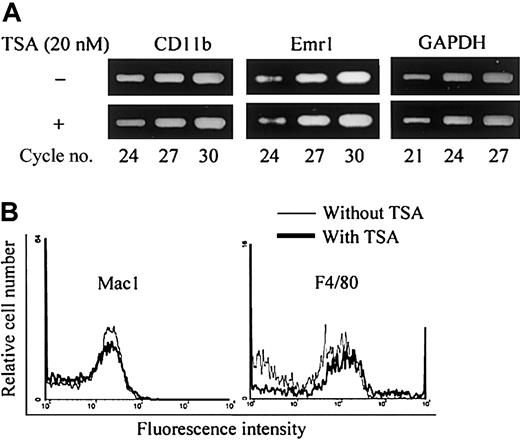
In mouse bone marrow culture, neither TSA nor NaB had any effect on the formation of NSE+ cells (data not shown). We then analyzed by RT-PCR whether the levels of mRNA for macrophage-associated phenotypes such as Mac-1 (CD11b) and F4/80 in mouse BMMs were influenced by the addition of TSA. As shown in Figure7A, TSA had no effect on the level of mRNA for CD11b and emr1 (encoding F4/80 antigen) induced by M-CSF in BMMs. Finally, we analyzed the surface expression of Mac-1 and F4/80 antigen of mouse BMMs by fluorescent activated cell sorting (FACS). As shown in Figure 7B, TSA had no effect on the expression of either Mac-1 or F4/80. These results together indicate that TSA or NaB does not affect macrophage differentiation in bone marrow culture.
TSA does not affect the expression of macrophage-associated phenotypes in mouse bone marrow culture.
(A) RT-PCR analysis of mouse bone marrow macrophage (mBMMs) formed in the presence or absence of TSA. (B) FACS analysis of surface markers Mac-1 and F4/80 of mBMMs formed in the presence or absence of TSA. Mouse whole bone marrow cells were cultured in the presence of hM-CSF (50 ng/mL) with or without TSA (20 nM) for 3 days. Total RNA was prepared and analyzed by RT-PCR (A). Adherent cells were harvested and stained with anti-F4/80 or FITC-conjugated anti–Mac-1 antibody (B).
Effect of TSA or NaB on osteoclast differentiation of RAW-D cells stimulated by sRANKL
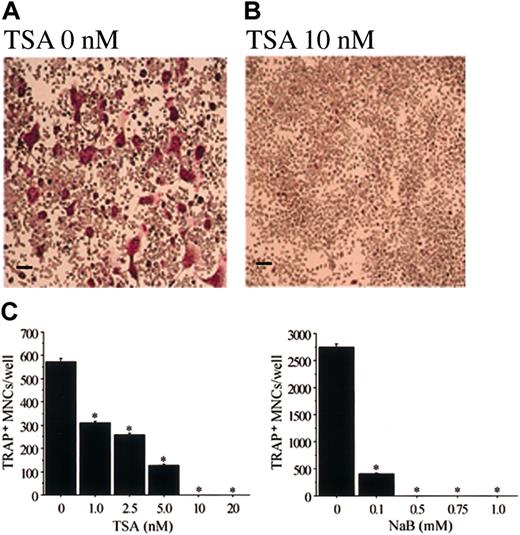
A macrophage cell line, RAW 264, differentiates into osteoclasts in the presence of sRANKL.26 51 We investigated the effect of TSA or NaB on the formation of TRAP+ MNCs using a subclone of RAW 264, RAW-D, which efficiently differentiates into osteoclasts. When RAW-D cells were cultured in the presence of sRANKL (30 ng/mL) for 3 days, a large number of TRAP+ cells were formed, as shown in Figure 8A. Addition of various concentrations of TSA or NaB inhibited TRAP+MNCs formation from RAW-D cells (Figure 8B-C). In this culture system, 1 nM TSA or 0.1 mM NaB was sufficient for 50% or 80% reduction of TRAP+ MNC formation, respectively. The concentrations were 5 times lower than those required for a similar reduction in bone marrow culture. We also examined whether TSA would affect the level of osteoclast-specific CTR and cathepsin K mRNAs. As shown in Figure9A, when RAW-D cells differentiate into osteoclasts in the presence of sRANKL, the expression of cathepsin K and CTR mRNA is increased. Addition of TSA inhibited this stimulation of osteoclast-specific mRNAs. These results demonstrate that TSA inhibits osteoclast differentiation from macrophages. We also analyzed the mRNA level of RANK, CD11b (Mac-1), and emr1 (F4/80) by RT-PCR analysis. Addition of sRANKL decreased the expression of CD11b and emr1 when RAW-D cells differentiated into osteoclasts in the presence of sRANKL, whereas the expression of CD11b and emr1 was not decreased in the presence of TSA, as shown in Figure 9A. To further characterize the macrophage phenotypes, we performed FACS analysis of RAW-D cells stimulated with sRANKL in the presence or absence of TSA. As shown in Figure 9B, the surface expression of Mac-1 and F4/80 was decreased when RAW-D cells were stimulated with sRANKL. The treatment of RAW-D cells with TSA prevented the reduction of Mac-1 and F4/80 expression. These results together suggest that RAW-D cells are not able to differentiate into osteoclasts and retain macrophage-associated phenotypes in the presence of TSA, even when the cells are stimulated with sRANKL.
TSA or NaB inhibits osteoclast differentiation of RAW-D cells stimulated with sRANKL.
Demonstration of TRAP+ cells in RAW-D cells stimulated with sRANKL in the presence (B) or absence (A) of TSA. (C) Dose-dependent effect of TSA or NaB on the formation of TRAP+ MNCs in RAW-D stimulated with sRANKL. RAW-D cells (1.5 × 10⁵ cells/mL) were cultured for 3 days in the presence of sRANKL (30 ng/mL) with various concentrations of TSA or NaB. TSA or NaB was added after 24 hours of incubation. Cells were then fixed and stained for TRAP. The number of TRAP+ MNCs was counted in each well. Each value represents the mean ± SEM of quadruplicate cultures. Data were analyzed by Student t test. *P < .001 compared with the culture without TSA. Scale bars = 100 μm.
TSA inhibits the expression of CTR and cathepsin K but not CD11b or F4/80 in RAW-D cells stimulated with sRANKL.
(A) Effect of TSA on the expression of various mRNAs of RAW-D cells stimulated with sRANKL. RAW-D cells were cultured with sRANKL in the presence or absence of TSA (10 nM), and total RNA was prepared. Semiquantitative RT-PCR was used to assess the changes in the expression of various genes. cDNA was amplified for the number of PCR cycles indicated and visualized on agarose gels with ethidium bromide. GAPDH levels were used for comparison. (B) FACS analysis of RAW-D cells. RAW-D cells were treated with sRANKL for 3 days in the presence or absence of TSA (10 nM). TSA was added after 24 hours of incubation. Cells were then stained with antimouse Mac-1 or F4/80 antibodies and analyzed by FACS.
TSA or NaB affects sRANKL/TNF-α–induced activation of NF-κB and MAPK signaling pathways
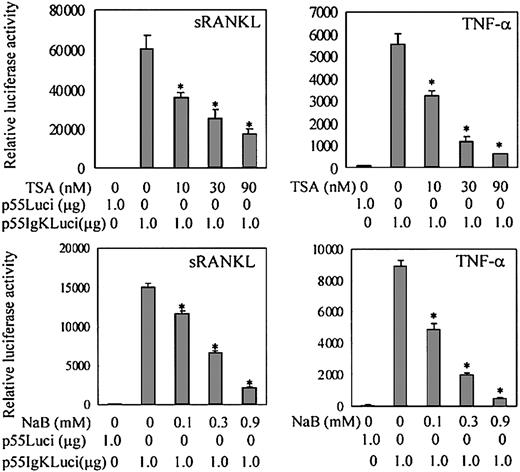
RANKL-RANK signaling plays an essential role in osteoclast differentiation and function. The activation of NF-κB and MAPKs pathways is thought to be critical in signaling osteoclast differentiation.26,27 52 We first determined whether TSA- or NaB-mediated suppression of osteoclast differentiation is related to the modulation of NF-κB activation. We transiently transfected the RAW-D cells with NF-κB–dependent reporter plasmid p55IgKLuci and treated them with sRANKL or TNF-α. As shown in Figure10, sRANKL or TNF-α stimulated NF-κB–dependent transactivation in RAW-D cells. Treatment with TSA or NaB dose-dependently reduced the sRANKL- or TNF-α–stimulated transactivation of NF-κB–dependent reporter genes (Figure 10). The influence of TSA or NaB on NF-κB activation was further examined by Western blotting using RAW-D cells. Nuclear extracts of RAW-D cells stimulated with TNF-α for 30 minutes were analyzed using antibody to NF-κB p65 subunit. Pretreatment of RAW-D cells with TSA or NaB for 24 hours dramatically reduced nuclear translocation of NF-κB p65, as shown in Figure 11A. These results suggest that the treatment with TSA or NaB affects the NF-κB signaling pathway in RAW-D cells.
TSA and NaB decrease NF-κB–dependent transactivation in RAW-D cells.
RAW-D cells were transiently transfected with 1 μg NF-κB–dependent reporter plasmid p55IgKLuci or control vector p55Luci. Transiently transfected cells were stimulated with TNF-α or sRANKL for 24 hours. Various concentrations of TSA or NaB were added with TNF-α (20 ng/mL) or sRANKL (100 ng/mL). Renilla luciferase expression vector, pΔTK-RL (0.25 μg), was used as internal control for transfection. Bars represent the mean ± SEM of 3 independent transfections. Data were analyzed by Student t test. *P < .001 compared with the culture without TSA or NaB treatment.
TSA and NaB affect NF-κB and p38 MAPK signaling pathways in RAW-D cells
. (A) TSA or NaB suppresses the nuclear translocation of NF-κB p65 in RAW-D cells stimulated with TNF-α. RAW-D cells were treated without or with TSA (100 nM) or NaB (1 mM) for 24 hours, followed by treatment with TNF-α for 30 minutes. Nuclear extracts were prepared and analyzed by Western blotting using NF-κB p65 antibody. (B) TSA or NaB suppresses activation of p38 MAPK in RAW-D cells stimulated with sRANKL. RAW-D cells were preincubated with or without TSA (100 nM) or NaB (1 mM) for 24 hours and stimulated with sRANKL (100 ng/mL) for 30 minutes. Whole-cell lysates were prepared and analyzed by Western blotting using phosphorylated p38 MAPK antibody. The bottom lane indicates equal loading of protein probed for actin antibody.
Recently, it has been shown that the p38 MAPK pathway plays an important role in RANKL-induced osteoclast differentiation in bone marrow–derived osteoclast precursor cells and the RAW 264 macrophage cell line.26 27 We next investigated the effect of TSA or NaB on the activation of p38 MAPK, using the antibody against phosphorylated-p38 MAPK. Figure 11B shows Western blot analysis of RAW-D cells stimulated with sRANKL in the presence or absence of TSA or NaB. The level of expression of phosphorylated p38 MAPK was increased by treatment of RAW-D cells with sRANKL for 30 minutes. Pretreatment of RAW-D cells with TSA or NaB for 24 hours suppressed the sRANKL-induced activation of p38 MAPK. These results suggest that inhibitory function of TSA or NaB may also include the p38 MAPK pathway.
Discussion
The HDAC inhibitors, TSA and NaB, are strong inhibitors for osteoclastogenesis
NaB has been known to have biologic activity, especially to induce differentiation of cells in several culture systems. The structurally different compound TSA also induces differentiation of leukemia cells. Similar action exhibited by NaB and TSA suggested that the effects of both agents were mediated by their ability to inhibit HDAC. Currently, several HDAC inhibitors are used for therapy. NaB not only induces differentiation of some leukemia cells, but also induces gene expression and differentiation in some primary cells such as epithelial cells, hepatocytes, and liver cells.53-55 Because NaB is a product generated in intestine by bacterial metabolism, it has been considered that NaB has some effect on epithelial cells. NaB stimulated the expression of phenotypes in human enterocytes and primary liver culture and reduced glucose transporter expression in hepatocytes.53-55 On the other hand, it is also known that TSA induces differentiation of some leukemia cells.13,56However, the effect of these agents on other primary cells, except epithelial cells, is not well known. Because the HDAC inhibitors are used in therapeutic medicine for leukemia and lymphoma,57,58 it is important to know the effect on the cells in primary bone marrow culture. Iwami et al59reported that NaB stimulated osteoblast differentiation but inhibited osteoclast differentiation. They concluded that the inhibitory effect of NaB on osteoclastogenesis was related to the cytotoxicity of NaB on bone marrow cells. They incubated bone marrow cells with NaB for 8 days, but we treated bone marrow cells and RAW-D cells with TSA or NaB for 3 or 2 days and found that the TSA and NaB had an inhibitory effect on osteoclastogenesis. In our culture system, the effect of these agents was not cytotoxic but was specific for the cells of osteoclast lineage.
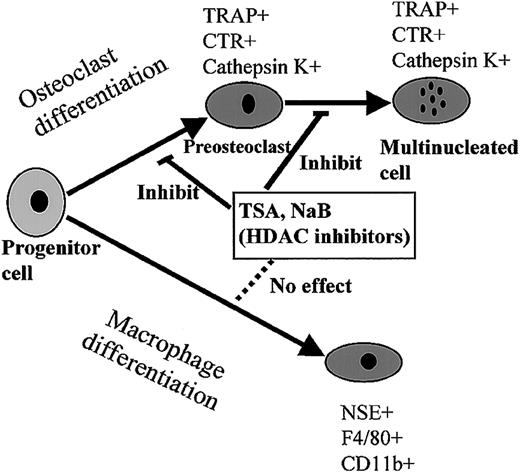
The inhibitory effect was examined by using different markers in mouse and rat bone marrow cultures and a macrophage cell line, RAW 264. In both culture systems, both agents exhibited the same activity, which reduced osteoclast differentiation but did not affect the expression of macrophage markers such as CD11b and F4/80. Several reports have shown that the HDAC inhibitors modulate myeloid cell differentiation, but the effect of these agents on the expression of macrophage markers is still not known.11-13 High doses of TSA slightly induced the expression of CD14 and CD11b, but the addition of both TSA and 9-cis-RA resulted in enhancement of CD14 expression.13 TSA treatment of the cells seems enough to inhibit osteoclastogenesis but not enough to induce macrophage differentiation. Figure 12 summarizes the effect of HDAC inhibitors on the differentiation into osteoclasts and macrophages. Because these agents are known to inhibit cell proliferation,60 we analyzed whether these agents affect the growth of RAW-D. Treatment of RAW-D cells for 2 days with 10 nM TSA, which completely inhibited osteoclastogenesis, resulted in 25% reduction of the cell numbers (data not shown). Inhibitory activity of TSA and NaB on osteoclast differentiation seems not to be derived from the inhibitory effect of cell proliferation.
Effect of HDAC inhibitors on the differentiation into osteoclasts and macrophages.
HDAC inhibitors suppressed the processes of osteoclast differentiation, POC formation, as well as MNC formation, whereas they did not affect macrophage differentiation.
Effect of HDAC inhibitors on the differentiation into osteoclasts and macrophages.
HDAC inhibitors suppressed the processes of osteoclast differentiation, POC formation, as well as MNC formation, whereas they did not affect macrophage differentiation.
NF-κB and MAPK may be involved in the inhibitory effect of TSA and NaB
Differentiation and activation of osteoclasts depend on the signal through RANK stimulated with RANKL. NF-κB knockout mice exhibit osteopetrosis61 and is one of the important signaling molecules of RANKL.21 We found that NF-κB–dependent transcriptional activity was dose-dependently repressed by the treatment of these agents. In addition, the protein level of NF-κB in the nucleus after stimulation also decreased. NF-κB is considered to be involved in not only the process of differentiation but also in maturation of osteoclasts.21 HDAC inhibitors also inhibited both of the osteoclast differentiation processes, preosteoclast formation and fusion. Inhibitory action of these agents on osteoclastogenesis seems to involve the inhibitory effect of these agents on NF-κB activation. Some investigators have reported that NaB can suppress NF-κB activation in different cell types, including colon cancer cell lines and epithelial cells isolated from the colon.5,16 Recently, Chakravortty et al62reported that NaB prevented activation of NF-κB and inhibited nitric oxide production of RAW 264.7 cells stimulated with LPS. These results support our data on the suppression of HDAC inhibitors on NF-κB activation by HDAC inhibitors. On the other hand, other investigators reported that after NF-κB enters the nucleus, the transactivation of NF-κB can be regulated directly by phosphorylating or acetylating of NF-κB itself.63 64 In their studies, the treatment of the cells with HDAC inhibitors such as TSA augmented the transactivation of NF-κB–dependent reporter gene. These results are opposite to our data, but they used cells that are different from ours. Because NF-κB is ubiquitously expressed in many types of cells, the role of NF-κB in the signals is thought to be different in each signal and cell. Further studies are necessary to elucidate the mechanism of inhibitory activity of HDAC inhibitors on NF-κB activation by RANKL in macrophage cells.
MAPKs transmit signals from extracellular stimuli to induce cell proliferation and differentiation. Among MAPKs, JNK and p38 MAPK have been shown to be involved in osteoclast differentiation.22 26 In this study, we found that the phosphorylation of a MAPK, p38, decreased after treatment with TSA or NaB, suggesting that the inhibition of the p38 MAPK pathway may also be involved in the inhibitory action of these agents. We also tried to see the effect of these agents on the activation of the JNK pathway, but we could not find any strong activation of JNK signals or any effect of these agents on activation of JNK by Western blot analysis in RAW-D cells (data not shown).
Likewise, HDAC inhibitors affected both of signaling pathways, NF-κB and MAPK. Treatment with HDAC inhibitors is considered to increase the acetylation level of histone, which precedes the induction of gene expression. However, we have not determined which genes are affected by these HDAC inhibitors. One possibility for inhibition of MAPK may be an activation of protein kinase phosphatase gene. Li et al65recently reported that mitogen-activated protein kinase phosphatase 1 (MKP-1) plays a role in the regulation of the MAPK pathway and that phosphorylation and acetylation of histone are associated with transcriptional induction of MKP-1. The treatment with HDAC inhibitors may induce MKP-1 and prevent the p38 MAPK signaling pathway. In addition, rather than histone being the substrate for HDAC, transcriptional regulators could become acetylated. Several transcriptional regulators have been shown to be substrates for HDAC, including NF-κB, GATA-1, and p53.63,66,67 Acetylation of transcription factors may modulate their activity and influence osteoclastogenesis. Recent reports describe the use of chromatin immunoprecipitation assay to analyze whether promoters of genes are regulated by acetylation of histone or transcription factor itself.68 69 To determine the genes and transcription factors modulated by TSA or NaB in macrophages stimulated with RANKL, further studies will be required.
Possible efficacy of HDAC inhibitors in therapy for bone disease
In this study, we present the novel action of 2 HDAC inhibitors, TSA and NaB, on osteoclastogenesis. Osteoclasts have a crucial role in physiologic bone remodeling and also function in the pathologic bone loss that occurs associated with inflammatory diseases such as rheumatoid arthritis and periodontal disease.70,71 They are also involved in postmenopausal osteoporosis.72 Our findings open up an additional avenue to search out drugs specific for the treatment of these diseases.
The authors thank Dr M. Ouchida (Okayama University) for donating reporter plasmid, pΔTK-RL, and Dr T. Fujita (Tokyo Metropolitan Institute of Medical Science) for donating plasmids, p55IgKluci and p55luci.
Prepublished online as Blood First Edition Paper, January 2, 2003; DOI 10.1182/blood-2002-08-2622.
Supported in part by a Grant for Scientific Research from the Japanese Ministry of Education, Science and Culture (project no.13671942).
M.M.R. and A.K. contributed equally to this work.
The publication costs of this article were defrayed in part by page charge payment. Therefore, and solely to indicate this fact, this article is hereby marked “advertisement” in accordance with 18 U.S.C. section 1734.
References
Author notes
Akiko Kukita, Department of Microbiology, Saga Medical School, Nabeshima 5-1-1, Saga, 849-8501, Japan; e-mail: kukita@post.saga-med.ac.jp.





This feature is available to Subscribers Only
Sign In or Create an Account Close Modal