Abstract
We previously described a mouse line that contains green myelomonocytic cells due to the knock-in of enhanced green fluorescence protein (EGFP) into the lysozyme M gene.1 We have now created a transgenic line with fluorescent erythroid cells using a β-globin locus control region driving the enhanced cyan fluorescence protein (ECFP) gene. These mice exhibit cyan fluorescent cells specifically in the erythroid compartment and in megakaryocyte-erythroid progenitors. Crossing the animals with lysozyme EGFP mice yielded a line in which live erythroid and myeloid cells can readily be distinguished by fluorescence microscopy and by fluorescence-activated cell-sorter scanner. This cross allowed unambiguous identification of unstained mixed erythroid-myeloid colonies for the first time. The new mouse lines should become useful tools to dissect the branching between erythroid and myelomonocytic cells during in vitro differentiation of definitive multipotent progenitors.
Introduction
During hematopoietic differentiation multilineage progenitors become gradually restricted in their differentiation potential. Largely through the identification of cell surface marker combinations that are diagnostic for hematopoietic stem cells and intermediate progenitors, a coherent lineage tree has been established.1,2 However, some questions remain: can erythroid cells derive from progenitors other than from megakaryocyte/erythroid progenitors, in a similar way as neurons can be derived from different ancestors in nematodes?3 And, is there a hierarchy of differentiation with, say, erythroid cells differentiating before myeloid cells, as is the case for neural precursors, which differentiate into astrocytes before becoming neurons?4
In the hematopoietic system, real-time observations of differentiation in cultured cells are difficult to perform because lineage assignments based on morphology are possible only during late stages of maturation. A potential way out is the use of lineage-specific antibodies. However, applying antibodies to developing colonies disrupts their architecture and halts their development. Another possibility is to analyze developing colonies from mouse lines in which erythroid and myeloid cells are labeled by fluorescent proteins in vivo. In previous work we have generated a mouse line in which myelomonocytic cells are green fluorescent, due to a knock-in of enhanced green fluorescence protein (EGFP) into the lysozyme locus.5 Here we describe a mouse line in which definitive erythroid cells are labeled with enhanced cyan fluorescence protein (ECFP). In addition, in a cross of this line with lysozyme EGFP mice, erythroid and myeloid cells can be directly visualized and distinguished by fluorescence microscopy.
Study design
β-globin construct and development of transgenic lines
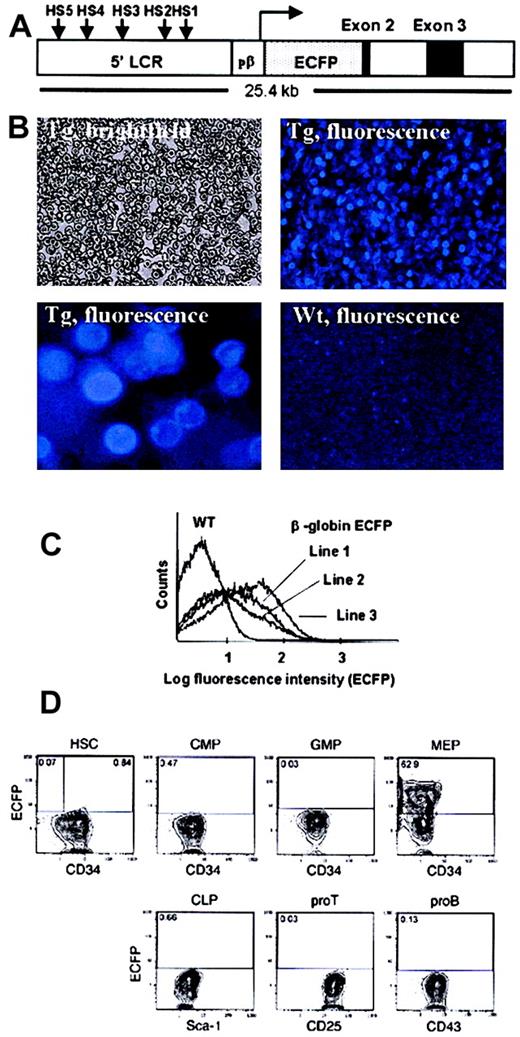
The ECFP gene was excised from pECFP-1 (Clontech, Palo Alto, CA) with NcoI and BsrGI. The resulting fragment was subcloned in a vector containing a 63-bp fragment that encodes a farnesylated peptide that directs the fusion protein to the membrane.6 The farnesylated ECFP (ECFP-far) was polymerase chain reaction (PCR) amplified from this vector, and anNcoI and a BamHI restriction site was introduced for further subcloning. To generate the transgene construct, a 4.1-kbClaI/SalI fragment containing the human β major globin gene was digested with NcoI and BamHI, removing exon 1, intron 1 and part of exon 2, and ECFP-far was inserted. This intermediate was ligated to a 21.7 kilobase (kb)SalI/ClaI fragment containing the entire β major globin locus control region (LCR).7 8The ECFP-far start codon coincides with the endogenous β-globin ATG. After linearization with SalI, a 26.1-kb fragment was generated (Figure 1A), which was injected into Fvb/N oocytes that were subsequently implanted into foster mothers. Of 19 pups born, 3 contained ECFP-positive cells in their peripheral blood.
Development and expression specificity of β-globin transgenic mice.
(A) Diagram of construct used to make the transgenic line. HS indicates DNAse-1 hypersensitive sites within the β-globin LCR; pβ, β-globin promoter. (B) Peripheral blood from a β-globin transgenic (Tg) mouse (line no. 3) and a wild-type (WT) control, viewed under brightfield or fluorescence microscopy. Original magnification, × 20. The second panel showing fluorescent transgenic erythrocytes represents a higher magnification (× 5 of the original). (C) FACS analysis of the peripheral blood from β-globin ECFP transgenic mice (line nos. 1, 2, 3) and a wild-type (WT) control. (D) FACS profiles of hematopoietic progenitors showing ECFP expression. HSCs were sorted as IL-7Rα−Lin−Sca-1+c-Kit+; CMPs as IL-7Rα−Lin−Sca-1−c-Kit+, CD34+, FCgRl0; GMPs as IL-7Rα−Lin−Sca-1−c-Kit+, CD34+FCgRhi ; MEPs as IL-7Rα−Lin−Sca-1−c-Kit+, CD34−FCgRl0; CLPs as IL-7Rα+Lin−Sca-1loc-Kit+; pro–T cells as CD4loCD8loCD25+c-Kit+, and pro–B cells as B220+IgM−CD43+ populations. Numbers indicate percentages of ECFP-positive cells detected within a given quadrant.
Colony assays, immunofluorescence, and benzidine staining
Bone marrow cells of a β-globin ECFP mouse were seeded in 2 mL Methocult 3434 (Stem Cell Technologies, Vancouver, BC, Canada) and incubated at 37°C, 5% CO2. Images were first taken under brightfield and then under fluorescent illumination using a specific ECFP filter (excitation 436 nm, emission 480 nm, dichroic 455 nm; Chroma no. 41044) and an enhanced yellow fluorescent protein (EYFP)–specific filter (excitation at 500 nm, emission 535 nm, dichroic 515 nm; Chroma no. 41028) (both from CHROMA, Brattleboro, VT). The latter filter was used instead of an EGFP-specific filter because it does not detect ECFP, while still detecting EGFP at a 20% efficiency). Acid benzidine staining was as described.9
FACS analyses
Separation of ECFP and EGFP was done according to published procedures10 on a FACS Vantage (Becton Dickinson, Mountainview, CA) using a 458-nm UV laser. ECFP was detected in Channel 1, filter 480/30 nm band-pass filter, and EGFP was detected in channel 2 (530/30 nm BP). A 457-nm long-pass Laser block was inserted in front of each band pass filter, and a 525-nm short-pass dichroic filter was inserted into the light path. Methods described earlier were used for the analysis of the progenitors.1 11Hematopoietic stem cells (HSCs) were sorted as interleukin (IL)–7Rα−Lin−Sca-1+c-Kit+; common myeloid progenitors (CMPs) as IL-7Rα−Lin−Sca-1−c-Kit+, CD34+, FCgRl0; granulocyte-macrophage progenitors (GMPs) as IL-7Rα−Lin−Sca-1−c-Kit+, CD34+FCgRhi ; megakaryocyte-erythrocyte progenitors (MEPs) as IL-7Rα−Lin−Sca-1−c-Kit+, CD34−FCgRl0; common lymphoid progenitors (CLPs) as IL-7Rα+Lin−Sca-1loc-Kit+; pro–T cells as CD4loCD8loCD25+c-Kit+, and pro–B cells as B220+IgM−CD43+ populations. All progenitor populations were first sorted using a double laser (488 nm/350 nm Enterprise II + 647 nm; Spectrum) high-speed cell sorter (Moflo-MLS, Cytomation, Fort Collins, CO). Purified cells were then analyzed by a single laser (457 nm, Larger Argon) fluorescence-activated cell-sorter scanner (FACS) (Epics-Elite; Coulter, Miami, FL) to evaluate ECFP and fluorescein isothiocyanate (FITC) levels.
Results and discussion
Generation and characterization of β globin–ECFP transgenic mouse lines
To generate a mouse line in which erythroid cells are fluorescently labeled, we used a large fragment of the regulatory region of the β-globin gene to drive expression of ECFP.7 Because we wanted to detect the fluorescent protein also in mature red blood cells, ECFP was targeted to the plasma membrane through fusion with a farnesylation signal, generatingecfp-far.6 We then inserted ecfp-farat the β-globin ATG start site to produce a construct that contained a complete β-globin LCR, 815 bp of 5′ flanking sequence, the β-globin 5′ untranslated region, and a 2.8-kb region containing part of exon 2, intron 2, and exon 3 (Figure1A). After verifying that a cytomegalovirus enhancer–driven construct is capable of directing the expression of membrane-bound ECFP in fibroblasts, a linearized version of the transgenic construct was injected into oocytes. Of 19 pups whose blood was examined under the fluorescence microscope, 3 showed a significant proportion of ECFP+cells. These cells had the morphology of erythrocytes and exhibited membrane fluorescence, while no positive cells were seen in wild-type controls (Figure 1B). As determined by FACS, the positive cells were small in size and exhibited low side scatter, again indicative of erythrocytes. Because line no. 3 had the highest proportion of ECFP+ cells (Figure 1C), it was used for all subsequent studies. The reason not all erythrocytes were fluorescence-positive could be due to gene silencing, quenching of ECFP by hemoglobin (the maximum of the excitation spectrum of hemoglobin is at 415 nm12 and that of ECFP is at 425 nm), or the selective degradation of ECFP in aged erythrocytes. The fact that in the bone marrow not all cells were ECFP+ either speaks against the latter interpretation.
ECFP is specifically expressed in Ter119+ erythroid cells and in megakaryocyte-erythrocyte progenitors
To determine whether the ECFP transgene is specifically expressed in the erythroid lineage in vivo, bone marrow and spleen cells were harvested from several 6-week-old transgenic animals and stained with lineage-specific antibodies. Cells were then evaluated by fluorescence microscopy. The results obtained with bone marrow from 2 transgenic mice showed that 84% of the Ter119+ cells were ECFP-positive (1176 total fluorescent cells counted). In contrast, there was essentially no overlap (1% or less) between Mac-1+ and B220+ cells on the one hand and ECFP+ cells on the other (of a total of 990 and 530 fluorescent cells counted, respectively). Qualitatively similar results were obtained by FACS analyses of bone marrow and spleen cell suspensions: while there was a significant overlap between Ter119+ cells and ECFP+ cells, little or no overlap was seen between Mac-1 and B220+ cells on the one hand and ECFP+ cells on the other (data not shown). To determine whether ECFP is expressed in hematopoietic progenitors, bone marrow cells from a transgenic globin–ECFP mouse were depleted from lineage-antigen–positive cells and stained with FITC-conjugated anti-CD34, phycoerythrin (PE)–conjugated anti-FcγRII/III, biotinylated anti–Sca-1, and allophycocyanin (APC)–conjugated anti–c-Kit monoclonal antibodies. Populations corresponding to HSCs, CMPs, GMPs, MEPs, CLPs, as well as pro–T cells and pro–B cells were sorted by FACS. As shown in Figure 1D, the only fraction that contained a significant number of ECFP+ cells were MEPs (63%); a small proportion of the HSC fraction also was weakly positive (0.84%), but none (0.07%) were seen in the subpopulation known to have long-term repopulation potential. It remains to be determined whether the ECFP-positive subfraction of MEPs yields only erythroid or also megakaryocyte colonies.
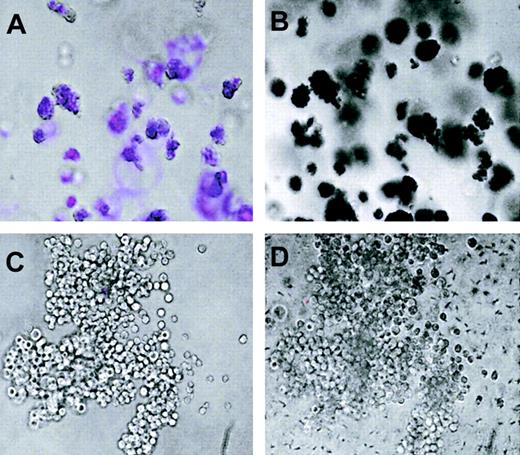
To test whether there is a correlation between ECFP-positive colonies and hemoglobin-expressing colonies, we analyzed day-8 methylcellulose colonies obtained from bone marrow cells of beta globin ECFP mice. Of a total of 500 colonies scored, a large proportion of the colonies resembling morphologically erythroid colony-forming units,erythroid burst-forming units, and mixed colony-forming cells contained cyan fluorescence–positive cells. The position of 21 colonies was marked, each colony photographed first under brightfield and then under fluorescence illumination, overlayed with a benzidine solution, and then photographed under brightfield again. Of 8 colonies that were ECFP-positive, all stained with benzidine, while none of the 13 ECFP-negative colonies did (Figure 2). There is therefore a strict correlation between ECFP and hemoglobin expression in individual colonies.
Methylcellulose colonies from β-globin ECFP mouse bone marrow.
(A,C) Overlay between fluorescence and brightfield images. (B,D) Brightfield images of the same colonies after benzidine staining, with positive cells shown in black. The colony shown in panels A and B is erythroid, and the one in C and D is myeloid. Some cells or clusters within the colonies have shifted position after staining with benzidine. Original magnification, × 10.
A cross between globin ECFP and lysozyme EGFP mice contains cyan erythroid cells and green myeloid cells
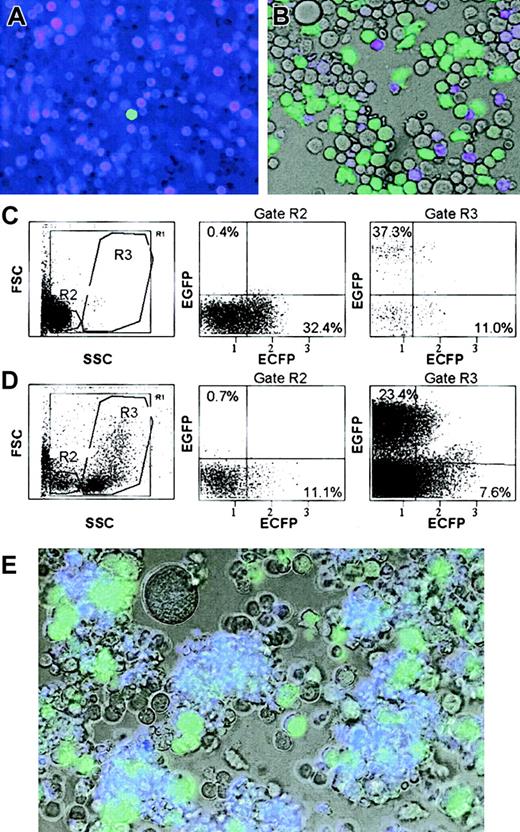
To determine whether it is possible to develop a mouse line in which live erythroid and myeloid cells are distinguishable, we crossed the β-globin ECFP line with lysozyme EGFP mice. As illustrated in Figure 3A-B, in mice of this cross, cyan fluorescent cells can easily be distinguished from green fluorescent myelomonocytic cells in peripheral blood and bone marrow simply by overlaying the images obtained with ECFP and EYFP filters (there is some overlap: green myeloid cells also are detected with the ECFP filter and vice versa. However, the latter can be avoided by using a filter designed for optimal detection of the yellow variant, EYFP, with which ECFP+ cells are not detected). Of 793 cells from bone marrow scored, 13% were ECFP-positive and 48% were EGFP-positive, with 39% being fluorescence-negative. We also analyzed the blood and bone marrow cells from 4 double-transgenic mice by FACS. As shown in Figure 3C-D, although separation between the 2 populations was not perfect, essentially all of the ECFP-positive cells correspond to erythroid cells (small cells with low granularity, gate R2), while the EGFP-positive cells correspond to leukocytes (large cells with low to high granularity, gate R3). The proportion of fluorescence-positive cells in the bone marrow was 4.6% for ECFP and 24.5% for EGFP (n = 2). Staining of the same samples with APC-coupled antibodies revealed no overlap of B220+ cells with ECFP+ and EGFP+ cells, while essentially all the ECFP+ cells were contained in the Ter119+ fraction and the EGFP+ cells in the Mac-1+ fraction (data not shown). The fraction of EGFP-positive cells that also seems to be ECFP-positive (Figure 3D, gate R3) probably represents an artifact of compensation, since double-positive cells should have shown a different localization within the plot,10 and no clear double-positive cells were detected by microscopy. Finally, to determine whether mixed colonies of live cells can be visualized by fluorescence, lin− bone marrow cells of the ECFP/EGFP line were seeded in methylcellulose and day-10 colonies photographed with the filters described above. As illustrated in Figure 3D, mixed erythroid-myeloid colonies could be detected by their content of cyan and green fluorescent cells.
Analysis of hematopoietic cells from a β-globin ECFP x lysozyme EGFP mouse.
(A-B) Overlay of fluorescence microscopic images obtained with ECFP and EYFP filters from blood and bone marrow, respectively (in B, the brightfield image also was included). (C-D) FACS profiles of the same cells. Cells within the gates highlighted in the SSC/FSC plots were analyzed with a laser/filter configuration that allows to distinguish between ECFP and EGFP fluorescence. SSC indicates side scatter; FSC, forward scatter; ECFP and EGFP, log fluorescence intensity in the respective channels. Numbers indicate percentages of cells within a given quadrant. (E) Mixed colony in methylcellulose culture, photographed as in panel B. In addition to numerous small cyan fluorescent (erythroid) and large green fluorescent (myeloid) cells, the colony contains a very large unlabeled cell, possibly a megakaryocyte. Original magnifications: × 20 (A-B, E).
Our results demonstrate that hematopoietic cells of the β-globin ECFP line are specifically labeled within erythroid lineage and erythroid/megakaryocytic precursors. This is perhaps surprising in view of the fact that β-globin can be detected by single-cell PCR not only in MEPs but also in a fraction of HSCs (as well as in CMPs but not in GMPs or lymphoid progenitors).13 Whether this is due to differences in the sensitivity of the 2 techniques, to the posttranslational regulation of β-globin expression, or to other reasons remains to be determined. Previously, an ε-globin EGFP transgenic line that exhibits green fluorescent embryonic erythroid cells14 and β-globin transgenic lines that exhibit LacZ-positive adult erythroid cells15 16 have been described. However, the β-globin ECFP transgenic line described here is the first in which live definitive erythroid cells can be observed. This line and its cross with lysozyme EGFP mice should become useful for the analysis of adult erythroid/myeloid cell differentiation as well as for the study of erythrocyte-macrophage interactions.
We thank Dr Andrew Beavis, Maris A. Handley, John F. Daley, and Ed Kloszewski for assistance with FACS operations, and Dr Florencio Varas for assistance with the fluorescence microscopy. We also thank Dr Tony Hunter for providing the plasmid encoding a membrane localization signal.
Prepublished online as Blood First Edition Paper, September 26, 2002; DOI 10.1182/blood-2002-06-1861.
Supported by National Institutes of Health grant RO1 CA89590-01 (T.G.)
The publication costs of this article were defrayed in part by page charge payment. Therefore, and solely to indicate this fact, this article is hereby marked “advertisement” in accordance with 18 U.S.C. section 1734.
References
Author notes
Thomas Graf, Department of Molecular and Developmental Biology, Albert Einstein College of Medicine, 1300 Morris Park Ave, Bronx, NY 10461; e-mail: graf@aecom.yu.edu.


This feature is available to Subscribers Only
Sign In or Create an Account Close Modal