Abstract
The genetic defects underlying the pathogenesis of acute myeloid leukemia (AML) are still largely unknown. Retroviral insertion mutagenesis in mice has become a powerful tool to identify candidate genes involved in the development of leukemia and lymphoma. We have used this strategy with the 1.4 strain of Graffi murine leukemia virus (MuLV), which predominantly causes myeloid leukemias. Here, we report that Graffi-1.4–induced AML frequently harbors virus integrations in the gene encoding the transcription factor Yin Yang 1 (YY1). These integrations occurred in both orientations, and all were located in the 5′ promoter region of the gene, 0.5 to 1.5 kb upstream of the major transcriptional start site. Luciferase reporter assays showed that virus integration in this region increases promoter activity and renders it independent of a functional binding site for Sp1, a major transcriptional regulator of YY1. We used the murine 32D model to study the consequence of perturbed YY1 expression for myelopoiesis. YY1 protein levels were high in 32D parental cells maintained in interleukin-3–containing medium, but they dropped when the cells were induced to differentiate by granulocyte–colony-stimulating factor (G-CSF). Strikingly, G-CSF–induced neutrophilic differentiation was reduced in 32D cell transfectants ectopically expressing YY1. In similar experiments on primary bone marrow cells, enforced YY1 expression blocked the outgrowth of CFU-GM colonies. Increased YY1 expression was seen in some cases of human AML. Collectively, these data imply a possible role of perturbed expression of YY1 in the development of AML through interference with the myeloid differentiation program in the leukemic progenitor cells.
Introduction
Human acute myeloid leukemia (AML) is a heterogeneous group of diseases with a variable treatment outcome. It is now well established that responses to different forms of therapy depend to a significant extent on the presence of certain genetic defects in the leukemic cells. For instance, chromosomal abnormalities t(8;21) and inv(16)t(15;17) are now being used as important prognostic indicators in AML.1 However, it has also become clear from in vitro and in vivo models that, when isolated, these defects are insufficient to cause leukemia but that additional “hits” in as yet largely unidentified regulatory genes are required for full leukemic transformation of hematopoietic cells.2,3 In addition, in the significant proportion of AML patients who do not have cytogenetic abnormalities, the genes involved in the pathogenesis of the disease remain elusive. Retroviral insertional mutagenesis has become a powerful tool to identify genes implicated in leukemogenesis and lymphomagenesis.2-4 In the past, this method has been tedious, but recently developed strategies using inverse polymerase chain reaction (PCR), direct nucleotide sequencing, and database screening now allow for a rapid and large-scale identification of potential disease genes.4 Importantly, a number of genes identified by this strategy have also been shown to play a role in human hematopoietic malignancies.4-9
Graffi murine leukemia virus (Graffi-MuLV) is an ecotropic retroviral complex causing leukemias in mice.10 This viral complex does not contain oncogenic sequences, but it deregulates genes because of proviral integrations. A subclone of this complex, the Graffi-1.4 strain, predominantly induces myeloid leukemias.10 In these leukemias, known proto-oncogenes such as c-myc, Pim-1,Fli-1, and Spi-1 are rarely affected,11 indicating that other genes involved in Graffi-1.4 MuLV–induced leukemias remain to be discovered.
Yin Yang 1 (YY1, NF-E1, delta, UCRBP, CF1) is a transcription factor of the GLI-Krüppel zinc finger protein family that controls many cellular processes.12-14 Targeted disruption of theYY1 gene leads to embryonic lethality in mice from severe defects in the development of the embryonic and extraembryonic tissues.15 The YY1 gene spans 23 kb comprising 5 exons and encodes a protein of 44 kDa. The gene is located on human chromosome 14q32 and on mouse chromosome 12 and is structurally highly conserved among these species (95% homology at mRNA level).16 Transcription of the YY1 gene is tightly controlled. Besides a major transcriptional start site, the existence of 10 alternative start sites in a (C+G)–rich region lacking a TATA box have been reported.17 YY1 expression is controlled by the transcription factor Sp1, which is expressed in many cell types, including hematopoietic cells.17 18
YY1 has been reported to activate or repress transcription of a large variety of cellular and viral genes.13,14,19 Additionally, YY1 regulates gene expression in a cell-cycle–dependent fashion. This may, at least in part, be due to a control mechanism involving the retinoblastoma protein (Rb), which releases YY1 in the S-phase of the cell cycle.20 The transcriptional activity of YY1 is positively regulated through acetylation of the protein by p300 and PCAF and is negatively regulated by deacetylation by histone deacetylases HDAC1, HDAC2, and HDAC3.21
In this paper, we report that the YY1 promoter region is a frequent target for integration of Graffi-1.4 MuLV and show that the regulation of YY1 expression is perturbed and becomes independent of Sp1 regulation as a result of these integrations. We further show that ectopic expression of YY1 has a negative effect on myeloid differentiation in a cell line model and prevents the outgrowth of myeloid progenitors from primary bone marrow cells. Finally, we present data indicating that in certain cases of human AML, YY1 expression is significantly increased compared with healthy bone marrow cells. Based on these findings, we suggest that the deregulation of YY1 expression can contribute to myeloid leukemia by interfering with the normal myeloid differentiation program.
Materials and methods
Graffi-1.4 MuLV–induced leukemias
Newborn FVB/N mice (younger than 2 days) were injected subcutaneously with 100 μL of a cell culture supernatant of Graffi-1.4 MuLV–producing NIH3T3 cells (a gift from Dr E. Rassart, Departement des Sciences Biologiques, Universite du Quebec a Montreal, Canada). Mice were checked daily for symptoms of illness: apathy, white ears and tail, impaired interaction with cage mates, weight loss, and dull fur. Typically, leukemic mice had enlarged spleens, livers, thymuses, and lymph nodes. From these primary tumors, chromosomal DNA was isolated for PCR-based screening. Blood samples were taken from the heart. For morphologic analysis, blood smears and cytospins were fixed in methanol, stained with May-Grünwald-Giemsa, and analyzed on a Zeiss Axioscope microscope (Carl Zeiss BV, Weesp, The Netherlands).
Immunophenotyping of the leukemic cells
Single-cell suspensions of different organs were analyzed by flow cytometry using a FACScan flow cytometer (Becton Dickinson, Mountain View, CA). Cells were labeled as described previously22 with the following rat monoclonal antibodies: ER-MP54, ER-MP58, M1/70 (Mac-1), F4/80, RB68C5 (GR-1), ER-MP21 (transferrin receptor), TER119 (Glycophorin A), 59-AD2.2 (Thy-1), KT3 (CD3), RA3 6B2 (B220), and E13 161-7(Sca1). Immunodetection was performed using a goat anti-rat antibody coupled to fluorescein isothiocyanate (GαRa-FITC) (Nordic, Tilburg, The Netherlands).
Production of retroviral vectors
The plasmid pCMV-HA-YY1, containing hemagglutinin (HA)–tagged full-length human YY1 cDNA (a gift from Dr Y. Shi, Department of Pathology, Harvard Medical School, Boston, MA) was digested withXbaI and ApaI, and the HA-YY1 fragment was blunted and ligated into the HpaI site of pLNCX and pBabe retroviral vectors.23 24 PhoenixA packaging cells (from G. Nolan, Stanford, CA) were transfected with pLNCX-HA-YY1 or pBABE-HA-YY1 (Protection Mammalian Transfection Systems E-1200; Promega, Madison, WI). Supernatants containing high-titer, helper-free recombinant virus were harvested from 80% confluent producer cells cultured for 16 to 20 hours in Dulbecco modified Eagle medium, (DMEM; Gibco-BRL, Breda, The Netherlands) supplemented with 5% fetal calf serum (FCS), penicillin (100 IU/mL), and streptomycin (100 ng/mL). To determine titers of BABE-HA-YY1 and BABE control virus, the virus particles were pelleted by ultracentrifugation at 41 000 rpm (XL-90; Beckman, Mijdrecht, The Netherlands), and RNA was extracted with phenol (pH = 4.0) and spot-blotted on nitrocellulose filters. This blot was hybridized with a BABE-specific probe (SV40 fragment,BamHI-HindIII digest).
Cell culture and retroviral gene transfer
32D cells.
The interleukin-3 (IL-3)–dependent murine myeloid cell line 32D25 containing the human wild-type G-CSF receptor (32D-WT1) were expanded and differentiated as described.2632D-WT1 cells were infected with pLNCX-HA-YY1 virus and selected with G418 (Gibco-BRL). Several independent clones were expanded for further analysis.
Bone marrow cells.
Hematopoietic cells were harvested from the femurs and tibiae of 8- to 12-week-old FVB mice as described.27 After depletion of adherent cells, the remaining cells were fractionated on a Percoll gradient (AB 17-0891-01; Amersham Pharmacia Biotech, Uppsala, Sweden). Fraction 1 (density 1.058/1.0645) containing the earliest hematopoietic progenitor cells28 was collected. Cells were washed twice in Hanks buffered salt solution (HBSS)/5% FCS/0.5% bovine serum albumin (BSA) and then were prestimulated for 2 days at a final concentration of 5 × 10⁵ cells/mL in Cell Gro (SCGM BE SP047; Boehringer Ingelheim Bioproducts Partnership Heidelberg, Germany) supplemented with a cytokine cocktail composed of murine (m) IL-3 (10 ng/mL), human (h) Flt3-ligand, human thrombopoietin (hTPO), murine stem cell factor (mSCF; 100 ng/mL) and granulocyte macrophage–colony-stimulating factor (GM-CSF; 2 U/mL). Retroviral infection was performed in culture dishes (Falcon 1008; Becton Dickinson) coated with the recombinant fibronectin fragment CH-296 (Takara Shuzo T100A/B; Otsu, Japan)29 at a concentration of 12 μg/mL. Before adding the bone marrow cells, the dishes were preincubated with virus supernatant (BABE-HA-YY1 or empty BABE) for 30 minutes at 37°C. Subsequently, bone marrow cells were resuspended and mixed with fresh virus supernatant in a 1:1 ratio, and a fresh cytokine cocktail was added. Cells (5 × 10⁵) were cultured overnight at 37°C and 5% CO2. Virus supernatant and cytokine cocktail were refreshed again the next day, and cells were cultured for another 24 hours.
Colony assay.
Bone marrow cells were plated at densities of 1 to 5 × 10⁴ cells/mL per dish in triplicate in methylcellulose medium supplemented with 30% fetal bovine serum (FBS), 1% BSA, 0.1 mM 2-mercaptoethanol, 2 mM l-glutamine, and GM-CSF (20 U/mL), with or without 2.5 μg/mL puromycin (Sigma, Zwijndrecht, The Netherlands) to evaluate the infection efficiency of the different retroviruses. Colonies consisting of more than 50 cells were counted on day 7 of culture.
Promoter activity assay
The YY1 promoter–containing subclone pδSS4.5 of λ2417 was digested with restriction enzymesMLuI and BglII. This YY1 promoter fragment was cloned in the luciferase reporter plasmid pGL3 (Promega). The Graffi-1.4 MuLV long terminal repeat (LTR) sequence was cloned in both orientations in the HpaI site. The Sp1 site was mutated with the QuikChange Site-Directed Mutagenesis Kit (Stratagene, La Jolla, CA) by using primer SPIMUTF (5′ GGACGGTTCGGGGCGAGAGC 3′) and primer SPIMUTR (5′ GCTCTCGCCCCGAACCGTCC 3′). As a positive control, pRSV-Luc30 was used. pRSV-β-galactosidase (a gift from C. Berrevoets, Erasmus University, Rotterdam, The Netherlands) was used for reference. Empty pGL3 vector served as a negative control. Luciferase assays were performed in HEK 293 cells. Cells were transfected by CaPO4 precipitation31 with a mixture of 5 μg derived pGL3 plasmid containing different promoter sequences and 2.5 μg pRSV-β-galactosidase, supplemented with empty vector, to a total amount of 20 μg total plasmid per milliliter. Luciferase assays were performed as described,26 and activities were calculated in arbitrary units, relative to β-galactosidase expression.
Twenty-five microliters cell lysate was mixed with 75 μL ONPG solution (0.028 g 2-nitro-phenyl-galacto-pyranosid; Boehringer-Mannheim, Almere, The Netherlands), 50 mL P-buffer (100 mM phosphate buffer, pH 7.0), 10 mM MgSO4, 2.7 mM). Samples were incubated at 37°C for 1 hour. The extinction was measured at 450 nm in a Bio-Rad 450 microplate reader (Bio-Rad, Richmond, CA).
Inverse PCR on Graffi-1.4 MuLV–induced leukemias
Genomic DNA from the primary tumors was digested withHhaI. After ligation (Rapid ligation kit; Roche Diagnostics, Mannheim, Germany), a first PCR was performed using Graffi-1.4 MuLV (LTR) specific primers L1 (5′ TGCAAGATGGCGTTACTGTAGCTAG 3′) and L2 (5′ CCAGGTTGCCCCAAAGACCTG 3′) (cycling conditions were 1 minute at 94°C, 1 minute at 65°C, and 3 minutes at 72°C; 30 cycles). For the second nested PCR, the primers L1N (5′ AGCCTTATGGTGGGGTCTTTC 3′) and L2N (5′ AAAGACCTGAAACGACCTTGC 3′) (15 cycles) were used. The PCR reaction mixture contained 10 mM Tris(tris[hydroxymethyl]aminomethane)–HCl (pH 8.3), 50 mM KCl, 1.5 mM MgCl2, 200 μM dNTP, 10 pmol each primer, and 2.5 U Taq polymerase (Pharmacia, Uppsala, Sweden). PCR fragments were analyzed on a 1% agarose gel and cloned in the TA cloning vector (Invitrogen BV, Carlsbad, CA) according to standard procedures.
Detection of virus integration in the YY1 gene by specific nested PCR
To determine the orientation and localization of the Graffi-1.4 provirus in the YY1 gene in an extended panel of leukemias, nested PCR was performed on 1 μg genomic DNA from primary tumors. For the first PCR, YY1 promoter region-specific primers Y1 (5′ AGGAATCAGGAGCAGAAGAAAGTTTTGGGA 3′) and Y2 (5′ CAATAAAGTCTGCTCTGACGAGAAACGCC 3′), in combination with Graffi-1.4 MuLV LTR-specific primers L1 and L2 were used. Cycling conditions were 1 minute at 94°C, 1 minute at 65°C, and 3 minutes at 72°C, for 30 cycles. For the second PCR, the nested primers Y1N (5′ AAACTCTCTGACTTACCTCCCTCTCCAAAGA 3′) and Y2N (5′ GTTCGTTTTGCCTTTACTCGTTACTCGGG 3′), in combination with the nested primers L1N and L2N (30 cycles), were used. The obtained PCR products were analyzed by Southern blotting. To determine the orientation of the Graffi-1.4 provirus, the blots were hybridized with radiolabeled Y1P (5′ AAAACCTGCACAAGGACACCTTGCTAAGTATGTTT 3′) and Y2P (5′ AGCACACGGTCGGCTACGCTCCGTCCGCTACCGCA 3′) at 45°C in Church buffer (0.5 M phosphate buffer, pH 7.2, 7% [wt/vol] sodium dodecyl sulfate [SDS], 10 mM EDTA [ethylenediaminetetraacetic acid]) overnight. Signals were visualized by autoradiography according to standard procedures.
Nucleotide sequencing
PCR products were cloned in TA cloning vector and sequenced with the M13 forward primer (5′ GACCGGCAGCAAAATG 3′) and M13 reverse primer (5′ CAGGAAACAGCTATGAC 3′) using an ABI 3100 sequencer (Perkin Elmer, Nieuwerkerk a/d IJssel, The Netherlands). Virus-flanking genomic sequences were identified using the National Center for Biotechnology Information (NCBI) database.
Western blotting
Lysates of 32D cells were prepared and subjected to Western blotting as described previously.32 Antibodies used to visualize YY1 were goat anti-YY1 (Santa Cruz Biotechnology, CA) or rabbit anti-HA (Y-11, sc-805) for HA-tagged YY1. Rabbit anti-Sp1 (a gift from Dr G. Suske, Philipps-University, Marburg, Germany) was used for the detection of Sp1. Goat anti-actin (I-19, sc-1616; Santa Cruz Biotechnology) was used to control for equal loading of lysates.
Real-time quantitative PCR on human AML samples
Human AML cells were obtained following informed consent and were purified as previously described.33 These purified blast fractions consisted of more than 95% myeloblasts. Total RNA was extracted with guanidinium thiocyanate and was purified by cesium chloride gradient centrifugation. RNA was transcribed into cDNA under standard conditions using Superscript (Life Technologies, Merelbeke, Belgium) and random hexamers. Real-time PCR amplification (ABI PRISM 7700 Sequence Detector; PE Biosystems, Nieuwerkerk a/d IJssel, The Netherlands) was performed in a mix of 50 μL containing 2 μL cDNA, 250 μM dNTP (Amersham Pharmacia Biotech, Roosendaal, The Netherlands), 3 mM MgCl2, 15 pmol primers, 200 nM Taqman probe, labeled 5′ with reporter dye FAM (6-carboxy-fluorescein) and 3′ with quencher dye TAMRA (6-carboxy-tetramethyl-rhodamine; Eurogentec, Maastricht, The Netherlands), 1.25 U AmpliTaq Gold (PE Applied Biosystems), 5 μL 10 × buffer A (PE Applied Biosystems), and 30 μL H2O. Cycling conditions were 2 minutes at 50°C and 10 minutes at 95°C, followed by 45 cycles of denaturation (15 seconds at 95°C), and annealing/extension (1 minute at 60°C). For YY1, forward primer (5′ ATACCTGGCATTGACCT 3′) and reverse primer (5′ TGAGGGCAAGCTATTGT 3′) were used. The YY1 Taqman probe was 5′ GAATGAAGCCAAGAAAAATTAAAGAAGATGT 3′. The housekeeping gene porphobilinogen deaminase (PBGD) was taken as endogenous reference (PBGD forward primer 5′ GGCAATGCGGCTGCAG 3′;PBGD reverse primer 5′ GGGTACCCACGCGAATCAC 3′;PBGD Taqman probe 5′ CATCTTTGGGCTGTTTTCTTCCGCC 3′). All samples were tested in duplicate, and average values were used for quantification. The expression of YY1 in patient samples relative to YY1 expression in healthy bone marrow (n = 6) was calculated according to manufacturer's instructions (user bulletin 2; ABI PRISM 7700 Sequence Detector; PE Biosystems).
Results
Graffi-1.4 MuLV–induced leukemias
Leukemias developed 4 to 6 months after subcutaneous injection of newborn FVB/N mice with Graffi-1.4 MuLV. Forty-eight of 59 (81%) leukemias analyzed exhibited morphologic characteristics of myeloid cells. Blast cell percentages in the bone marrow ranged from 24% to 90%, with an average of 48%. Leukemia cells expressed immunophenotypic marker profiles consistent with their myeloid appearance—for example, ER-MP54+, ER-MP58+, CD3−, GR-1+. Six leukemias with blastlike morphology showed no immunophenotypic differentiation markers, suggesting that these tumors represented immature leukemias. Only 3 leukemias were of T-lymphoid origin (CD3+/MP58−/Thy1+), and 2 showed mixed myeloid and erythroid features (Ter119+/ER-MP58+/F4/80+). These results demonstrate that Graffi-1.4 MuLV infection predominantly induces myeloid leukemia in FVB/N mice.
Virus integrations in the YY1 gene
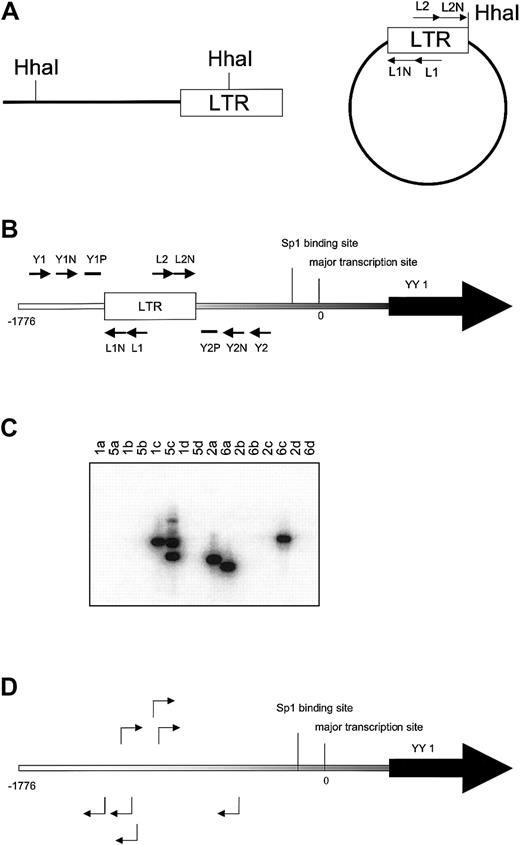
Inverse PCR was used to identify genomic sequences flanking Graffi1.4 MuLV integrations (Figure 1A). Integrations were found in several genes previously demonstrated to be involved in MuLV-induced leukemias (eg, Notch-1, Nf1, p53, Fli-1, Evi-1) and in several novel loci (S.J.E. et al, manuscript in preparation). One of these newly identified integrations occurred in the YY1 locus, approximately 0.8 kb upstream of the transcriptional initiation site. In a subsequent analysis on independent cell samples using nested PCR with LTR and YY1 primers (Figure 1B-C), we found 23 integrations in the same region, 0.5 to 1.5 kb upstream of the transcriptional start site, in 14 of 20 leukemias tested. Integrations occurred in both orientations at an approximately equal ratio. Representative examples of these integrations are shown in Figure 1D. Searches for virus integrations in other parts of the gene using appropriate primer sets were negative (data not shown). It is of note that in some leukemia samples multiple integrations were detected, indicating that the Graffi-1.4 MuLV–induced leukemias are oligoclonal.
Identification of common virus integrations in the YY1 locus.
(A) Inverse PCR. Genomic DNA from leukemia cells was digested withHhaI. After ligation PCR was performed with primers L1 and L2 followed by a nested PCR with primers L1N and L2N to amplify LTR-flanking fragments from circularized DNA.(B) Nested PCR with LTR and YY1 primers to detect position and orientation of Graffi-1.4 MuLV integration in the YY1 promoter region. The lowercase letters indicate the position at the promoter in base pairs (bp). The first PCR was performed with the primer sets L1, Y1 (a), L1, Y2 (b), L2, Y1 (c), and L2, Y2 (d), followed by a nested PCR with primers L1N, Y1N (a) and L1N, Y2N (b), L2N, Y1N (c), and L2N, Y2N (d). Probes Y1P and Y2P were used to analyze the specificity of the PCR band by Southern blot. (C) Example of Southern blot analysis to determine virus integration and orientation in the 5′ region of the YY1 gene. Results depicted are from DNA samples of leukemias 1, 2, 5, and 6. PCR products from the 4 different primer combinations (a, b, c, and d) were analyzed. In this example, the blot was hybridized with probe Y1P. The presence of the band in lane 1c indicates that tumor 1 has a virus integration in the reverse orientation. Tumor 5 has 2 YY1 virus integrations in the reverse orientation (lane 5c). Tumor 2 has an integration in the forward orientation (lane 2a). Tumor 6 harbors 2 integrations in both orientations (lanes 6a and 6c). All bands were sequenced to determine the exact location of virus integration. (D) Examples of virus integrations and orientations found in the YY1 promoter.
Integration of Graffi-1.4 MuLV LTR deregulates YY1 transcription
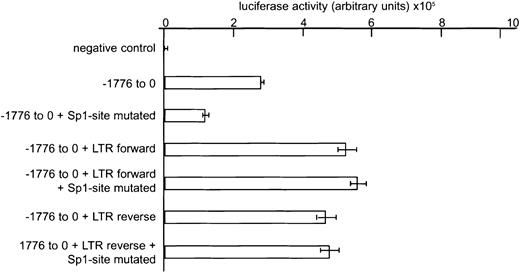
Because integration of the virus occurred in both orientations, we considered it most likely that viral enhancer sequences in the LTR cause increased YY1 transcription in these types of leukemia. Integration in the promoter region of a gene, however, does not always result in alterations in expression. For instance, the common ecotropic virus integration 12 (Evi12) is located approximately 1 kb upstream of the transcriptional start site of theTra1/Grp94 gene but does not modulate its expression.34 We first compared YY1 expression in the murine leukemias with and without virus integration by Northern and Western blot analyses but found no major differences between the groups (data not shown). However, because virally induced leukemias are oligoclonal2,4 (and S.J.E. et al, unpublished data), abnormalities in expression of YY1 in a subset of leukemia cells might go undetected by these techniques. As an alternative approach, we introduced the Graffi-1.4 LTR in theHpa1 site at position −1417 in the YY1 promoter and quantified transcriptional activity using a transient reporter assay (Figure 2). Twofold higher YY1 promoter activity was measured following insertion of the Graffi-1.4 MuLV LTR, irrespective of the orientation of the LTR (Figure 2). Because an Sp1-binding site at position −48 to −39 has previously been shown to be important for the induction of YY1 transcription,17 we also studied the effects of insertion of the Graffi-1.4 MuLV LTR after disruption of this site. Although mutation of the Sp1-binding site resulted in a 50% reduction of normal promoter activity, the enhanced promoter activity caused by the integration of the LTR sequence was not affected (Figure 2). This result demonstrates that virus integration causes enhanced and Sp1-independent transcription of YY1.
Effects of Graffi-1.4 LTR integration in the YY1 promoter region on gene transcription.
Luciferase assays were performed in HEK 293 cells. One representative experiment of 3 is shown. Error bars represent the SD of the mean values of 3 independent experiments. Negative control: empty pGL3 vector. Reporter gene expression was calculated in arbitrary units, relative to β-galactosidase expression.
Ectopic expression of YY1 blocks G-CSF–induced neutrophilic differentiation of 32D cells
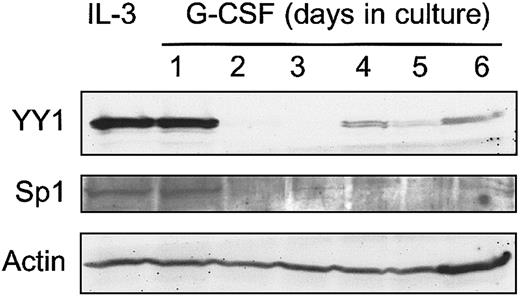
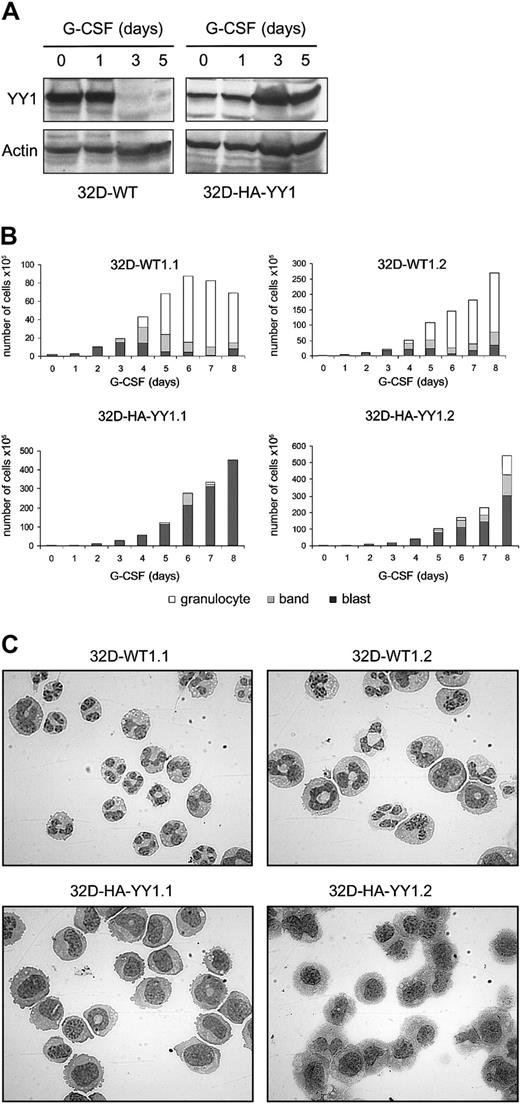
The observation that integration of Graffi MuLV LTR alters the expression of YY1 in murine acute myeloid leukemia raised the question whether perturbed YY1 expression might affect myeloid cell differentiation. We have previously developed 32D cell clones expressing human G-CSF receptors (32D-WT1 cells) as a model to study neutrophilic differentiation.26 Endogenous YY1 levels are high in parental 32D-WT1 cells cultured in IL-3–containing medium, under which conditions the cells remain immature (Figure3). However, on transfer of the cells to a G-CSF–containing medium, in which cells undergo neutrophilic differentiation, YY1 protein levels declined from day 2 onward and remained low for the entire culture period (Figure 3). In view of the regulatory role of Sp1 in YY1 expression, we also looked at Sp1 levels and found that expression of Sp1 was down-regulated in the same time frame after switching the cells to G-CSF. These results raise the possibility that YY1 levels were reduced as a consequence of lowered Sp1-controlled transcription. To determine the consequences of perturbed YY1 expression for myeloid cell development, we ectopically expressed HA-tagged YY1 in these cells. As expected, YY1 expression in 32D-HA-YY1 cells remained high after the cells were switched to G-CSF (Figure 4A). Growth rate and morphology of 32D-HA-YY1 cells cultured in IL-3–containing medium were similar to nontransduced control cells (data not shown). Strikingly, when 32D-HA-YY1 cells were switched to G-CSF–containing medium, neutrophilic differentiation was markedly reduced (Figure 4B-C). Instead, cells with a blastlike morphology expanded exponentially for 8 days in these cultures (Figure 4B) and rapidly died thereafter as a result of apoptosis (data not shown). Thus, sustained YY1 expression prevented G-CSF–induced myeloid differentiation of 32D cells without affecting the apoptotic response that normally accompanies G-CSF–induced differentiation.
Western blot analysis of YY1 expression in 32D-WT1 cells.
G-CSF responsive 32D-WT1 cells were cultured in IL-3–containing medium and then switched to G-CSF. Samples were taken daily and processed as described in “Materials and methods.” The blot was hybridized with anti-YY1 or anti-Sp1, stripped, and rehybridized with anti-Actin to check for equal loading of cell lysates.
Ectopic expression of HA-YY1 in 32D cells inhibits neutrophilic differentiation.
(A) Western blot analysis with anti-YY1 in 32D-WT1 and with anti-HA antibodies in 32D-HA-YY1 cells after switching the cells from IL-3– to G-CSF–containing medium on t = 0 days. The blot was reprobed with anti-actin antibodies for loading control. (B) Differential cell count (blasts, band form, and segmented nuclei) of 2 representative 32D-WT1 and 2 representative 32D-HA-YY1 clones. (C) Micrographs showing morphology of 32D-WT1 and 32D-HA-YY1 clones on day 5 (original magnification, × 1000).
Ectopic expression of YY1 blocks CFU-GM colony formation
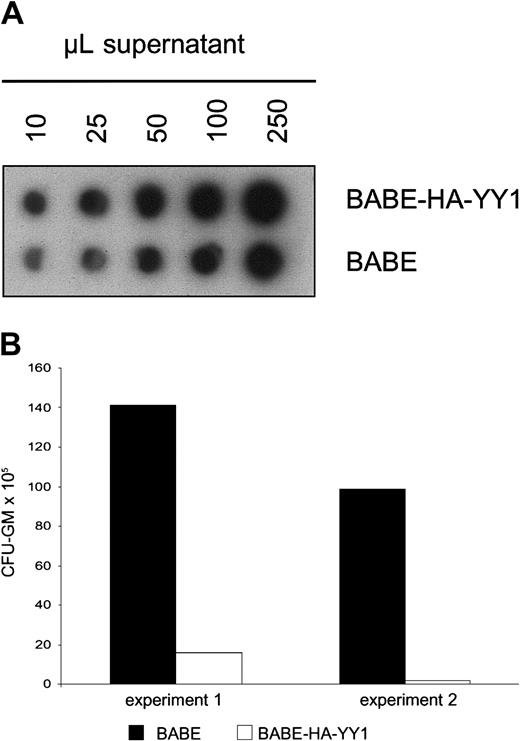
The above-mentioned experiments indicated that constitutive expression of YY1 interferes with G-CSF–induced myeloid differentiation in 32D cells. We next wanted to investigate how perturbed expression of YY1 affects the outgrowth of primary myelomonocytic progenitor cells (granulocyte macrophage–colony-forming unit [CFU-GM]). To this end, we retrovirally transduced mouse bone marrow cells with BABE-HA-YY1 or empty BABE virus and plated these in GM-CSF–containing colony assays. Notably, control bone marrow cells were subjected to equivalent titers of control virus (Figure5A) to exclude that differences in colony outgrowth were caused by variations in transduction efficiencies. Strikingly, GM-CSF–induced colony formation by HA-YY1–transduced bone marrow cells was almost completely blocked (Figure 5B). This result suggests that perturbed expression of YY1, instead of interfering with differentiation, causes a growth arrest or results in premature apoptosis of CFU-GMs or their direct progeny.
GM-CSF–induced colony formation by primary bone marrow cells after retroviral transduction of YY1.
(A) RNA spot blot analysis of supernatants containing BABE/HA-YY1 or BABE vector control virus, showing that titers used for infection were comparable. The filter was hybridized with a BABE-specific cDNA probe. (B) GM-CFU assay of primary bone marrow progenitor cells following infection with BABE-HA-YY1 or BABE control virus. Bone marrow cells were plated in triplicate at densities of 10 to 50 × 103 cells per dish in 1 mL methylcellulose medium containing GM-CSF (20 U/mL) and puromycin (2.5 μg/mL). Two independent experiments are shown.
YY1 expression in human AML
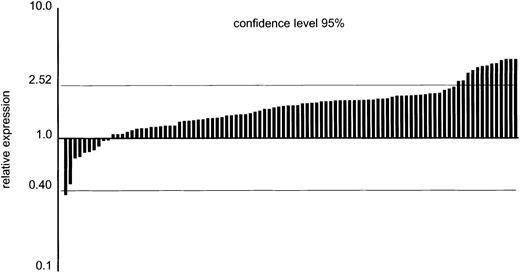
An important question is whether increased levels of YY1 expression can also be found in human AML cells, which would be suggestive of a possible involvement of abnormal YY1 expression in human disease. We performed real-time quantitative PCR on cDNAs from 94 patients with AML and 6 healthy volunteers. As shown in Figure6, YY1 transcript levels in most patients did not significantly differ from healthy bone marrow cells. However, in 13 patients, mRNA levels significantly exceeded those of the healthy bone marrow controls.
Real-time quantitative PCR analysis of YY1 transcripts in 94 patients with AML.
Data are relative to the mean expression in healthy bone marrow samples (n = 6), with 95% confidence limits indicated by the horizontal lines. AML data represent the mean of 2 independent experiments. The 95% confidence interval was calculated as: Xmean (6 NBM samples) ± (1.96 × SD).
Discussion
In this study, we demonstrated that the gene encoding the transcriptional regulator YY1 is located in a new common virus integration site in Graffi-1.4 MuLV–induced myeloid leukemia. The integrations occurred exclusively in the 5′ promoter region of the gene, 0.5 to 1.5 kb upstream of the major transcriptional start site. Data from luciferase reporter assays strongly suggested that these integrations result in the dysregulation of YY1 expression. The pattern of virus integrations indicated that Graffi-1.4 MuLV–induced leukemias are oligoclonal, which is consistent with observations on leukemias induced by other MuLVs2,4 (and S.J.E. et al, unpublished data). The YY1 gene has already been identified once by inverse PCR as a site of retroviral integration in BXH2 leukemia/lymphoma.4 Although the exact site of integration and the type of leukemia/lymphoma were not specified in this study, the finding that the YY1 locus is affected by distinct MuLV types in different mouse strains indicates that the deregulation of YY1 may be more common in the development of various hematologic malignancies in mice.
Perturbed expression of YY1 inhibited G-CSF–induced myeloid differentiation in 32D cells and prevented the clonal outgrowth of CFU-GM progenitor cells. Importantly, we observed that integration of Graffi-virus LTR sequences enhanced YY1 transcription and made it entirely independent of the recognition site for the transcription factor Sp1, which has been shown to play a pivotal role in YY1 expression. Although Sp1 expression has been reported to be high in hematopoietic cells, it is down-regulated during differentiation in many cell types.18 Indeed, we found that Sp1 declined in 32D cells after 2 days of G-CSF–induced differentiation (Figure 3). Therefore, we suggest that the bypass of Sp1 transcriptional control might be one of the mechanisms by which viral integration deregulates YY1 protein levels in leukemic cells. To establish whether down-regulation of YY1 resulted from G-CSF–induced differentiation rather than from simply switching the cells from IL-3– to G-CSF–containing medium, we also analyzed YY1 expression in IL-3–dependent Ba/F3 transfectants expressing the G-CSF-R. These cells proliferate, but they do not undergo differentiation in response to G-CSF. Because YY1 levels remained high in Ba/F3–G-CSF-R cells (data not shown) cultured in G-CSF–containing medium, it appears most likely that YY1 expression is reduced during G-CSF–induced differentiation. This notion is further supported by observations in 32D cells expressing a truncated G-CSF receptor,35 which fails to differentiate in response to G-CSF and retains YY1 expression at a level comparable to that of cells cultured in IL-3 (data not shown).
A major question that remains to be addressed is how deregulation of YY1 expression leads to the observed defects in myeloid cell development. In view of the myriad proposed functions of YY1, multiple possibilities can be envisaged that are not mutually exclusive. First, it is conceivable that constitutive YY1 expression directly influences the transcriptional regulation of genes controlling myeloid cell development. This might be due either to the action of YY1 as a positive regulator of transcription or to its repressor activity. With regard to the latter, it is of interest that YY1 interacts with the EED-EZH (enhancer of Zeste) polycomb complex (PcG) involved in transcriptional repression. In this context, YY1 plays a role in targeting the PcG complex to specific DNA sequences and recruiting HDACs, which associate with both YY1 and EED.36,37It is conceivable that the deregulation of YY1 could cause sustained repression of multiple target genes critical for granulocytic differentiation. In fact, altered recruitment of HDACs has already been implicated in the deregulation of myeloid differentiation by a number of transcription factor fusion proteins generated by specific translocations—PLZF-RARα t(11;17),38 PML-RARα t(15;17),39 and AML1-ETO t(8;21).40 41
An alternative mechanism by which YY1 can influence cell fate is by forming complexes with other protein regulators, including the c-Myc and retinoblastoma (Rb) proteins.20,42,43 A previous study has demonstrated that YY1 protein binds to Rb in a cell-cycle–dependent manner.20 In the G0/G1 phase of the cell cycle, YY1 is in a complex with Rb and cannot bind DNA but is released from this complex when cells enter into S-phase, thereby regaining its DNA-binding activity.20 The Rb protein family comprises 3 members, Rb, p107, and p130. Rb and p107, but not p130, are abundantly present in 32D cells proliferating in IL-3–containing medium. Conversely, on G-CSF–induced differentiation, Rb and p107 levels declined as p130 protein levels dramatically increased, suggesting that p130 plays a role in the induction of myeloid differentiation.44 Based on these findings, we hypothesized that the overexpression of YY1 might result in sustained binding to p130 and thereby might interfere with differentiation. Although we confirmed that YY1 can form a complex with Rb in coimmunoprecipitation assays, we have been unable to detect such an interaction of YY1 with the p130 or p107 proteins (data not shown).
An important extension of this work is to determine whether abnormalities in YY1 expression may also contribute to the pathogenesis of human hematopoietic malignancies. In a first attempt to address this question, we performed real-time quantitative PCR on cDNAs from purified human AML blasts and observed that in 13 patients, the expression of YY1 was significantly elevated compared with that in healthy bone marrow controls. Although this would argue in favor of the possibility that YY1 transcript levels are abnormal in these patients, accurate comparisons are difficult because healthy bone marrow contains a mixture of cell types of different lineages in various stages of maturation. Identification of the genes controlled by YY1 during myelopoiesis and a more detailed understanding of the signaling pathways influenced by YY1 in hematopoietic cells will be required to shed light on how perturbations in these processes contribute to the development of human AML.
We thank Dr E. Rassart for the Graffi-1.4 MuLV. We also thank Drs Joanna Prasher, Bart Aarts, and Marieke von Lindern for their comments on this manuscript and Karola van Rooyen for assistance with the preparation of figures.
Prepublished online as Blood First Edition Paper, September 12, 2002; DOI 10.1182/blood-2002-04-1207.
Supported by grants from the Dutch Cancer Society and the Erasmus University Medical Center (breedtestrategie).
The publication costs of this article were defrayed in part by page charge payment. Therefore, and solely to indicate this fact, this article is hereby marked “advertisement” in accordance with 18 U.S.C. section 1734.
References
Author notes
Ivo P. Touw, Department of Hematology, Erasmus University Rotterdam, PO Box 1738, 3000 DR Rotterdam, The Netherlands; e-mail: touw@hema.fgg.eur.nl.

This feature is available to Subscribers Only
Sign In or Create an Account Close Modal