Recent studies have identified older, low-density sickle red blood cells (SSRBCs) that were resistant to dehydration by valinomycin, a K+ ionophore. These cells, thought to derive from dense SSRBCs that have rehydrated, may represent a terminal cellular phase. To study rehydration, we subjected dense SSRBCs (ρ > 1.107 g/cc) to either oxygenated incubation or rapid oxygenated/deoxygenated (oxy/deoxy) cycling (70 seconds per cycle). Light cells (ρ < 1.087 g/cc) were generated during both oxy incubation (2.9% ± 2.1%; n = 42) and oxy/deoxy cycling (5.3% ± 2.4%; n = 42). The rehydrated cells were K+-depleted (K+ = 20 ± 14 mmol/kg hemoglobin [Hb]) and Na+-loaded (Na+ = 394 ± 106 mmol/kg Hb), and had high levels of external phosphatidylserine. In the presence of external calcium, the generation of rehydrated SSRBCs was inhibited during oxy/deoxy cycling, but the percentage with external phosphatidylserine increased. The calcium-mediated inhibition of rehydration was reversed by charybdotoxin, implying that rehydration was delayed in some cells by the Ca++-activated K+ channel. Preincubation of dense SSRBCs with DIDS (4,4′-di-isothiocyanato-2,2′-disulfostilbene) inhibited the generation of light cells during fast oxy/deoxy cycling, but not during oxy incubation. These results suggest that the sickling-induced pathway, previously implicated in SSRBC dehydration, may be involved in the deoxy-dependent component of rehydration for dense, K+-depleted cells. Light-cell generation was inhibited by 1 mM bumetanide during both oxy incubation and oxy/deoxy cycling, providing evidence that a bumetanide-sensitive, deoxy-independent pathway, previously described in circulating light SSRBCs, also contributes to the rehydration of high-density SSRBCs.
Introduction
Sickle red blood cells (SSRBCs) contain a significant population of abnormally dense, dehydrated, K+-depleted cells.1 These dense cells are thought to play an important role in the pathophysiology of sickle cell disease2,3 since sickle hemoglobin (HbS) polymerization increases markedly at higher intracellular concentration.4
Erythrocyte hydration state is controlled primarily by monovalent cation content, and dehydration results from K+ depletion without equivalent Na+ uptake.5 Dehydration appears to involve the nonselective sickling-induced pathway and 2 high-capacity K+ transport pathways: the K+-Cl− cotransporter (KCC), and the Ca-activated K+ channel (KCa), also known as the Gardos channel.6 The sickling-induced pathway leads to slow cation loss and dehydration owing to (1) imbalance of K+ loss over Na+ gain in the presence of external Ca++,7,8 and (2) activation of the Na+ pump (3 Na+ out for 2 K+ in) in response to increased intracellular Na+.9 In addition, the sickling-induced pathway mediates Ca++influx, which produces rapid K+ loss by transient activation of the KCa.7,10,11 The sickling-induced pathway is inhibited by DIDS (4,4′-di-isothiocyanato-2,2′-disulfostilbene),10,12nifedipine,13 and dipyridamole.13,14 The KCa is activated when intracellular Ca++ is increased to approximately 50 to 150 nM,15 and is capable of mediating a large K+ efflux.3Administration of the imidazole antimycotic clotrimazole, an inhibitor of the KCa, results in increased erythrocyte hydration and K+ content in a sickle mouse model16and in patients with sickle cell disease.17 The KCC is active in reticulocytes, especially sickle reticulocytes, but not in mature RBCs.18 This pathway is probably not active in older, dense sickle cells.
In addition to dehydrated cells, there are also a substantial number of low-density SSRBCs. Many, but not all, of these light cells are reticulocytes. Etzion et al19 examined Ca++-independent K(86Rb) fluxes in low-density (ρ < 1.087 g/cc) SSRBCs, and found 2 distinct flux components, suggesting the presence of a subpopulation of light cells with high K(86Rb) flux. The high-flux component was ouabain-resistant and was inhibited by 1 mM bumetanide. In later studies, Bookchin and colleagues20 isolated a small fraction of low-density sickle cells on the basis of their resistance to dehydration by valinomycin or by activation of KCa during incubation with ionophore A23187 and Ca++. These cells were not reticulocytes (and therefore older than the majority of cells in this fraction) and were Na+-loaded and K+-depleted. They exhibited a rapid ouabain-resistant, K(86Rb) transport pathway that was partially inhibited by 1 mM bumetanide, similar to the rapid turnover cells described by Etzion et al.19 These data suggest a novel, bumetanide-sensitive pathway in older, Na+-loaded, light cells. However, the importance of this pathway in the genesis of older light cells was not directly addressed in these studies.
Recently, Franco et al21 used a biotin label technique to track density changes of SSRBCs in vivo with time, and demonstrated the presence of nonreticulocyte, light (ρ < 1.083 g/cc) cells, which persisted throughout the study. These cells were also shown to be valinomycin resistant,22 suggesting they were Na+-loaded and K+-depleted. The prolonged presence of these older, light, labeled, valinomycin-resistant cells implies that they are continuously replaced by rehydration of denser, labeled cells as a result of compromised cellular volume regulation. They may represent the same population of cells described by Bookchin et al20 and Etzion et al.19
In 1987, Horiuchi and Asakura23 examined in vitro density changes in the dense, dehydrated, SSRBC fraction (ρ > 1.12 g/cc) during slow, cyclic oxygenation and deoxygenation (oxy/deoxy). They found that some dense SSRBCs converted to light SSRBCs after 4 hours of oxy/deoxy cycling. These light cells had decreased K+ and a markedly increased Na+ concentration. The presence of external Ca++ decreased light cell formation.
The experimental results cited above show the presence of older, low-density, K+-depleted and Na+-loaded SSRBCs, and suggest they are formed by rehydration of dense SSRBCs. This study was designed to evaluate the in vitro conditions under which dense sickle cells rehydrate and to provide information concerning the responsible cation transport pathway(s). A preliminary report of this work has appeared previously.24
Materials and methods
Blood samples
Blood was drawn into heparinized vacutainers after informed consent from 11 subjects with homozygous sickle cell disease, who were clinically stable and had not received transfusions in the previous 3 months. Approval for these studies was obtained from the University of Cincinnati College of Medicine institutional review board and informed consent was obtained according to the Declaration of Helsinki. Blood samples were stored at 4°C and used within 24 hours (37 experiments) or 48 hours (6 experiments).
Incubation media and inhibitors
Unless otherwise noted, chemicals were from Fisher Scientific (Fair Lawn, NJ). Buffer A contained the following: 135 mM NaCl, 5 mM KCl (EM Science, Gibbstown, NJ), 1 mM MgCl2, 20 HEPES (N-2-hydroxyethylpiperazine-N′-2-ethanesulfonic acid), 1 mM Na2 HPO4 · 7 H2O, 10 mM glucose (Sigma, St Louis, MO), 0.1 mM ethyleneglycoltetraacetic acid (EGTA), pH with NaOH to 7.4 at 37°C, and 290 to 305 mOsm/kg. Buffer B consisted of buffer A with 1.5 mM CaCl2substituted for EGTA. Buffer C contained 140 mM NaCl, 2.5 mM CaCl2, and 10 mM HEPES, pH 7.4. Phosphate buffered saline (PBS) contained 146 mM NaCl, 1.36 mM NaH2PO4 · H2O, 8.35 mM Na2HPO4 · 7 H2O, pH 7.4, 280 to 300 mOsmol/kg.
DIDS (Molecular Probes, Eugene, OR) was added from a 5-mM stock solution freshly prepared in buffer A. Ouabain (Sigma) was added from a 10-mM stock solution in buffer A. Bumetanide (3-[aminosulfonyl]-5-[butylamino]-4-phenoxybenzoic acid) (Sigma) was added from a 100-mM or 1-mM stock solution in dimethyl sulfoxide (DMSO) (Sigma). Calcium ionophore A23187 (Sigma) was added from 1.2 mM stock solution in DMSO. Charybdotoxin (ChTX) (Peptides International, Louisville, KY) was added from a 100-μM stock solution in distilled water. Appropriate delivery medium was added to the controls.
Primary density gradients
Blood samples were washed 3 times in PBS and suspended at 50% hematocrit in PBS. Cell suspensions were fractionated with a discontinuous OptiPrep (Nycomed Pharma, Oslo, Norway) density gradient. OptiPrep, a 60% (wt/vol) iodixanol solution, was diluted with 1M HEPES-NaOH to a final concentration of 20 mM HEPES, and the pH was adjusted to 7.4. This stock solution was diluted with a solution containing 145 mM NaCl and 20 mM HEPES (pH 7.4) to produce the final desired density, which was verified with a densitometer (model OA-110M; Mettler-Toledo, Westerville, OH). The densities used were 1.077, 1.087, 1.097, and 1.107 g/cc, all with 285 to 305 mOsmol/kg as measured by a vapor pressure osmometer (model 5520; Wescor, Logan UT). Discontinuous gradients, containing 2.5 mL each density, were prepared by sequential underlayering in 15 mL polypropylene tubes (Becton Dickinson, Franklin Lakes, NJ). Finally, 1 mL of 50% SSRBCs was loaded atop each discontinuous gradient and centrifuged (Eppendorf 5810 R, rotor A4-62; Westbury, NY) at 1000 relative centrifugal force for 30 minutes at 22°C.
After centrifuging, the high-density cells (ρ > 1.107 g/cc) were isolated and washed in PBS. Aliquots were separated into 1 of 2 experimental buffers (with and without inhibitors) and resuspended at 10% hematocrit. Then, each cell suspension was split in half, giving 4 samples: 2 for oxy/deoxy cycling (with and without inhibitor) and 2 for oxy incubation (also with and without inhibitor). The cycled cell suspensions underwent 90 minutes of oxy/deoxy cycling in the Fast Cycle Apparatus (FCA; see below), while the oxy suspensions were incubated at 37°C in the same water bath with gentle mixing for the same time period. The final hematocrit was 1% in all samples.
Fast cycle apparatus (FCA)
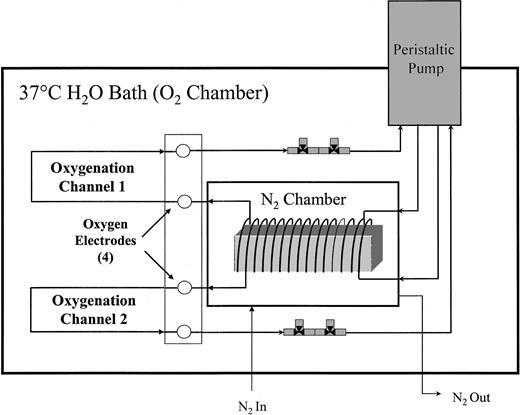
The FCA, as diagrammed in Figure1, is a dual channel, in vitro circulation system for red cell oxy/deoxy using gas-permeable silicone tubing (0.058-inch inner diameter) (Specialty Manufacturing, Saginaw, MI). This system was a modification of a previously described apparatus.25 The entire FCA is submerged in a shaking water bath at 37°C, oscillating at 60 cycles per minute with a 2-inch displacement to facilitate oxygen exchange. A 10% cell suspension was introduced into the FCA via a 3-way stopcock valve (Cole-Palmer, Vernon Hills, IL), while withdrawing an equal volume of buffer to maintain constant system volume and pressure. The cell suspension entered the FCA just proximal to the peristaltic pump where the pressure was lowest. From the pump, in nonpermeable tubing (Tygon; Cole-Parmer, Vernon Hills, IL), the cell suspension went to the deoxygenator, which consisted of a 190-cm coil of gas-permeable tubing wrapped around a wooden frame in a N2-purged, cylindrical chamber. As the cell suspension flowed through the tubing, oxygen diffused from the cell suspension through the permeable tubing to the oxygen-deprived chamber. Upon exiting the deoxygenator, the oxygen partial pressure (pO2) of the cell suspension was measured with a Clark electrode (model 730; Diamond General, Ann Arbor, MI). The cell suspension was then oxygenated while flowing through 172 cm identical gas-permeable tubing immersed in the bath fluid. After oxygenation, the oxygen partial pressure was again measured with a Clark electrode as the cell suspension returned to the pump through a continuous, closed circuit. The total volume per channel was 8.3 mL, and the flow rate was 7.1 mL/min, giving a cycle time of 70 seconds with approximately 32 seconds in the deoxygenator, 27 seconds in oxygenation, and 11 seconds in the pump and connective tubing (also oxygenated). Total cycling time was 90 minutes. The calculated maximum shear stress on the cells was lower than 4 dyne/cm2, much less than the threshold value (approximately 100 dyne/cm2) for shear-dependent K+-transport activation in normal RBCs.26
Dual channel fast cycle apparatus.
The FCA consists of 2 identical channels with 3 sections: a peristaltic pump, a deoxygenator, and an oxygenator. The cell suspension flows in a continuous, closed circuit.
Dual channel fast cycle apparatus.
The FCA consists of 2 identical channels with 3 sections: a peristaltic pump, a deoxygenator, and an oxygenator. The cell suspension flows in a continuous, closed circuit.
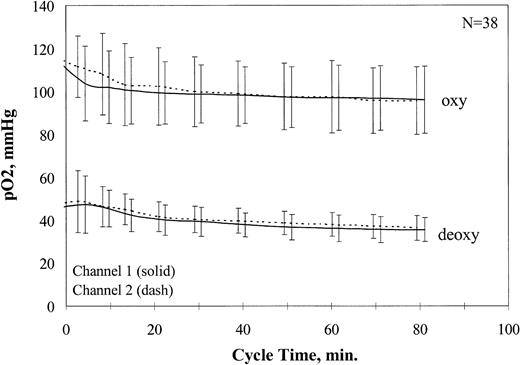
The signals from the oxygen sensors were amplified and recorded as a digital signal (Multiplexer 1090A and Chemical Microsensor 1201; Diamond General). Sensors were calibrated before and after cycling in buffer at 0%, 9%, and 21% O2 with the use of the same electrode chamber, flow rate, buffer system, and temperature used for cycling. Average pO2 values for all oxy/deoxy cycling experiments are shown in Figure2. After addition of the cells, approximately 20 minutes were required for stabilization of the oxy and deoxy pO2 at physiological values, which then remained stable for the duration of the experiment.
Oxygen partial pressure ranges during fast oxy/deoxy cycling.
Oxy and deoxy pO2 values were recorded for all fast oxy/deoxy cycling experiments. The average pO2 values are plotted ± 1 SD.
Oxygen partial pressure ranges during fast oxy/deoxy cycling.
Oxy and deoxy pO2 values were recorded for all fast oxy/deoxy cycling experiments. The average pO2 values are plotted ± 1 SD.
Sickle morphology
Approximately 10 minutes before the end of the cycling, a 200-μL sample of the cycling cell suspension was removed after deoxygenation, but before reoxygenation, and transferred anaerobically to deoxygenated PBS containing 3.7% formaldehyde. Similarly, a 200-μL sample was removed after oxygenation and transferred aerobically to fixative. Photomicrographs of wet preparations of each cell suspension were taken with the use of phase-contrast optics.
Lysis
At the conclusion of each experiment, the cycled and oxy incubated cell suspensions were centrifuged; the Hb content of the cell pellet and the supernatant were determined from the optical density at 415 nm; and the percentage of lysis for each condition was calculated.
Exclusion criteria
Experiments in which lysis in any sample was greater than 20% (indicating a possible flow obstruction), in which postexperiment osmolality values differed from the pre-experiment values by more than 5% (indicating a possible leak in the system), or in which the average deoxy pO2 was greater than 50 mm Hg (indicating inadequate sickling) were not included in the data set. These anomalies occurred in fewer than 15% of the experiments.
Stability of bumetanide in the FCA
To rule out absorption of bumetanide on the silicone tubing of the FCA, preliminary experiments in the absence of RBCs were performed in which the concentration of bumetanide was measured before and after 90 minutes of circulation in the FCA by fluorescence spectrophotometry (Perkin-Elmer model 650; Norwalk, CT) with 340 nm excitation and 440 nm emission. Bumetanide concentrations remained within 10% of initial concentrations in all samples (not shown).
Secondary density gradients
Oxy/deoxy cycled and oxy-incubated cells were washed once in PBS and density fractionated as described above. Density fractions were washed in PBS and resuspended in 1 mL PBS. The cell concentration in each fraction was determined by means of an electronic cell counter (CBC-5; Coulter, Hialeah, FL), and the percentage of the total SSRBCs in each fraction was calculated. In a series of experiments using the same conditions in each channel, there was no significant difference in low-density cell formation between channels (not shown).
Monovalent cation measurements
Phosphatidylserine (PS) externalization
Cells from each density fraction were washed once in PBS and once in buffer C. A 1% cell suspension of SSRBCs was incubated with annexin V–fluorescein isothiocyanate (FITC) (R&D Systems, Minneapolis, MN) for 15 minutes at room temperature. Annexin V–FITC was added according to the manufacturer's protocol with the use of 1 μg per 108 RBCs in 1 milliliter. Phosphatidylserine (PS) externalization was analyzed by flow cytometry to determine the percentage of PS+ cells in each density fraction.
Results
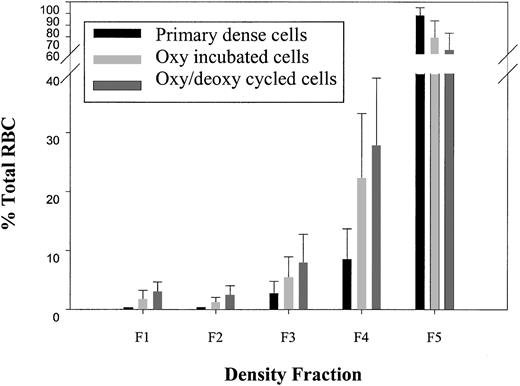
Dense cells (ρ > 1.107 g/cc) were isolated in a primary density gradient, subjected to either oxy/deoxy cycling or oxy incubation for 90 minutes, and analyzed on a secondary density gradient for light cell generation (ρ < 1.087 g/cc). Unless otherwise indicated, all statistical comparisons were paired t tests with concurrent controls. To determine the purity of the isolated dense cells from the primary gradient, in one series of experiments (n = 4), the densest, fraction 5 cells (F5, ρ > 1.107 g/cc) were immediately subjected to a second, identical gradient. Under these conditions, labeled “primary dense cells” in Figure3, there were very few light cells in the second gradient (F1 plus F2, ρ < 1.087 g/cc, 0.49% ± 0.1%). Interestingly, incubation of dense SSRBCs at 37°C for 90 minutes under oxy conditions with minimal agitation (labeled “oxy-incubated cells” in Figure 3) generated a significant number of light cells compared with the primary dense cells (2.9% ± 2.1% [n = 42] versus 0.49% ± 0.1% [n = 4]; P < .0001 by Student t test). Rapid oxy/deoxy cycling (labeled “oxy/deoxy cycled cells” in Figure 3) significantly increased light cell formation compared with the oxy-incubated cells (5.3% ± 2.4% versus 2.9% ± 2.1%; n = 42; P < .0001).
Light cell generation from dense cells.
Dense cells from fraction 5 (F5, ρ > 1.107 g/mL) of the primary gradient were isolated. A second, identical gradient was performed, and the percentage of total SSRBCs in each of the 5 density fractions was determined in buffer A for the following conditions: (1) immediately after the primary density gradient (n = 4); (2) after 90 minutes of 37°C oxy incubation (n = 42); and (3) after oxy/deoxy cycling (n = 42). Density ranges for each fraction were as follows: F1: ρ < 1.077; F2: 1.077 < ρ < 1.087; F3: 1.087 < ρ < 1.097; F4: 1.097 < ρ < 1.107; F5: ρ > 1.107.
Lysis was 11.97% ± 3.84% in the cycled samples and 3.64% ± 2.51% in the oxy incubations. At least part of the lysis during cycling can be attributed to the known shear sensitivity of dense sickle cells.27 Furthermore, the generation of light cells (and other data presented below) suggest volume-regulatory failure that could lead to osmotic lysis. The effect of lysis on the calculated percentage of generated light cells depends on which of these mechanisms is operative. If lysis was due to mechanical disruption of dense cells, then the percentage of generated light cells was slightly overestimated. For example, if for each 100 dense cells, 5 light cells were generated with no lysis, there would be 5.0% light cells. If 5 light cells were generated and 12 dense cells were lysed, we would calculate as follows: (5/88) × 100 = 5.7% light cells, which represents a small error. On the other hand, if lysis occurs osmotically in some of the swollen, newly formed low-density cells, then the percentage of light cells generated would be underestimated by up to 12%. There was no difference in lysis between samples that were circulated through the apparatus without deoxygenation and the concurrent samples with deoxygenation (14.3% ± 1.7% versus 13.9% ± 1.7%; n = 5). Likewise, there was no difference in lysis between samples with and without Ca++ (12.0% ± 5.1% versus 12.9% ± 3.7%; n = 7) or Ca++-containing samples with and without ChTX (12.2% ± 5.4% versus 12.5% ± 5.1%; n = 6). These data suggest that the majority of lysis was due to mechanical fragility.
Effects of circulation in the FCA
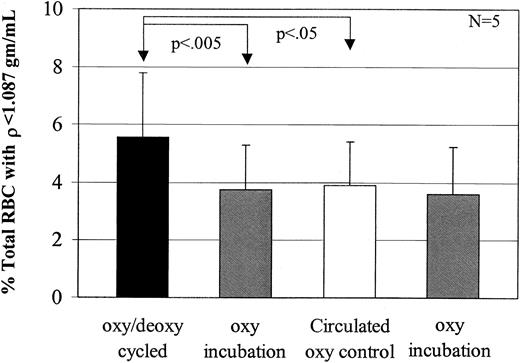
To assess if circulation per se (without oxy/deoxy cycling) produced light cells, 5 experiments were performed with one channel bypassing the deoxygenator. Although the cell suspension was not deoxygenated, it still experienced the same flow conditions (ie, valves, connectors, and tube diameters) as it normally would when flowing through the deoxygenator. Figure4 shows that samples circulated under oxy conditions produced the same number of light cells as oxy-incubated (noncirculated) controls. The 2 oxy-incubated samples in this Figure are duplicates.
Comparison of light cell formation during oxy/deoxy cycling versus oxy circulation.
Five experiments were performed in buffer A to determine the effect of oxygenated circulation (ie, without oxy/deoxy cycling) on low-density cell formation. Fast oxy/deoxy cycling produced a significant increase in light cell formation (ρ < 1.087 g/mL) compared with the light cell generation by oxygenated circulation and oxy incubation. There was no significant difference in light cell generation between the oxy circulated cells and the oxy incubated cells (P > .4).
Sickle morphology
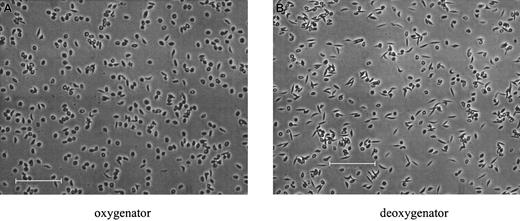
Oxy/deoxy cycling in the FCA resulted in reversible sickling. Morphology was examined in fixed SSRBCs, sampled from either the oxy or the deoxy port of the apparatus, and is shown for a typical experiment in Figure 5. In deoxy samples (Figure 5B), sickling was uniform, with essentially all the SSRBCs extending in 2 directions along the same axis.25 These cells, sickled under flow conditions, are morphologically similar to those in venous blood samples, but distinctly different from the “holly leaf” forms with more random polymer orientation observed with deoxygenation in nonflowing systems.11Partial oxygenation of cells in the FCA reversed the sickling process for the majority of cells.
Morphological sickling.
Photomicrographs of fixed SSRBCs after approximately 80 minutes of oxy/deoxy cycling. (A) Immediately after the oxygenator (pO2 = 106.8 mm Hg). (B) After the deoxygenator (pO2 = 40.0 mm Hg). The bars in panels A and B represent 100 microns.
Morphological sickling.
Photomicrographs of fixed SSRBCs after approximately 80 minutes of oxy/deoxy cycling. (A) Immediately after the oxygenator (pO2 = 106.8 mm Hg). (B) After the deoxygenator (pO2 = 40.0 mm Hg). The bars in panels A and B represent 100 microns.
Rehydrated SSRBCs are Na+-loaded and K+-depleted
Monovalent cation contents were measured in the isolated dense (ρ > 1.107 g/cc) SSRBCs before cycling and in the low-density (ρ < 1.087 g/cc) SSRBCs generated from these cells after rapid oxy/deoxy cycling. Average K+ and Na+ contents (± SD) in the dense SSRBCs were 169 ± 55 and 99 ± 22 mmol/kg Hb (n = 12), respectively, reflecting reduced total cation content, with slight K+ depletion and Na+ loading as previously reported.3 However, rehydrated cells were severely K+-depleted (20 ± 14 mmol/kg Hb) and Na+-loaded (394 ± 106 mmol/kg Hb), reflecting essentially complete decay of the transmembrane cation gradients in the generated low-density cells. This monovalent cation composition, with high Na+ and low K+, is similar to that seen in the valinomycin-resistant cells generated in vivo20 and distinguishes these abnormal cells from other well-hydrated cells with normal monovalent cation composition. Total cation content in excess of 400 mmol/kg Hb is consistent with cell swelling and low buoyant density.
In summary, dense SSRBCs converted in vitro to low-density, overhydrated cells that were Na+-loaded and severely K+-depleted. This process occurred under oxy conditions, but was augmented by rapid oxy/deoxy cycling. To examine the transport pathways mediating this process, the effects of calcium and transport inhibitors on rehydration were determined.
Calcium decreases low-density cell formation
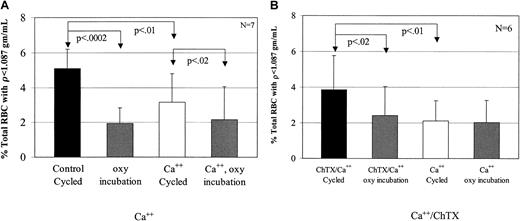
To test the effect of Ca++ on low-density cell generation, dense SSRBCs were subjected to oxy incubation or oxy/deoxy cycling in the presence (buffer B) or absence (buffer A) of 1.5 mM external Ca++. In cells incubated under oxy conditions, external Ca++ had no effect on light cell formation (Figure6A). However, Ca++significantly inhibited the generation of rehydrated, light SSRBCs from dense cells during oxy/deoxy cycling (Figure 6A). There are 2 potential explanations for the inhibitory effect of external calcium on light cell formation. The first is the previously described7 8 inhibition by Ca++ of Na+ influx via the sickling-induced pathway. The second is activation of KCa during oxy/deoxy cycling, producing K+ loss in some cells that counteracts rehydration.
Inhibition of low-density cell formation by calcium.
(A) To determine the effect of calcium on light cell formation, 7 experiments were performed. During oxy/deoxy cycling, calcium decreased low-density cell formation compared with the concurrent, calcium-free control by 38%. Calcium did not have an effect on the oxy-incubated cells (P > .65). (B) To determine the effect of Ca++ plus 1 μM charybdotoxin, a KCa inhibitor, 6 experiments were performed. During oxy/deoxy cycling, ChTX increased low-density cell formation by 46% compared with its concurrent Ca++ control, but had no effect on oxy incubation (P > .08).
To distinguish between these 2 possibilities, we cycled SSRBCs in the presence of 1.5 mM external Ca++ with or without 1 μM charybdotoxin, a KCa channel inhibitor. In preliminary experiments, inactivation of ChTX in the FCA was ruled out by showing equal inhibition of K+ efflux in the presence of Ca++ and ionophore A23187 before and after 90 minutes of circulation in the apparatus (not shown).8 11 The addition of charybdotoxin during oxy/deoxy cycling reversed the effects of Ca++ (Figure 6B). These data support the hypothesis that activation of the KCa channel prevents or delays erythrocyte rehydration, and argue against the possibility that the effect of Ca++ is due to inhibition of Na+influx via the sickling-induced pathway.
DIDS decreases low-density cell formation during oxy/deoxy cycling but not during oxy incubation
The higher level of light cell formation with oxy/deoxy cycling suggested that the sickling-induced pathway was contributing to rehydration. The effect of sickling-induced activation depends on the cation composition of the cell. In cells with high K+ and low Na+, the sickling-induced pathway, in the absence of KCa channel activation, mediates nearly balanced Na+ influx and K+ efflux.9However, in K+-depleted dense cells, activation of the sickling-induced pathway might produce Na+ influx in excess of K+ efflux, with resultant cell swelling. To evaluate this mechanism for dense SSRBC rehydration, we determined the effect of the sickling-induced pathway inhibitor DIDS12 on the generation of low-density cells. To maximize light cell formation and to eliminate the effect of calcium on cation transport mechanisms, these experiments were performed in the absence of calcium.
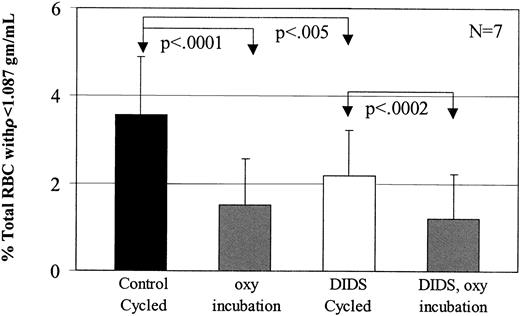
Dense SSRBCs from the primary gradient were incubated in buffer A with or without 45 μM DIDS, then washed and subjected to oxy/deoxy cycling or oxy incubation. This concentration of DIDS has been shown to irreversibly inhibit 85% of the sickling-induced flux.12Figure 7 shows that preincubation of the dense SSRBCs with DIDS significantly reduced the number of light cells generated during fast oxy/deoxy cycling. However, DIDS had no effect on light cell formation in cells incubated under oxy conditions (P > .12).
Inhibition of low-density cell formation by DIDS.
To determine the effect of 45 μM DIDS on low-density cell formation, 7 experiments were performed in buffer A. During oxy/deoxy cycling, DIDS decreased low-density cell formation by 39% compared with its concurrent control, but had no effect on oxy incubation (P > .20).
Bumetanide decreases low-density cell formation during both oxy incubation and oxy/deoxy cycling
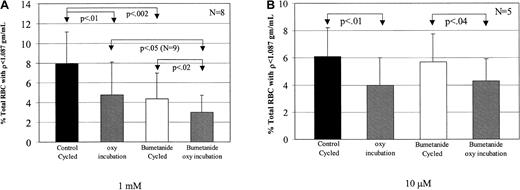
Bookchin and colleagues19 20 described a rapid K+ influx in Na+-loaded low-density SSRBCs that was inhibited by bumetanide. Therefore, we examined the effect of bumetanide on the formation of low-density cells from dense SSRBCs. Dense SSRBC were cycled or incubated under oxy conditions in buffer A after addition of either 1 mM or 10 μM bumetanide (Figure8). The lower concentration of bumetanide (10 μM), which inhibits the Na-K-2Cl cotransporter, had no effect on low-density cell formation (Figure 8B), making it unlikely that this transport pathway was involved in this process. However, 1 mM bumetanide significantly decreased light cell formation during both fast oxy/deoxy cycling and oxy incubation.
Inhibition of low-density cell formation by bumetanide.
Bumetanide was added from 100-fold stock solutions in DMSO to give final concentrations of 1 mM or 10 μM in buffer A. The same volume of DMSO was added to the control channel. Suspensions were preincubated with mixing for 20 minutes at 22°C before cycling. (A) It was found that 1 mM bumetanide decreased low-density cell formation compared with the concurrent control by 45% during fast oxy/deoxy cycling and by 37% during oxy incubation. (B) The presence of 10 μM bumetanide had no effect on low-density cell formation during oxy/deoxy cycling (P > .4).
The data presented above indicate that rehydration of dense SSRBCs includes both deoxy-independent and deoxy-dependent components. Since the deoxy-independent component is presumably active during at least the oxy phase of oxy/deoxy cycling, rehydration during cycling should include contributions from both components. If the deoxy-dependent component is the previously described sickling-induced pathway, then inhibitors of this pathway would be expected to decrease light cell formation during cycling but not during oxy incubation. The effect on light cell formation of the sickling-induced inhibitor DIDS is an example of this pattern. Bumetanide inhibits light cell generation from dense SSRBCs under oxy conditions, and by the reasoning outlined above, this may explain its inhibition of rehydration during cycling. However, this does not rule out an effect of 1 mM bumetanide on the deoxy-dependent component, and in fact, the greater magnitude of the decrease under these conditions implies such an effect. To explore this possibility, we measured net Na+ and K+ movements in unfractionated SSRBCs under continuous oxygenation or deoxygenation as described previously.12 The sickling-induced flux is the difference between the net flux in oxygenated and deoxygenated cells. For control cells, the sickling-induced fluxes for Na+ and K+ per hour were 30.4 ± 9.1 mmol/kg Hb (n= 3) and 33.4 ± 10.9 mmol/kg Hb, respectively. In the presence of 1 mM bumetanide, the sickling-induced fluxes of Na+ and K+ per hour were 18.9 ± 5.1 mmol/kg Hb and 20.5 ± 8.2 mmol/kg Hb, representing 37.7% inhibition for Na+ and 39.5% for K+. Lower concentrations of bumetanide had no effect on sickling-induced fluxes.
Thus, the formation of low-density SS RBCs from dehydrated cells during oxy/deoxy cycling was blocked by 45 μM DIDS and 1 mM bumetanide, both of which inhibit the sickling-induced pathway, supporting this pathway as the mediator of deoxy-dependent rehydration. Furthermore, 1 mM bumetanide inhibited the deoxy-independent pathway, providing evidence that it corresponds to the mediator of high cation flux in light sickle cells described by Bookchin et al.20
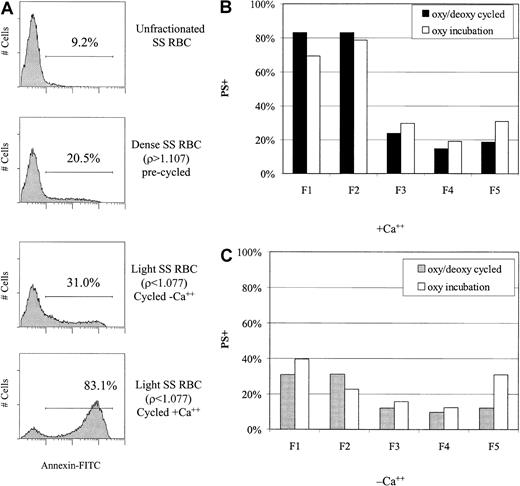
Phosphatidylserine (PS) externalization in rehydrated SSRBCs
An elevated percentage of sickle cells, including some light cells, exhibit loss of normal phospholipid asymmetry and externalization of PS. To determine whether in vitro rehydration was associated with PS externalization, we determined annexin V binding to light cells generated during oxy/deoxy cycling or oxy incubation. The flow cytometric histograms in Figure 9A demonstrate increased PS externalization in rehydrated (light) SSRBCs compared with unfractionated or dense SSRBCs. The presence of Ca++ during rehydration greatly increased PS exposure. An analysis of PS externalization in all fractions after either oxy incubation or oxy/deoxy cycling is shown in Figure 9B in the presence of Ca++ and in Figure 9C in the absence of Ca++. The dependence of PS externalization on Ca++ for the generated light cells (F1 and F2) is again apparent. Cycling appeared to have little or no effect on the percentage of PS+ light cells although the number of generated light cells, and therefore the absolute number of PS+ light cells, was greater with cycling.
Increased PS externalization of low-density cells in the presence of calcium.
(A) PS externalization (binding of annexin V–FITC) was measured by flow cytometry in unfractionated, dense, and rehydrated SSRBCs. (B) (C) PS externalization was determined in all density fractions after oxy/deoxy cycling or oxy (37°C) incubation in the presence (panel B) and absence (panel C) of calcium. Generated light cells (F1 and F2) had a higher percentage of PS+ cells than the original F5 cells. The presence of Ca++ greatly enhanced PS externalization in both the oxy incubated and cycled samples.
Discussion
Rehydration of dense sickle cells in vitro was investigated under conditions of continuous oxygenation and rapid oxy/deoxy cycling. These studies showed that (1) 37°C incubation of dense, dehydrated cells under oxy conditions generated low-density, rehydrated cells; (2) light cell formation was increased by oxy/deoxy cycling; (3) light cell formation during cycling was decreased in the presence of external Ca++, an effect reversed by charybdotoxin; (4) light cell formation during cycling was decreased by 45 μM DIDS or 1 mM bumetanide. However, only 1 mM bumetanide inhibited light cell formation during oxy incubation; (5) low-density cells derived from dense SSRBCs were sodium-loaded and potassium-depleted; and (6) the generated light cells had very high PS externalization, especially in the presence of Ca++.
The fast oxy/deoxy cycle apparatus used in these experiments has several advantages over previous oxy/deoxy systems. First, it simulates in vivo cycle times better than slower cycle systems. Second, it provides more uniform morphologic sickling, with essentially all the SSRBCs extended in 2 directions along the same axis.25Third, it avoids air-liquid interfaces, which may cause lysis or changes in osmolality during long incubation periods.
The dense SSRBCs that rehydrated under oxy conditions, with minimal mechanical stress, reflect the intrinsic volume instability of the dehydrated sickle cell population. Rehydration under these conditions was inhibited by 1 mM bumetanide, but not by DIDS. With oxy/deoxy cycling, rehydration was inhibited by both agents, suggesting that the rehydration pathways may differ in these conditions. Etzion et al19 described a subset of low-density sickle cells with Ca++-independent, ouabain-insensitive K(86Rb) influx that was at least 100-fold higher than normal and was inhibited by 1 mM bumetanide. If this pathway transports Na+ in addition to K+, it could mediate the oxy rehydration of dense sickle cells. The lack of effect of DIDS on rehydration during oxy incubations implied that the sickling-induced pathway was not involved. The nature and mechanism of activation of the high-capacity, 1 mM bumetanide–sensitive pathway in oxygenated sickle cells remains an important area of investigation.
Oxy/deoxy cycling of dense SSRBCs consistently generated more light cells than oxy incubation, implying that in addition to the pathway that operates under oxy conditions, there is also net Na+uptake mediated by a deoxy-dependent pathway. The observed inhibition of cycling-dependent rehydration by DIDS is consistent with sickling-induced Na+ influx as the deoxy-dependent mechanism. In severely K+-depleted dense SSRBCs, in which the outwardly directed K+ gradient is markedly reduced, activation of the sickling-induced pathway would result in Na+ influx in excess of K+ efflux. Even if Ca++ permeabilization led to activation of the KCa channel, the absence of a significant K+gradient would preclude further dehydration. On the other hand, in less severely K+-depleted dense cells, with a residual K+ gradient, KCa activation would produce enough dehydration to offset the rehydration caused by increased Na+ permeability. This interpretation is consistent with the data on the action of external Ca++ and charybdotoxin on the rehydration process.
These findings imply a degree of heterogeneity within the dense cell population. Although all dense SSRBCs must have similar total cation content (eg, about 200 mEq/kg Hb), some may have 60 Na+ and 140 K+, whereas other cells contain 140 Na+ and 60 K+. The responses of 2 such dense cell populations to membrane permeabilization would differ markedly. Thus, with repetitive K+ permeabilization and the resultant depletion of the K+ gradient, the cell may become less capable of compensating for increased Na+ influx with K+efflux. Eventually, uncompensated Na+ influx, whatever the mechanism, will lead to Na+ loading and cell swelling.
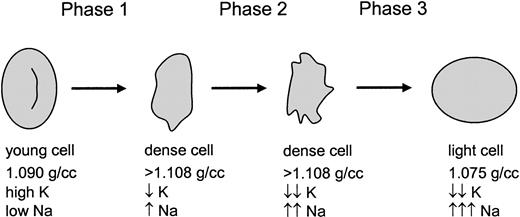
Previous studies of the volume-regulatory pathology of SSRBCs have focused on K+ loss and dehydration. However, the data presented here suggest a 3-phase process as shown in Figure10. The first phase represents the traditional view of SSRBC dehydration mediated by K+ loss via both KCC and KCa, with the latter activated by sickling-induced Ca++ influx. This phase results in dehydrated cells with partial K+ depletion and mild Na+ loading, typical of the majority of cells in the dense fraction. The second phase is essentially an exchange of K+and Na+, with loss of K+ via continued activation of KCa balanced by Na+ uptake, with little change in total cation content and cell density. The 1 mM bumetanide–sensitive pathway may contribute during this exchange phase. As K+ depletion becomes more profound, the transmembrane K+ gradient becomes too small to offset Na+ entry even with KCa activation, and the cells enter the third phase. During this phase, the 1 mM bumetanide–sensitive pathway (which does not require deoxygenation) is most likely the dominant mechanism for Na+ entry, although continued permeabilization of the membrane via the sickling-induced pathway may also contribute. With no mechanism for K+ loss, the permeabilized SSRBCs swell, ultimately resulting in Na+-loaded low-density cells. Although no direct Ca++ measurements were made, these cells also appear to be abnormally permeable to Ca++, since exposure to Ca++ produced high levels of PS externalization, similar to the effect of exposing ionophore-treated cells to Ca++.
A 3-phase model for sickle cell hydration changes.
Young sickle cells are initially dehydrated in phase 1 by the combined action of 3 well-described pathways. During phase 2, which is deoxygenation-dependent, K+ is further depleted and Na+ is increased. Finally, a combination of severe K+ depletion (and therefore little or no outwardly directed K+ gradient) and activation of a novel 1 mM bumetanide–sensitive pathway (allowing rapid Na+ entry) results in rehydration of the cells.
Na+ loading does not appear to be a consequence of Na+ pump inhibition since high pump activity was found in light, Na+-loaded sickle cells20 formed in vivo. Thus, it is more likely that these cells exhibit a pathologic state of high Na+ and K+ permeability, which represents volume-regulatory failure and a terminal phase in the volume-regulatory pathology induced by HbS.
It appears that the heterogeneity of sickle cell density populations is even greater than previously thought. In addition to young reticulocytes, low-density populations in vivo contain cells that are not reticulocytes, most likely derive from high-density cells, have high Na+ and low K+, and externalize PS. Some of the pathological characteristics of low-density cells—membrane oxidation1 and PS externalization28—parallel the defects noted in the dense cell population and may indeed reflect the presence of older, rehydrated, formerly dense SSRBCs. Another more speculative possibility, considering their extraordinary PS externalization in the presence of Ca++, is that these rehydrated cells contribute to the endothelial adhesion that has been described by Kaul et al29 for low-density sickle cells.
Depending on the rate of the rehydration process in vivo, some cells in intermediate-density fractions may be K+-depleted and partially Na+-loaded, and in the process of moving “up” the density gradient. Thus, rather than a unidirectional path toward dehydration and increased density that leads to removal from the circulation, at least some sickle cells appear to follow a course of dehydration followed by pathological rehydration, perhaps leading to intravascular osmotic lysis. Bookchin et al20 estimated that valinomycin-resistant cells compose, on average, about 4% of SSRBCs. While this appears to be a small number, these cells could represent a major terminal state if they have a short survival once they are formed. For example, sickle cells typically have a survival of 15 to 25 days. Therefore, 4% to 7% of the cells are removed each day. If the valinomycin-resistant cells, once formed, had a survival of less than 1 day, they could account for all or most of the SSRBC turnover. An understanding of this process is crucial to the development and application of treatment strategies for sickle cell disease based on drugs that inhibit cation transport.
The authors appreciate the assistance of Dr Rick Paul (fluorescence spectrophotometry) and Dr Nancy Kleene (photomicroscopy), both from the College of Medicine at the University of Cincinnati.
Prepublished online as Blood First Edition Paper, June 21, 2002; DOI 10.1182/blood-2002-02-0631.
Supported by the National Institutes of Health grants R01 HL51174 (R.S.F.), R01 HL57614 (C.H.J.), and P60 HL58421 (C.H.J., R.S.F.).
The publication costs of this article were defrayed in part by page charge payment. Therefore, and solely to indicate this fact, this article is hereby marked “advertisement” in accordance with 18 U.S.C. section 1734.
References
Author notes
Robert S. Franco, University of Cincinnati, 3125 Eden Ave, Rm 1303, Cincinnati, OH 45267-0508; e-mail:robert.franco@uc.edu.

This feature is available to Subscribers Only
Sign In or Create an Account Close Modal