Most current theories assume that self-renewal and differentiation of hematolymphoid stem cells (HSCs) is randomly regulated by intrinsic and environmental influences. A direct corollary of these tenets is that self-renewal will continuously generate functionally heterogeneous daughter HSCs. Decisions about self-renewal versus commitment are made by individual, single HSCs and, thus, require examination on the clonal level. We followed the behavior of individual, clonally derived HSCs through long-term, serial repopulation experiments. These studies showed that daughter HSCs derived from individual clones were remarkably similar to each other in the extent and kinetics of repopulation. Moreover, daughter HSCs within a clone showed equivalent contributions to the myeloid or lymphoid lineages. Lineage contribution could be followed because of the discovery of a new subset of HSCs that gave rise stably to skewed ratios of myeloid and lymphoid cells. Overall, the data argue that self-renewal does not contribute to the heterogeneity of the adult HSC compartment. Rather, all HSCs in a clone follow a predetermined fate, consistent with the generation-age hypothesis. By extension, this suggests that the self-renewal and differentiation behavior of HSCs in adult bone marrow is more predetermined than previously thought.
Introduction
Hematopoietic stem cells (HSCs) replenish all lineages of mature blood cells through a cascade of differentiation steps. Differentiation is associated with a loss of self-renewal capacity, requiring HSCs as a population to self-renew to maintain the HSC pool. Thus, the ability to commit and to self-renew are defining properties of HSCs. How the balance of self-renewal and commitment to differentiation is regulated is incompletely understood.
Most of our knowledge of HSCs derives from population-based studies. However, commitment and self-renewal decisions are made by single HSCs and thus require examination on the clonal level. Clonal approaches, such as injecting limited numbers of purified or retrovirally marked HSCs, revealed extensive heterogeneity in the HSC compartment.1-11 HSC heterogeneity can be visualized by the kinetics of repopulation in transplantation assays: primitive HSCs need several proliferation and differentiation steps until they give rise to mature progeny. This causes a delay in the appearance of mature progeny in the periphery. However, the large clone size generated through the multiple steps leads to long-term, sustained repopulation. In contrast, less primitive HSCs require fewer steps, generating small clones. These less primitive HSCs contribute early to peripheral hematopoiesis, but their contribution declines over time. Primitive and less primitive HSCs can be separated to some extent,12 13demonstrating that these different functions are derived from distinct subsets of HSCs. When hosts receive mixtures of several types of HSCs, the kinetics of repopulation will be a combination of the behaviors of the individual HSCs. This leads to kinetics of repopulation that change little over time.
Although the functional diversity of the HSC compartment has been demonstrated unequivocally, it is less clear how such diversity is generated. The prevailing view is that HSC heterogeneity is regulated by extrinsic and intrinsic events.14,15 Extrinsic (environmental) signals are derived predominantly from stromal cells and their products. Stromal cells are organized into niches that differ in their ability to maintain HSCs.16,17 Thus, homing of HSCs to different types of stromal cell niches should contribute to HSC heterogeneity. In addition to extrinsic signals, intrinsic mechanisms control HSC decisions. Intrinsic mechanisms could induce HSC heterogeneity if HSCs make random decisions at the time of each HSC division. For example, each HSC has a choice of many fates, including self-renewal, differentiation apoptosis, and migration. Evidence for random processes, termed stochastic, comes from the analysis of the differentiation of precursors of the myeloid and lymphoid lineages.18,19 For example, multipotent myeloid precursors generate more restricted precursors in an apparently random fashion.18
There is also increasing evidence that intrinsic mechanisms can be nonrandom but can preprogram the behavior of HSCs. For example, the size of the HSC compartment and the aging of HSCs are regulated by mechanisms that are HSC intrinsic and encoded in the germ line.20-23 Such genetic mechanisms predetermine the behavior of HSCs and thus should limit the generation of HSC heterogeneity.
The hypothesis that HSCs are regulated by random intrinsic or environmental mechanisms makes a testable prediction, namely that the generation of HSC heterogeneity is a continual process, and self-renewal should result in daughter HSCs that are functionally different. In contrast, the idea of predetermined HSC behavior predicts that daughter HSCs derived from a clone will be similar to each other. As outlined above, functional diversity is resolvable through the behavior of clonal HSCs in repopulation experiments.
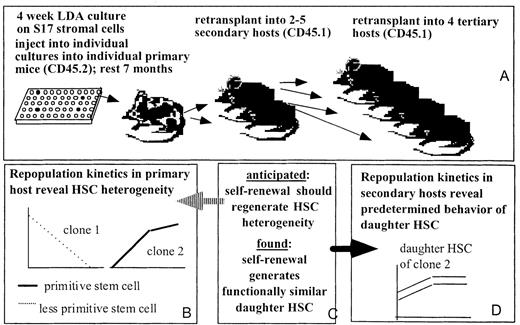
To test this prediction, an efficient method to examine HSC behavior on the clonal level was needed. We took advantage of a simple method to isolate clonally derived HSCs.24 In this system, HSCs, cultured on the supportive stromal cell line S17, give rise to colonies of small granulocytic cells. Statistical considerations, verified experimentally, indicated that 90% of the colonies were derived from a single initiating HSC. Approximately half of the cultures contained repopulating HSCs,24 making this a highly efficient method for enriching repopulating HSCs. We used this system to isolate HSC clones from bone marrow (BM) and have analyzed the self-renewal and differentiation of individual HSC clones in long-term transplantation experiments. The experimental design and the hypothesis tested are outlined in Figure 1. Unexpectedly, self-renewal of the clonal HSCs generated daughter HSCs that behaved similarly to each other in terms of repopulation kinetics and lineage contribution. This suggests that HSC behaviors in adult BM are more predetermined than previously thought. Our data are consistent with the generation-age hypothesis, an inherently deterministic view of HSC function.
Outline of the approach.
(A) Experimental approach. (B) Findings in primary hosts. (C) Hypothesis tested, as described in “Introduction.” (D) Results of serial transplantation of HSC clones.
Outline of the approach.
(A) Experimental approach. (B) Findings in primary hosts. (C) Hypothesis tested, as described in “Introduction.” (D) Results of serial transplantation of HSC clones.
Materials and methods
Clonal HSC cultures
Bone marrow cells (BMC) from 4- to 12-week-old C57BL/6-Ly5.1 (B6-Ly5.1) mice were seeded onto preformed layers of the stromal line S1725 in limiting-dilution conditions exactly as described.24 Conditions were chosen so that less than 20% of the wells contained a colony of small granulocytic cells after 4 weeks of culture. This leads to a conditional probability of 90% that each positive well is initiated by a single cell.
Repopulation assays
Individual positive wells were harvested by vigorous pipetting and injected intravenously into sublethally irradiated (single dose, 500 cGy) W41W41 hosts (Ly5.2) as described.24 As a control, some W41W41 mice received 1 × 10⁵freshly explanted BMC. To control for the culture of the HSCs, 10 × 105 BMC were cultured as a population (called bulk) for 3 weeks on stromal cell line S17 as described.16,26 The equivalent of 2 × 10⁵cells were then injected into lethally irradiated B6 mice to ensure that the repopulation patterns could be compared with previously published data.16
All mice were bled in regular intervals, and white blood cells were prepared as described.16,24,26 Immunofluorescence was used to measure the percentage of donor-type cells (Ly5.1+) in the lymphocyte (B220, Thy-1) and myeloid (Gr-1, Mac-1) lineages as described.16,24,26 Each data point is the mean of 3 measurements of the percentage of Ly5.1+ cells in a blood sample. For secondary transfers, 5 × 10⁶ BMC from the primary hosts were injected into lethally irradiated (1062 cGy in 2 doses) B6 mice or B6 mice in which the CD45 locus was ablated.27 The B6-CD45−/− hosts allowed us to assess the contribution of the W41W41 host to secondary repopulation. After demonstrating that the W41W41 cells contributed only minimally to secondary repopulation,24 all further experiments were performed with B6 mice as hosts. All animal experiments were approved by the Institutional Animal Care and Use Committee (IACUC).
Symbolic analysis
Symbolic analysis quantifies qualitative aspects of dynamic time series and was used here for a numerical comparison of the kinetics of the repopulation curves of daughter HSCs derived from clonal or multiclonal grafts. First, the slopes for each segment of each curve were calculated. Next, we assigned the plus sign (+) for a segment whose slope was positive and >δ, the minus sign (−) for a segment whose slope was found negative and <−δ, and the approximate sign (∼) for a segment with an absolute slope ‖s‖ ≤ δ. Here, δ denotes a cutoff parameter (expressed as percentage). The size of δ was set to equal the larger of the 2 standard deviations of each of the 2 data points that defined a segment of a curve. The result is that each repopulation curve is described as a string over the symbols A = {+,−,∼}. Given stringsS1 = {α1,…,αn}andS2 = {β1,…,βn}of length n over this alphabet, we defined their matrix of pairings as M = ((αi, βj))1≤i,j≤n. Using the mapping
we transform M into a Boolean matrix and obtain theHamming distance28 by
with tr X being the trace, or the sum of the diagonal elements, of any matrix X. To quantify differences in kinetics, we used the normalized Hamming distance, which is given by
Important properties of the normalized Hamming distance are that 0 ≤ Ham1(S1,S2) ≤ 1 andHam1(S1,S2) = 0 ⇔ S1 = S2. These properties allow canonical clustering of the elements of any given set of strings according to their similarity or dissimilarity. Suppose thatS1 = {+,−,∼,∼,*},S2 = {+,−,+,∼,∼}. Then
Hence,Ham(S1,S2) = 2, and thusHam1(S1,S2) = 0.4. The latter can be interpreted by saying the degree of dissimilarity between S1 and S2 is 40%.
Statistical analysis
Mann-Whitney U nonparametric analysis was performed with Instat (GraphPad Software, San Diego, CA).
Results
Serial transfers show concerted repopulation behavior of HSC clones
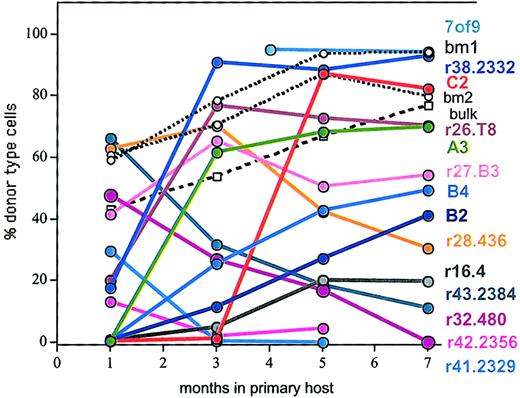
A hallmark of clonal HSC analysis is the ability to resolve the functional heterogeneity of the HSC compartment. Clonal HSCs, isolated from limiting-dilution cultures, were injected individually into ablated mice. The contribution of each clone to peripheral hematopoiesis was followed by staining white blood cells for the donor-type allele of the CD45/Ly5 antigen. The data in Figure2 demonstrate extensive heterogeneity among the clonally derived HSCs with respect to the onset, duration, and extent of repopulation.
Clonal analysis confirms the heterogeneity of the HSC compartment.
Cells (Ly5.1) from individual positive wells (closed symbols) from the limiting-dilution cultures were injected into W41W41 hosts (Ly5.2). Donor-type cells in blood were assessed at the indicated time points after injection. Two representative W41W41 hosts that received 105 freshly explanted BMCs (open circles, dotted lines; designated BM1 and BM2) are also shown. Cells cultured on the stromal cell line S17 in bulk culture and then injected into lethally irradiated B6 mice are indicated by open squares. Names for HSC clones are indicated at the right. Data for clones C2, B2, B4, A3, and r16.4 have been published,24 and these clones are included here to provide a baseline for the data in Figures 3 to8.
The heterogeneity of HSC behaviors seen in the primary hosts is consistent with the view that random and environmental signals constantly generated functionally diverse HSCs. If this was a general principle, then the daughter HSCs derived from each of the HSC clones should exhibit additional heterogeneous repopulation behavior, and HSCs of different primitiveness would be expected in the progeny of a single HSC clone. To test this, we performed serial BM transplantation. Overall, 13 individual HSC clones were tested in secondary transplants (Table 1).
HSC clones analyzed in secondary transfers
| Clone . | Donor-type cells in 1st hosts, % . | No. secondary hosts injected . | Repopulation of secondary hosts* . |
|---|---|---|---|
| r16.B2 | 0.8 | 3 | No |
| r27.2984 | 3.8 | 4 | No |
| r19.A1 | 8.7 | 1 | No |
| r26.426 | 30.6 | 5 | No |
| r27.B3 | 54.1 | 5 | No |
| r16.4 | 19.8 | 3 | Yes |
| B2 | 41 | 2 | Yes |
| B4 | 49.2 | 2 | Yes |
| r16.3 | 62.4 | 1 | Yes |
| A3 | 70 | 2 | Yes |
| C2 | 82.3 | 2 | Yes |
| r38.2 | 92.7 | 4 | Yes |
| 7of9 | 94 | 4 | Yes |
Mice that showed at least 5% donor-type levels in blood at least 2 time points were considered repopulated.
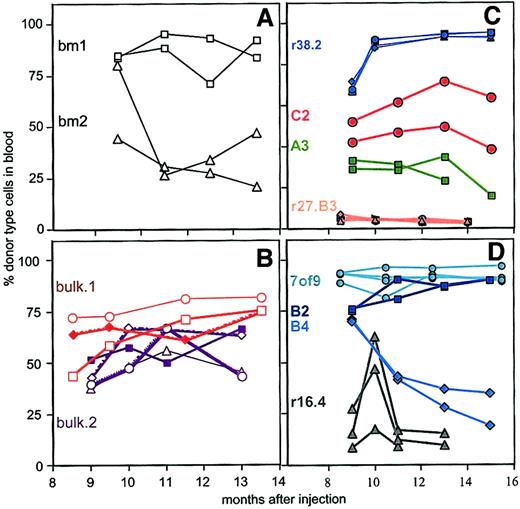
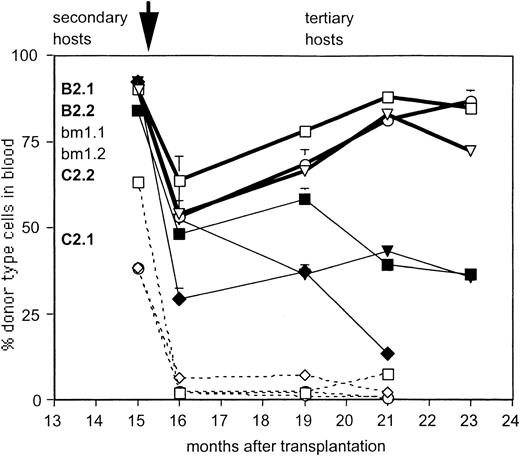
Of the 13 clones tested, 8 clones generated daughter HSCs in the primary host that repopulated secondary host(s). Of these 8 clones, daughter HSCs from 7 clones were injected into at least 2 secondary hosts, and these 7 clones are depicted in Figure3. For comparison, we also show clone r27.B3, a clone that failed to generate daughter HSCs in the primary host. Clonal heterogeneity in the repopulation patterns seen in the primary hosts (Figure 2) was evident also in the secondary hosts (Figure 3). For example, clone B2 showed high levels, though clone B4 had only moderate levels, of secondary repopulation (Figure 3D). In contrast to this inter-clonal heterogeneity, daughter HSCs derived from any given clone behaved remarkably similarly to each other. For example, the daughter HSCs derived from clone B2 showed repopulation kinetics so similar to each other that 3 of 4 of the data points from the pairs of secondary hosts overlap (Figure 3D). Similarly, the kinetics of repopulation in the 4 secondary recipients of clone r38.2 daughter HSCs were almost indistinguishable (Figure 3C). Other clones, such as C2 or r16.4 (Figure 3C,D), varied in the extent of repopulation. However, even for these clones the kinetics with which donor-type cells were generated were similar. For example, HSCs derived from clone r16.3 were injected into 3 secondary recipients. Donor-type contribution in all 3 hosts first increased, then sharply decreased, at the same time. HSCs derived originally from clones B2 and C2 were tested in tertiary transfers, and the similarity in repopulation patterns became even more pronounced in these recipients (Figure4). All recipients of daughter HSCs, derived from clone B2, showed high levels of donor-type cells, and the kinetics of repopulation was similar in the 3 mice we followed for 7 months. HSCs from clone C2 failed to repopulate any of the 4 tertiary recipients (Figure 4), indicating that all HSCs in clone C2 had ceased to self-renew in both secondary hosts.
Similar secondary repopulation kinetics of clonally derived HSCs.
Each clone is indicated by the same color and number-letter combination as in Figure 1. Seven to 8 months after injection, BMCs from the indicated primary recipients were injected into 2 to 4 secondary hosts. Shown are the percentages of donor-type cells at each time point. (A) Control mice BM1 and BM2 received HSCs from primary hosts that originally were transplanted with multiclonal HSC grafts from freshly explanted BM. (B) Control mice bulk-1 and bulk-2 received HSCs from 2 primary hosts that originally were injected with populations of BMCs cultured on line S17. Each bulk primary host was derived from an independent experiment. (C,D) Daughter HSCs obtained from clonally engrafted primary hosts.
Concerted repopulation kinetics of granddaughter HSCs originally derived from clonal HSCs in tertiary recipients.
Secondary recipients of HSCs originally derived from clones C2 (dashed lines, open symbols) and B2 (solid lines, open symbols) and the control mouse BM1 (closed symbols) were killed 8 months after injection (total time in repopulation assay, 15 months). The 7-month repopulation data in the secondary hosts are indicated for comparison (as the first point of the lines). BMCs from each secondary host were injected into 2 new lethally irradiated B6 mice each (arrow), generating 4 tertiary hosts. Three mice each injected with HSCs from clone B2 and from the control BM2 were followed over 7 months (one mouse from each group was killed at 3 months). Data shown are percentages of donor-type cells (Ly5.1) in blood.
As a control for the primary repopulation experiments, we had originally injected some W41W41 hosts with 105 freshly explanted BMCs (Figure 2). This dose of BM contains on average 5 HSCs defined as W41W41repopulating units.29 BMCs from these control mice were transplanted into secondary hosts in parallel to the clonally repopulated mice. Multiclonal HSC grafts showed comparable levels of repopulation in the secondary hosts. However, HSCs derived from the control mice varied noticeably more in their kinetics of repopulation than the clonally derived HSCs (Figure 3A). For example, in one secondary host, HSCs derived from the BM2 mouse showed steadily declining levels of donor-type cells. However, the other host showed an initial decrease, followed by an increase of donor-type cells. HSCs from the BM1 mouse appeared more similar in the secondary hosts. However, in the tertiary hosts, variation in the repopulation kinetics became pronounced (Figure 4). We also tested HSCs that had been cultured as mixed populations (bulk) on the stromal cell line S17 as described.16,26 Primary recipients were injected with cultured cells (equivalent of 2 × 10⁵ cells originally seeded). As reported previously, HSCs cultured on the stromal cell line S17 are qualitatively and quantitatively similar to freshly explanted BM HSCs.16 26 After 8 months, BMCs from 2 of these primary mice (derived from independent experiments and designated bulk1 and bulk2) were injected into 3 and 4 secondary recipients, respectively. The repopulation kinetics of HSCs derived from the bulk grafts were diverse (Figure 3B), indicating that the concerted repopulation behaviors of the clonal HSCs were not caused by culture on line S17. Rather, the data argue that the distinct kinetics of the control HSCs reflect the original heterogeneity of the multiclonal graft. Overall, the data show that clonally, but not multiclonally, derived daughter HSCs give rise to daughter HSCs with strikingly similar repopulation behaviors.
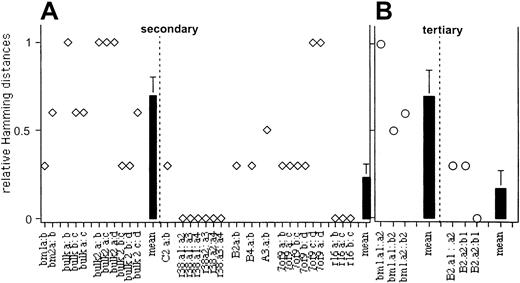
Although the similarities in the repopulation curves for daughter HSCs from some clones (eg, r38.2, C2) are intuitively obvious, the patterns of other curves are less conspicuous. To quantify the similarities and differences in the repopulation kinetics of daughter HSCs from each clone, we performed symbolic analysis. Secondary repopulation data were transformed into symbol strings according to the slope of each segment of each of the curves. Next, we determined similarity and dissimilarity between pairs of symbolized kinetics using normalized Hamming distances.28 This determines the number of distinct symbol pairs between 2 strings and, when divided by the length of the strings, will yield a probability measure of how different 2 strings are. A normalized Hamming distance of 0 means that 2 strings are completely similar, whereas a Hamming distance of 1 means complete dissimilarity. When more than 2 secondary hosts were analyzed per clone, pairs of each permutation were compared (Figure 5). Symbolic analysis of the secondary recipients shows (Figure 5A) that the kinetics of daughter HSCs derived from multiclonal grafts differ in shape, with a mean relative Hamming distance of 0.7. Parenthetically, a Hamming distance of 0.66 is found when randomly simulated data are examined (H.B.S., manuscript in preparation), indicating that the kinetics of repopulation by HSCs derived from multiclonal grafts are not related.
Symbolic analysis of the kinetics of clonal and multiclonal repopulation kinetics.
Secondary (A) and tertiary (B) transplants. Data depicted in Figures 3and 4 were analyzed as detailed in “Materials and methods.” Open symbols represent the Hamming distances for all comparisons of all repopulation curves derived from daughter HSCs with a clone or for daughter HSCs derived from multiclonal grafts. Mean Hamming distances (± SE) for clonal and multiclonal grafts are indicated as bars. These were 0.7 ± 0.08 for multiclonal, 0.2 ± 0.07 for clonal secondary grafts, and 0.7 ± 0.15 for multiclonal, 0.2 ± 0.17 for clonal tertiary grafts, respectively.
One secondary host of daughter HSCs derived from the clone 7of9 also showed divergent kinetics of repopulation when compared with the other 3 recipients in that group. However, the other curves in the 7of9 group showed low Hamming scores, indicating that their shapes were similar by the criteria used. Low Hamming distances were also derived from the comparison of daughter HSCs derived from all other clones tested (Figure 5). The Hamming distances derived from clonal and multiclonal daughter HSCs, respectively, were statistically highly significant (P = .001). In the tertiary recipients, the kinetics of daughter HSCs from clone B2 generated Hamming distances of 0.33 and 0.0, respectively. A mean Hamming distance of 0.7 was found when the kinetics of daughter HSCs from the multiclonal BM1 graft were compared. The comparison is not quite statistically significant (P = .052), probably because of the low number of points in this analysis. Overall, symbolic analysis confirms the interpretation that the kinetics of repopulation of clonal daughter HSCs are more similar to each other than are daughter HSCs from multiclonal grafts.
Clonal analysis reveals lineage-dominant HSCs
All clones examined here gave rise to myeloid and lymphoid cells. Clonal analysis revealed an additional unique feature—a subpopulation of HSCs that gave rise to unusual ratios of myeloid and lymphoid cells.
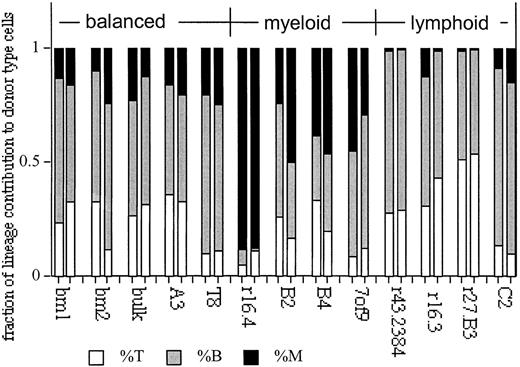
To define the typical or balanced ratios of myeloid to lymphoid cells, data from 50 unmanipulated B6 mice were analyzed. A mean value of 14.1% ± 3.9% myeloid cells in blood was obtained. B and T lymphocytes make up the remaining portion of white blood cells. The mean ratio of lymphoid-to-myeloid cells in these mice is 6.0 ± 2.0 (95% confidence level, 0.57). This pattern of lymphoid-to-myeloid cells we call balanced. A comparable ratio of myeloid-to-lymphoid cells is obtained in stably repopulated mice that received multiclonal BM grafts (Figure 6). HSC clones that contributed to balanced ratios of myeloid and lymphoid cells were found. Clones A3 and r38.2 (Figure 6) are examples of such balanced lineage repopulation. However, a subset of the clones differed in their contribution to the myeloid and lymphoid lineages. For example, clones r16.4, B2, B4, and 7of9 generated low ratios (≤3) of lymphoid-to-myeloid cells, and the donor-type cells in blood appear as myeloid dominant. In contrast, clones r43.2, r16.3, r27.B3, and C2 gave rise to high ratios (≥10) of lymphoid-to-myeloid cells, appearing as lymphoid dominant (Figure 6).
Balanced, myeloid-, and lymphoid-dominant HSCs are revealed in clonal transplantation analysis.
Shown are the fractions of T (Thy-1+) and B (B220+) lymphocytes and myeloid cells (M: GR-1+, Mac-1+) to the donor-type repopulation in blood for each mouse at 5 and 7 months in the primary host. Donor-type cell levels were normalized to 100% to facilitate comparison of the lineage repopulation patterns. Values of donor-type cells at each time point can be seen (Figure 1). Data for BM1, BM2, A3, r16, C2, B2, and B4 are modified from Cho et al24. Clone numbers and BM controls (BM or bulk) are indicated at the bottom of the figure.
Among 38 repopulating HSC clones in primary recipients, we found 4 myeloid-dominant HSCs in 3 independent experiments. These clones had self-renewal capacity, as judged by their ability to generate daughter HSCs that repopulated secondary hosts (Figure 3). At first glance, the incidence of lymphoid-dominant HSCs appears to be higher at almost 60% of the clones in primary recipients. However, the enumeration of lymphoid-dominant HSCs is equivocal because long-lived lymphocytes can dominate the periphery when an HSC ceases to contribute to repopulation. Indeed, most of the primary HSC clones with low levels of donor-type repopulation appear as lymphoid dominant, and 3 of 3 such clones failed to repopulate secondary hosts, indicting stem cell failure (Table 1 and data not shown). We also tested 3 lymphoid-dominant clones with high levels of donor-type levels (more than 40%). Of these, one clone (r27.B3) failed to repopulate secondary recipients (Figure 3). However, 2 clones (C2 and r16.3) repopulated secondary recipients and retained lymphoid dominance (Figures 3,7). This suggests that lymphoid-dominant HSC clones are also infrequent.
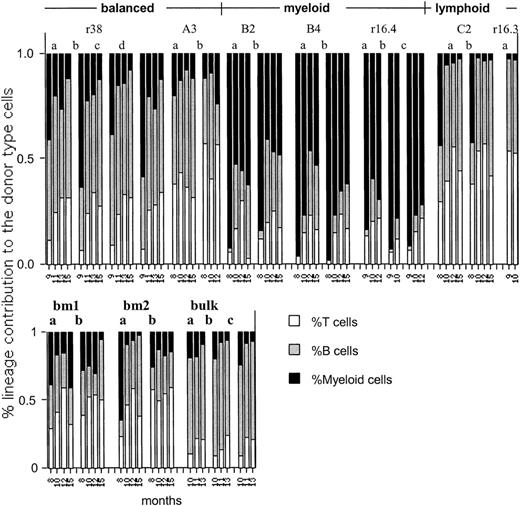
Lineage dominance is stable or enhanced in secondary transfers.
The fraction of donor-type T, B, and myeloid cells to the donor-type repopulation (set as 100%) are depicted for each mouse at each time point tested. Numbers at the bottom of the figure indicate the cumulative months in transplantation (see Figure 2). The clone number or control (BM or bulk) as defined in the primary hosts (Figure 1) is indicated at the top. Secondary hosts are designated as a, b, or c. A single secondary mouse was injected with cells derived from clone r16.3.
Lineage dominance is stable, HSC-intrinsic behavior
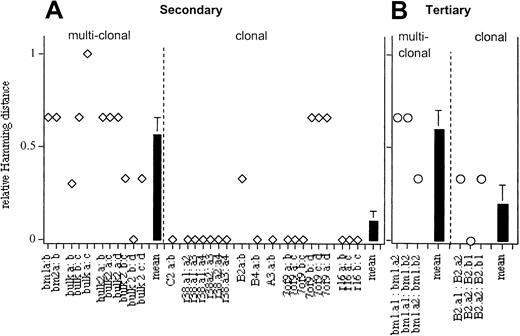
In HSC clones that self-renewed, lineage dominance persisted through serial transfers (Figures 6-8). For example, clones C2 and r16.3 were lymphoid dominant in the primary and the secondary hosts. Similarly, clones B2, B4, and r16.4 gave rise to myeloid-dominant progeny in the primary, secondary, and tertiary hosts (Figures 6-8). Unfortunately, lineage data for the secondary transplant of clone 7of9 were made uninterpretable by an ear mite infection (or its treatment) that caused myelopenia. Overall, the data indicate that lineage dominance is a stable property of HSCs. Similar to balanced HSCs, lineage-dominant HSC clones generated daughter HSCs with concerted repopulation kinetics (Figure 3). The rate of appearance of myeloid and lymphoid cells in blood following transplantation appears to be more similar for the daughter HSCs within each clone in secondary, and particularly in tertiary, recipients than for the multiclonal grafts (Figures 7, 8). In contrast, the secondary and tertiary recipients of multiclonally repopulated control mice showed diverse repopulation kinetics and diverse lineage contributions. For example, in tertiary mice that received HSCs from the BM1 control mouse, one secondary host appeared as balanced and the other 2 as myeloid dominant (Figure 8). To quantify this observation, we performed symbolic analysis of the kinetics with which myeloid cells were generated (Figure 9). The Hamming distances of clonal and multiclonal grafts were statistically significantly different, with P = .0276 in secondary hosts. In tertiary animals the differences in the Hamming distance approaches (but does not attain) significance withP = .0581. This is probably because of the low number of points examined here. Overall, the data support the conclusion that clonally derived daughter HSCs behaved more alike in repopulation kinetics and lineage contribution than HSCs derived from multiclonal grafts.
Tertiary transplantation demonstrates stable lineage dominance in clone B 2 and reveals lineage-dominant HSCs in the control mice.
The fraction of donor-type T, B, and myeloid (M) cells in tertiary recipients is indicated. Numbers at the bottom of the figure indicate time after injection. For details see Figure 6.
Symbolic analysis of the kinetics with which myeloid cells were generated in secondary recipients.
Data from Figures 7 and 8 were analyzed for each pair of repopulation curves. The Hamming distance for each pair of curves is indicated. Black bars represent the mean (± SE) of the Hamming distances for multiclonal (0.6 ± 0.2) and clonal (0.29 ± 0.05) grafts in secondary and for multiclonal (0.47 ± 0.23) and clonal grafts (0 ± 0) in tertiary mice, respectively.
One possible interpretation for lineage dominance could be that these HSCs are leukemic. However, this seems to be unlikely for the following reasons: the hosts had normal-sized, and -formed organs (spleen, BM, thymus, heart, liver, kidney), revealing no overt signs of leukemia or hyper-proliferative diseases even after 3 rounds of transplantation. The ability to respond to low concentrations of cytokines is a hallmark of some types of leukemia. We found that the myeloid progeny of the myeloid-dominant HSC clone B2 required the same concentration of GM-CSF for proliferation, as do cells from unmanipulated control BM (data not shown). Composition of the T-cell–receptor repertoire can be indicative of abnormalities in the hematopoietic system.30Judged by the representation of T-cell–receptor vβ types on splenic T cells, myeloid- and lymphoid-dominant HSC clones (clones C2 and B2) had replenished the complete receptor repertoire analyzed (data not shown). Overall, the data are consistent with the interpretation that myeloid- and lymphoid-dominant HSCs gave rise to normal progeny.
Discussion
A clonal transplantation system was used to examine the generation of HSC heterogeneity. Our data demonstrate an unexpected similarity among the daughter HSCs of clonally derived HSCs. The similarity encompassed all HSC behaviors measured: self-renewal, primitiveness, and lineage contribution. Stability of the lineage contribution was especially evident in the lineage-dominant HSCs. These data suggest that HSC behavior in adult bone marrow is largely predetermined. Daughter HSCs from multiclonal grafts showed more heterogeneous behavior in the kinetics of repopulation and in the lineage contribution. The most likely explanation for these observations is that HSC behavior is preprogrammed and that self-renewal does not induce HSC heterogeneity. The heterogeneity of the HSCs derived from multiclonal grafts is likely a reflection of the heterogeneous clonal composition of the mixture of HSCs, initially transplanted into the control primary host.
The clonal transplantation system that was used here readily distinguished different types of HSCs. Those HSCs that had self-renewed in the primary host generated an unknown number of daughter HSCs. If an HSC had self-renewed extensively, the secondary grafts could have contained many HSCs. This would lead to a composite, and thus level, repopulation kinetics, comparable to that generated by the multiclonal BM grafts in the primary recipients. Repopulation kinetics of daughter HSCs derived from clone 7of9 are consistent (though not conclusively so) with such a scenario. However, daughter HSCs derived from other HSC clones repopulated poorly or transiently, consistent with a limited number of HSCs in the secondary grafts. In this situation, HSC heterogeneity should have been discernible in the secondary recipients. Indeed, heterogeneity was seen in the daughter HSCs derived from multiclonal grafts. This supports the interpretation that the secondary grafts (of most clonal and multiclonal HSC transplants) contained sufficiently low numbers of HSCs to readily resolve different types of HSCs in the grafts. This is supported by the observation that lineage dominance was observable through serial transplantation. Because the frequency of lineage-dominant HSCs is low, a multiclonal HSC graft should have obscured the lineage dominance. The interpretation that HSCs were limiting in the serial transplants is consistent with published studies5,31 32 showing that the HSC compartment is not fully regenerated after transplantation. Overall, the data indicate that daughter HSCs from the clonally derived HSCs behaved similarly to each other, supporting the view that the HSC behaviors measured here are preprogrammed.
The similarity in the behaviors of the daughter HSCs is further emphasized by the synchronous extinction of several clones in secondary or tertiary recipients. Concerted cessation of clone r16.3 in the secondary mice suggests that clonal extinction is unlikely caused solely by the transplantation procedure. Collectively, the data suggest that the lifespan of each HSC clone is predetermined and that clonal extinction results from a concurrent cessation of the self-renewal of all HSCs within a clone. Consistent with a predetermined lifespan is the observation that most clones showed less primitive repopulation kinetics in the secondary than in the primary hosts. This suggests that within a clone all daughter HSCs progress synchronously from a primitive to a less primitive state. This agrees with the central tenet of the generation-age hypothesis33 that HSCs age and lose primitiveness with each proliferation step. That the history of a cell determines its behavior is an inherently deterministic view.
The HSCs examined here self-renewed and differentiated in vivo, in a complete and physiological environment. We did not examine whether HSC programs can be changed by extrinsic signals. However, on transplantation, HSCs should have had access to functionally different niches. Our data suggest that this does not contribute to the HSC heterogeneity. However, it is possible that each HSC clone is preprogrammed to express a distinct set of homing molecules, directing all HSCs within a clone to the same type of niche. Subsets of HSCs with distinct patterns of homing receptors have been isolated,34 supporting the plausibility of this interpretation. Alternatively, each niche could be composed of several types of stromal cells. This is consistent with the structure of the hematon, an aggregate isolated from BM, thought to represent in situ niches.17 Such mixed niches would be functionally fairly homogeneous and would be permissive for the deterministic programs of different types of HSC. In either case, HSCs would be dependent on stromal niches for the execution of their programs.
Although the daughter HSCs within each clone behaved similarly, different HSC clones showed clearly distinguishable repopulation patterns. Thus, the HSC compartment in adult BM is heterogeneous. Our data indicate that this heterogeneity is not generated continuously. This suggests that stem cell heterogeneity is generated earlier in development, perhaps when stem cells seed to the BM during development. Alternatively, as predicted by the generation-age hypothesis, HSC heterogeneity may be generated by the preprogrammed aging of HSCs. At the time of analysis, a snapshot of the current state of the HSC compartment would then reveal HSCs at different stages in the aging process.
Another unique feature of clonal analysis was the identification of infrequent lineage-dominant HSCs. In the regenerating hematopoietic system, the appearance of mature cells in blood progresses through a reproducible sequence.5,6 Early after transplantation, myeloid cells are overrepresented in the periphery, followed by bursts of B and then of T lymphocytes. The sequence with which these cells appear in the periphery reflects the time it takes for these lineages to mature. Lineage-dominant repopulation patterns, similar to those described here, were noted in the analysis of retrovirally marked HSCs.4 Although a population of HSCs that generated stably and long-term skewed ratios of myeloid and lymphoid cells was found,4 the data were interpreted to represent the dynamic changes of lineage contribution after transplantation. We followed the repopulation behavior of lineage-dominant HSCs through serial transplantations, and the data demonstrate that lineage dominance is a stable behavior of a subset of HSCs. Many of the lineage-dominant HSCs had self-renewal capacity, indicating that lineage dominance is not associated with a loss of primitiveness. Because loss of self-renewal capacity is a hallmark of lineage commitment, lineage dominance is unlikely to be a reflection of lineage commitment. Rather, lineage-dominant HSCs are a normal subset of stem cells with distinct developmental potential. Myeloid-dominant HSCs have been attributed to the aging of the HSC compartment.35 We and others4 5 demonstrated lineage-dominant HSCs through clonal analysis in young mice. Thus, myeloid dominance is not associated with the pathology of aging. Perhaps a selective loss of lymphoid-dominant stem cells could account for the imbalance seen in the aged animals.
The stability of the behavior of the adult HSC points toward epigenetic effects that may determine the developmental potential of each HSC. Epigenetic events, such as stable changes in chromatin and DNA methylation, cause long-lasting changes in gene expression. The generation of all tissue-specific stem cells from embryonic stem cells likely involves epigenetic changes that ensure a stable supply of functionally restricted stem cells.36 37 Such changes also could cause modifications in the expression of genes required for the optimal establishment of precursors or mature cells in the underrepresented lineage and could thereby account for stable lineage dominance.
Our results open the possibility that distinct subsets of HSCs will be optimal for different applications. For example, lineage-dominant stem cells could be used to selectively remedy lineage-specific cytopenias. Moreover, HSC heterogeneity, fixed through epigenetic mechanisms, may well account for the heterogeneity seen in stem-cell leukemias.38 Characterizing the mechanisms of lineage dominance may not only be biologically important, it may have therapeutic usefulness.
We thank Drs P. Linton, C. Bonifer, and J. Phillips for valuable discussions and suggestions.
Supported by National Institutes of Health grants DK48015, AG09948, and AG17564.
The publication costs of this article were defrayed in part by page charge payment. Therefore, and solely to indicate this fact, this article is hereby marked “advertisement” in accordance with 18 U.S.C. section 1734.
References
Author notes
Christa E. Müller-Sieburg, Sidney Kimmel Cancer Center, 10835 Altman Row, San Diego, CA 92121; e-mail:cmuller@skcc.org.


This feature is available to Subscribers Only
Sign In or Create an Account Close Modal