Abstract
CD8α+ dendritic cells (DCs) represent a functionally distinct DC subset in vivo, which plays a critical role in initiating various cellular immune responses. However, the committed precursor of CD8α+ DCs remains to be identified. We reported here that murine splenic CD8α+CD11c− lineage phenotype (Lin)− cells could differentiate into CD8α+DCs in vivo after intravenous transplantation. Immunohistochemistry staining showed that donor-derived DCs mainly located in T-cell areas of the spleen. Functionally, these CD8α+CD11c−Lin− cell–derived DCs were capable of stimulating allogenic T-cell response, as well as secreting bioactive interleukin 12 p70 and interferon γ. Freshly isolated CD8α+CD11c−Lin− cells expressed CC chemokine receptor (CCR)2, CCR5, and CCR7 messenger RNA, whereas CD8α+ DCs derived from CD8α+CD11c−Lin− cells further obtained the expression of CCR6 and macrophage-derived chemokine. Flow cytometry analysis showed that CD8α+CD11c−Lin− cells were identified in bone marrow and lymph nodes. Moreover, transplanted splenic CD8α+CD11c−Lin− cells could also home to thymus and lymph nodes and were capable of developing into CD8α+ DCs in these locations. However, CD8α+CD11c−Lin−cells failed to differentiate into CD8α− DCs, T cells, natural killer cells, or other myeloid lineage cells in irradiated chimeras. Taken together, all these findings suggest that CD8α+CD11c−Lin− cells are a committed precursor of CD8α+ DCs.
Introduction
Dendritic cells (DCs) are professional antigen-presenting cells that play a pivotal role in the control of immunity.1-3 DCs are heterogeneous in populations, and at least 3 DC subpopulations have been identified in the mouse spleen based on the expression of CD4 and CD8α, namely CD8α−CD4−, CD8α−CD4+, and CD8α+CD4−, respectively.4 It has been demonstrated that these DC subsets are different not only in phenotype and function but also in geographic localization in lymphoid organs.1-3,5 CD8α+ DCs reside in the T-cell areas of periarterial lymphoid sheath (PALS), whereas CD8α− DCs are present in the marginal zones.5 Functionally, CD8α+ but not CD8α− DCs secrete high levels of interleukin-12 (IL-12) and interferon-γ (IFN-γ) to promote Th1 response.6-8Süss and Shortman9 and Kronin et al10previously reported that CD8α+ DCs could regulate both CD4 T-cell and CD8 T-cell responses, associated with DC-mediated immune tolerance.9,10 It has been recently shown that CD8α+ but not CD8α− DCs cross-prime cytotoxic T cells in vivo.11,12 All these data indicate that CD8α+ DCs represent a functionally distinct DC subset in vivo that plays a critical role in initiating various cellular immunities.1 13
Accumulating evidence indicates that several committed hematopoietic progenitor cells can differentiate into CD8α+DCs.14-20 Ardavin et al14 reported that CD8α+ DCs could be generated in vivo from lymphoid-committed CD4low precursors isolated from the thymus, indicating that CD8α+ DCs were of lymphoid lineage origin. The fact that mice deficient for Ikaros,21a transcription factor that controls the differentiation of lymphoid cells, do not show impairment of CD8α+ DC development in vivo suggests that there may be an alternative pathway for the generation of CD8α+ lymphoid DCs. In contrast, recent studies indicate that both common myeloid progenitors (CMPs) and common lymphoid progenitors (CLPs) can differentiate into CD8α+DCs with an identical DC function and localization in lymphoid organs.19,20 These data suggest that CD8α+DCs may be generated in vivo from different hematopoietic progenitor cells (HPCs) via a common differentiation pathway that is still ill defined. Lacking a system to exclusively generate CD8α+DCs in vivo and in vitro has hampered the insight into the ontogeny of CD8α+ DCs. It was previously reported that CD8α+CD11c−/dull cells were increased in Flt3 ligand (Flt3L)–treated mice, along with the significantly increased splenic CD8α+ DCs.5 However, the relationship between CD8α+CD11c−/dull cells and CD8α+ DCs remains unknown.
In the present report, we describe CD8α+CD11c− lineage phenotype (Lin)− cells in the spleen as a committed precursor of CD8α+ DCs, which fail to give rise to CD8α− DCs, T cells, natural killer (NK) cells, or other myeloid lineage cells in irradiated chimeras.
Materials and methods
Mice
C57BL/6 Ly5.2 and BALB/c mice were obtained from CLEA Experimental Animal Co Ltd (Tokyo, Japan), and congenic C57BL/6 Ly5.1 mice were obtained from Dr H. Ishikawa (Keio University School of Medicine, Tokyo, Japan). They were maintained under specific pathogen-free conditions in the Animal Facility of Department of Molecular Preventive Medicine, School of Medicine, The University of Tokyo (Tokyo, Japan). All animal experiments complied with the standards set out in the Guidelines for Care and Use of Laboratory Animals of the University of Tokyo.
Antibodies
Antibodies that were used for immunofluorescence staining were obtained from BD PharMingen (San Diego, CA) unless otherwise indicated. DEC-205 (NLDC-145) monoclonal antibody (MoAb) was obtained from BMA Biomedicals (Augst, Switzerland). Fluorescein isothiocyanate (FITC)–conjugated goat F(ab′)2 antirat immunoglobulin G (IgG; heavy and light chains (H&L)) was purchased from Leinco Technologies (Ballwin, MO). Phycoerythrin (PE)–conjugated anti-CD40 (3.23), PE-conjugated anti-CD86 (RMMP1), and FITC-conjugated anti-CD86 were purchased from Immunotech (Marseille, France). CD11c (N418) MoAb was obtained from Serotec (Oxford, England). As secondary antibodies, alkaline phosphatase–conjugated goat antirat IgG was bought from Jackson ImmunoResearch Laboratories (West Grove, PA), whereas alkaline phosphatase–conjugated goat antihamster IgG was from Cedarlane (Ontario, Canada). Streptavidin-peroxidase (Histofine) was purchased from Nichirei Corporation (Tokyo, Japan).
Purification and transplantation of CD8α+CD11c−Lin− cells
CD8α+CD11c−Lin− cells were isolated from the mouse spleen. In brief, mononuclear cells (MNCs) from the splenocytes were isolated by Lymphoprep (density, 1.077 ± 0.001 g/mL; Nycomed Pharma AS, Oslo, Norway) gradient centrifugation and then were enriched using MACS (Miltenyi Biotec, Germany) by incubation with CD8α-microbeads (Miltenyi Biotec). Cells retained in the column were eluted and then 3-color stained with FITC-conjugated anti-CD8α (53-6.7), a cocktail of PE-labeled MoAbs to CD3ε (145-2C11), B220 (RA3-6B2), Gr-1 (RB6-8C5), CD11b (M1/70), NK1.1 (PK136), and biotin-conjugated anti-CD11c (HL3), followed by APC-conjugated streptavidin. CD8α+CD11c−Lin− cells were isolated by using a cell sorter (EPICS ELITE; Beckman Coulter). The purity was consistently more than 98% as reanalyzed with the cell sorter. Similarly, CD8α+CD11c−Lin− cells were isolated from the bone marrow (BM) and lymph nodes (combined axillary, cervical, inguinal, and mesenteric lymph nodes). In some experiments, the sorted CD8α+CD11c−Lin−cells were further stained with PE-conjugated anti-Ia (AF6-120.1), anti-CD40, anti-CD86, anti-CD4 (H129.19), or biotin-conjugated anti-CD8β (53-5.8) revealed with APC-streptavidin, respectively. BM-derived Lin− c-kit+ HPCs were isolated and purified as previously described.22 23
Before intravenous transfer, the congenic Ly5.1 B6 mice received 10.5 Gy γ-radiation and then used as recipients. CD8α+CD11c−Lin− cells (3-5 × 10⁵) isolated from Ly5.2 B6 mice were intravenously transferred to the lethally irradiated congenic Ly5.1 B6 recipient mice, accompanied by 2 × 10⁵ recipient-type (Ly5.1-type) BM cells to rescue the recipient mice from lethal irradiation. Mice transferred with Ly5.1-type BM cells only were used as negative control, whereas mice transferred with Ly5.2-type BM-derived Lin−c-kit+ HPCs or BM cells were used as positive control. The spleens of the recipient mice were analyzed 1 to 4 weeks after transfer.
Immunofluorescence analysis
Immunofluorescence analyses were performed as previously described.22 23 Cells were preincubated with 2.4G2 to prevent binding to FcγRII/III to reduce the nonspecific staining unless rat DEC-205 MoAb was used as the primary antibody staining. In 2-color analyses, 4 × 10⁵ indicated cells were incubated with FITC-conjugated anti-Ly5.2 (104) as well as PE-conjugated anti-Ia, anti-CD3ε, anti-B220, anti-NK1.1, or anti–Gr-1. In tri-color analyses, 4 × 10⁵ cells were incubated with optimal concentration of biotin-conjugated anti-Ly5.2, followed by APC-conjugated streptavidin, as well as stained with PE-conjugated anti-Ia and FITC-conjugated anti-CD11c, anti-CD8α, anti-CD40, anti-CD86, or anti-CD11b. In some experiments, cells were stained with purified rat anti–DEC-205, followed by FITC-conjugated goat F(ab′)2 antirat IgG (H&L) as the second stage. The instrument compensation was set in each experiment by using single-color and/or 2-color stained samples. Dead cells were excluded with forward scatter, side scatter, and propidium iodide gating. In some experiments, the corresponding cell subpopulations were isolated with the use of a cell sorter.
Immunohistochemistry staining
Double immunostaining was performed by indirect immunoalkaline phosphatase or immunoperoxidase methods.24 In short, spleen specimens were removed and embedded in Tissue-Tek O.C.T. compound (Miles, Elkhart, IN), frozen in liquid nitrogen, and cut by a cryostat into 7-μm–thick sections, air-dried overnight, and fixed in acetone for 10 minutes at room temperature. The sections were sequentially incubated with optimal dilution of biotin-conjugated anti-Ly5.2 followed by streptavidin-peroxidase. Peroxidase activity was visualized with 3-amino-9-ethylcarbazole (Vector Laboratories, Burlingame, CA) showing red color. The sections were then incubated with hamster antimouse CD11c (N418) followed by alkaline phosphatase–conjugated goat antihamster IgG staining. Sections were also separately stained with rat anti–DEC-205 or anti-CD8α followed by goat antirat IgG complexed to alkaline phosphatase. Alkaline phosphatase activity was developed with the Vector Blue substrate (Vector Laboratories) revealing in blue color. Levamisole (0.024%; Sigma Chemical, St Louis, MO) was added to the reaction mixture to block endogenous alkaline phosphatase activity. In these preparations, peroxidase activity yields a red color reaction product, whereas alkaline phosphatase activity appears blue in color.
Isolation of DCs
Different DC subsets were isolated from the spleens, thymi, and lymph nodes (combined axillary, cervical, inguinal, and mesenteric lymph nodes) as previously described25 with slight modification. Briefly, spleens, thymi, and lymph nodes were digested with collagenase D (1 mg/mL; Boehringer Mannheim, Roche, Germany), and MNCs were isolated by Lymphoprep gradient centrifugation. After these MNCs were incubated with microbead-conjugated anti-CD11c MoAb (N418; Miltenyi Biotec), CD11c+ cells were sorted by MACS and used for phenotyping analyses by 2-color or 3-color immunofluorescence staining. In some experiments, the corresponding cell subpopulations were further purified with the cell sorter. The purity is more than 98% as revealed by immunofluorescence reanalysis.
Cytokine assay
Sorted host-type CD8α+ DCs from Ly5.1 BM cell–reconstituted Ly5.1 B6 mice and Ly5.2+CD8α+Ia+ DCs from Ly5.2+CD8α+CD11c−Lin−precursor– reconstituted Ly5.1 B6 mice were cultured in different conditions to stimulate the production of IL-12 and IFN-γ. To measure IL-12 production, 7.5 × 10⁴ DCs were stimulated in vitro with granulocyte-macrophage colony-stimulating factor (GM-CSF) (20 ng/mL; Kirin Brewery, Tokyo, Japan) + IFN-γ (20 ng/mL; PeproTech EC, London, England) + Pansorbin (50 μg/mL; Calbiochem, Darmstadt, Germany) for 40 hours. To measure IFN-γ production, 3.3 × 10⁴ DCs were stimulated in vitro with rmIL-12 (16 ng/mL; kindly provided by Nippon Roche Research Center, Kamakura, Japan) for 48 hours. Supernatants were collected and quantified by enzyme-linked immunosorbent assay (ELISA). Mouse IL-12 p70 ELISA kit was purchased from Genzyme (sensitivity, < 2.5 pg/mL; Minneapolis, MN), whereas mouse IFN-γ ELISA kit was from Endogen (sensitivity, < 15 pg/mL, Woburn, MA).
Mixed leukocyte reaction
Allogenic CD4+ T cells from BALB/c mice were used as responders and prepared as previously described.23,26Briefly, the adherent cells were first removed by incubating splenic MNCs at 37°C for 60 minutes in Iscoves modified Dulbecco medium (GIBCO, Rockville, MD) containing 10% fetal bovine serum. The nonadherent splenic MNCs were incubated with microbead-conjugated antimouse CD4 MoAb (Miltenyi Biotec, Germany), and CD4+ T cells were separated with magnetic cell sorting. BM Lin−c-kit+ HPCs were obtained and cultured to generate mature DCs as previously described.23 Splenic Ly5.2+CD8α+Ia+ cells from naive Ly5.2 B6 mice and reconstituted mice, as well as BM-derived mature DCs, were used as stimulators and treated with mitomycin C (15 μg/mL; Sigma Chemical) as previously described.27 Graded doses of stimulator cells (from 100 to 3 × 10⁴ cells) were added to the T cells (3 × 10⁵) in wells of 96-well round-bottomed microtest tissue-culture plates (Nunc, Roskilde, Denmark), respectively. After incubating at 37°C for 4 days, cell proliferation was determined by using 3-(4,5-dimethyl thiazolyl-2)-2,5-diphenyltetrazolium bromide (Sigma Chemical). The resultant absorbance at 550 nm was read by a microplate immunoreader.
Reverse transcription–polymerase chain reaction
Total RNAs were extracted from 2 × 10⁵indicated cells by using RNAzol B (Biotex Laboratories, Houston, TX), according to the manufacturer's instructions. First-strand complementary DNA (cDNA) was synthesized at 37°C for 1 hour from 200 ng total RNA in 25 μL reaction volume with the use of random primers (Promega, Madison, WI). Thereafter, cDNA was amplified for 35 cycles consisting of 94°C for 30 seconds, 55°C for 1 minute, and 72°C for 1 minute, with a pair of oligonucleotide primers corresponding to each chemokine or chemokine receptor.28Glyceraldehyde-3-phosphate dehydrogenase (GAPDH) transcript was amplified in parallel as control. The corresponding oligonucleotide primers were as follows: 5′-TGTTACCTCAGTTCATCCACGG-3′ and 5′-CAGAATGGTAATGTGAGCAGGAAG-3′ were designed for murine CC chemokine receptor (CCR)2, 5′-CATCGATTATGGTATGTCAGCACC-3′ and 5′-CAGAATGGTAGTGTGAGCAGGAA-3′ for murine CCR5, 5′-ACTCTTTGTCCTCAC-CCTACCG-3′ and 5′-ATCCTGCAGCTCGTATTTCTTG-3′ for murine CCR6, 5′-CATCAGCATTGACCGCTACGT-3′ and 5′-GGTACGGATGATAATGAGGTAGCA-3′ for murine CCR7, 5′-TCTGATGCAGGTCCCTATGGT-3′ and 5′-TTATGGAGTAGCTTCTTCACCCAG-3′ for murine macrophage–derived chemokine (MDC), and 5′-CCTTCATTGACCTCAACTAC-3′ and 5′-AGTGATGGCATGGACTGTGGT-3′ for GAPDH. The polymerase chain reaction (PCR) products were fractionated on 1.5% agarose gel and visualized by ethidium bromide staining.
Statistical analysis
Significant differences were evaluated by using the Studentt test. P < .05 was considered to be statistically significant.
Results
Isolation of CD8α+CD11c−Lin− cells
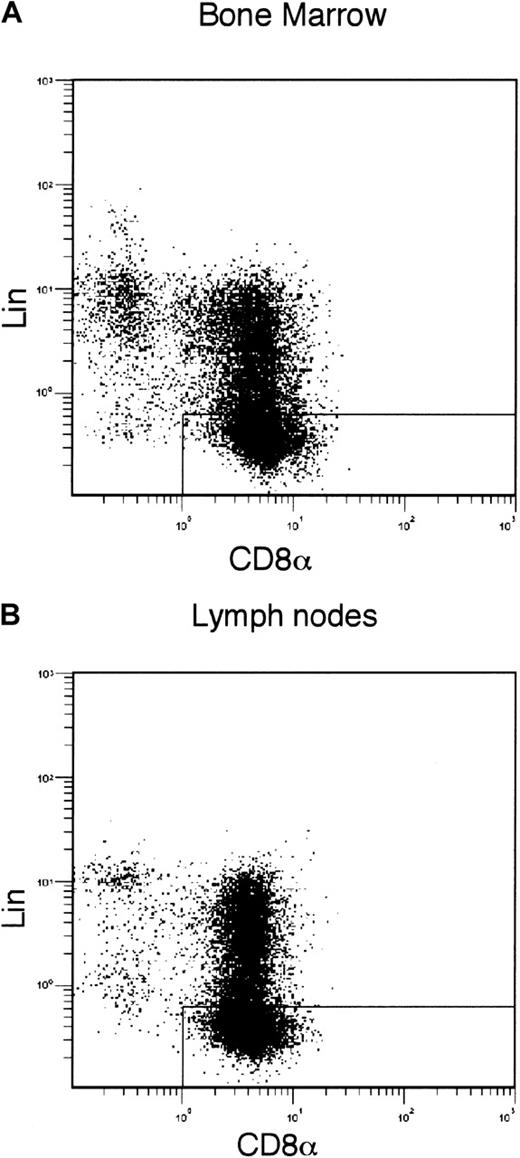
To identify the committed precursor of CD8α+DCs in vivo, CD8α+CD11c−Lin−cells were isolated from the spleens. Tricolor-fluorescence analyses showed that these CD8α+CD11c−Lin− cells did not express any detectable level of CD3ε, B220, CD11b, Gr-1, NK1.1, Ia, CD40, CD86, or CD4 (Figure 1A-B). They expressed CD8β (Figure 1B). As shown in Figure 1C, the expression level of CD8α on the spleen-derived CD8α+CD11c−Lin− cells was as high as on CD8 T cells. This cell population was scarce and only represented 0.2% to approximately 0.25% of the whole splenocytes in the C57BL/6 mice (Figure 1A). Giemsa staining showed that freshly sorted CD8α+CD11c−Lin− cells displayed a round lymphoid cell–like morphology (Figure 1D). In addition, as shown in Figure 2, CD8α+CD11c−Lin− cells were also detected in the BM and lymph nodes (combined axillary, cervical, inguinal, and mesenteric lymph nodes). They represented 0.2% of the lymph node cells and 0.06% of BM leukocytes, respectively.
Isolation of CD8α+CD11c−Lin−cells from the spleen.
(A) The splenocytes enriched by CD8α-microbeads, as described in “Materials and methods,” were stained with biotin-conjugated anti-CD11c MoAb, followed by APC-conjugated streptavidin, as well as FITC-conjugated anti-CD8α, PE-conjugated anti-Lin markers (CD3ε, B220, Gr-1, CD11b, and NK1.1). The CD8α+Lin−cells for sorting were gated on CD11c− cells. The purity of the CD8α+CD11c−Lin− cells after sorting was presented (> 98%). The quads were set up on the isotype-matched control dot plot. The results are representative of more than 6 independent experiments. (B) CD8α+CD11c−Lin− cells were first isolated by using a cell sorter and then further stained with PE-conjugated anti-Ia, anti-CD40, anti-CD86, anti-CD4, as well as biotin-conjugated anti-CD8β, revealed with APC-streptavidin. Solid and dotted lines indicated the immunofluorescence intensity of cells stained with a control and the test antibodies, respectively. The results are representative of 4 independent experiments. (C) CD8α expression of spleen-derived CD8α+CD11c−Lin− cells. The CD8α+CD11c−Lin− cells were first isolated by using a cell sorter as described in (A), and then reanalyzed by FACS (shown as solid line). For CD8αCD3ε T cells, the CD8α-microbead–enriched cells were stained with FITC-conjugated anti-CD8α and PE-conjugated anti-CD3ε. The CD8αCD3ε T cells were isolated by using a cell sorter and then reanalyzed by FACS (shown as dotted line). The results are representative of 3 independent experiments. (D) Giemsa staining was performed on CD8α+CD11c−Lin− cells after sorting. The results are representative of 4 independent experiments. Original magnification × 400.
Isolation of CD8α+CD11c−Lin− cells from BM and lymph nodes.
BM cells (A) and lymph node cells (combined axillary, cervical, inguinal, and mesenteric lymph nodes; B) were enriched by CD8α-microbeads and then stained with biotin-conjugated anti-CD11c, revealed with APC-streptavidin, as well as FITC-conjugated anti-CD8α, PE-conjugated anti-Lin markers (CD3ε, B220, Gr-1, CD11b, and NK1.1). The CD8α versus Lin markers staining was gated on CD11c−cells. The gate indicated the BM-derived (A) and lymph node–derived (B) CD8α+CD11c−Lin− cells, respectively. The results are representative of 3 independent experiments.
CD8α+CD11c−Lin− cells differentiate into CD8α+ DCs in vivo
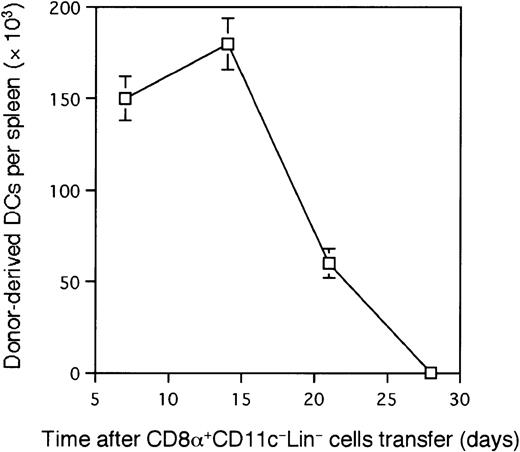
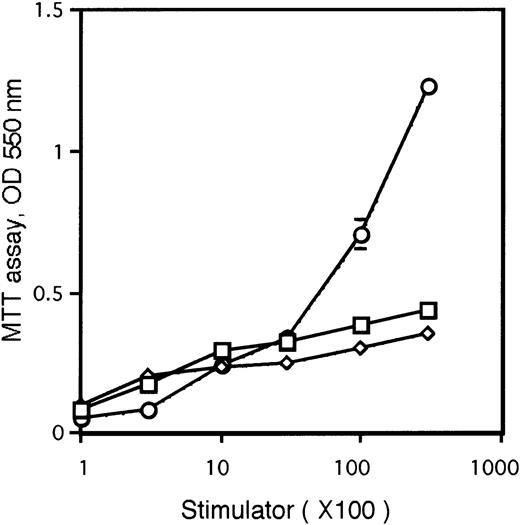
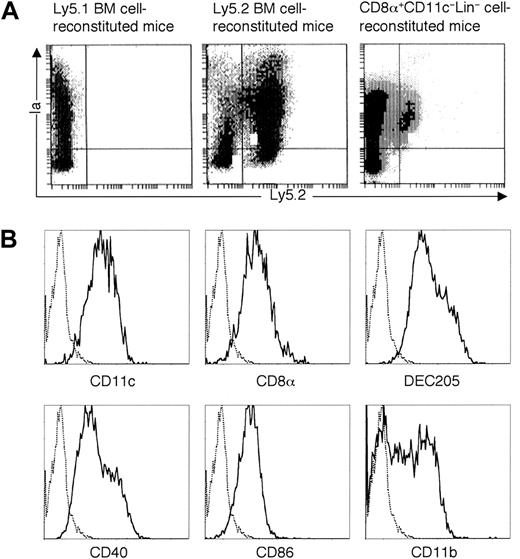
To elucidate whether CD8α+CD11c−Lin− cells might be able to differentiate into CD8α+ DCs in vivo, 5 × 10⁵CD8α+CD11c−Lin− cells isolated from the spleens of Ly5.2 B6 mice were injected intravenously into lethally irradiated Ly5.1 congenic B6 mice. Recipient type (Ly5.1-type) BM cells (2 × 10⁵) were simultaneously transferred to rescue the mice from lethal irradiation. At the indicated time points after transfer, the recipients were killed, and splenocytes were analyzed by immunofluorescence staining. As shown in Figure3A and Figure4, donor-derived Ly5.2+Ia+ cells were readily detected as early as 7 days after transplantation in the spleen and peaked at day 14. Donor-derived DCs from CD8α+CD11c−Lin− cells gradually disappeared from the spleen and could not be detected at day 28 (Figure4), suggesting that the life span of CD8α+CD11c−Lin− cell–derived DCs may be limited. These donor-derived cells expressed moderate to high levels of Ia, as well as CD11c, DEC-205, CD40, and CD86 molecules, which are characteristics of DC phenotype (Figure 3C). They also expressed CD11b molecule (Figure 3C). CD11b is expressed at levels ranging from low to high on different lymphoid tissue DC subsets.4,25 29 Most strikingly, all of these donor-derived cells were positive for CD8α molecule with analyses performed 7 to 21 days after transplantation (Figure 3C and not shown). Morphologically, these freshly isolated Ly5.2+Ia+CD8α+ cells from CD8α+CD11c−Lin−precursor–reconstituted mice displayed round or irregular shape with small membrane projections (Figure 3B). After culture in the presence of GM-CSF overnight, these donor-derived Ly5.2+Ia+CD8α+ cells demonstrated a typical DC morphology with irregular membranes, beanlike nuclei, and fine dendritic processes (Figure 3B). Functionally, these donor-derived Ly5.2+CD8α+Ia+ DCs stimulated allogenic T-cell proliferation, as wild-type CD8α+ DCs did in a mixed leukocyte reaction (MLR) assay (Figure 5). However, it was less potent than mature DCs generated from BM-derived HPCs (Figure 5). As described in Figure 3B-C, donor-derived DCs expressed moderate to high levels of Ia, and freshly isolated donor-derived DCs displayed round to irregular shape, which indicated that donor-derived cells consisted of immature and mature DCs. The heterogeneous immature and mature stages of donor-derived DCs may explain the lower allogenic T-cell response than mature BM-derived DCs.
Development of donor-derived DCs in the spleens from CD8α+CD11c−Lin− cells in vivo.
(A) CD8α+CD11c−Lin− cells isolated from the spleens of Ly5.2 B6 mice were intravenously transferred to the lethally irradiated congenic Ly5.1 B6 recipient mice, accompanied by Ly5.1-type BM cells to rescue the recipient mice from lethal irradiation. Mice transferred with Ly5.1-type BM cells only were used as negative control, whereas mice transferred with Ly5.2-type BM-derived Lin−c-kit+ HPCs were used as positive control. At day 14, splenocytes were isolated and enriched with CD11c-conjugated microbeads, as described in “Materials and methods” and then stained with FITC-conjugated anti-Ly5.2 and PE-conjugated anti-Ia. The quads were set up on the isotype-matched control dot plot. The results are representative of 6 independent experiments. (B) Giemsa staining was performed on sorted Ly5.2+CD8α+Ia+ cells from CD8α+CD11c−Lin−cell–reconstituted mice, which were isolated freshly or cultured overnight with GM-CSF. The results are representative of 3 independent experiments. Original magnification × 400. (C) FACS analyses of CD8α+CD11c−Lin−cell–derived DCs by tricolor staining. Cells were collected as described in (A) and then stained with biotin-conjugated anti-Ly5.2, followed by APC-streptavidin, as well as PE-conjugated anti-Ia, FITC-conjugated anti-CD11c, anti-CD8α, anti-CD40, anti-CD86, or anti-CD11b. As for the staining of DEC-205, rat DEC-205 was used as first antibody, followed by FITC-conjugated goat F(ab′)2antirat IgG (H&L). Data from mice transferred with Ly5.1-type BM cells only were shown as negative control. The quads were set up on the isotype-matched control dot plot. The results are representative of 6 independent experiments.
The kinetics of generation of CD8α
+CD11c−Lin−cell–derived splenic DCs. Each group of 4 irradiated Ly5.1 B6 mice was reconstituted with 5 × 10⁵ sorted CD8α+CD11c−Lin− cells from the spleens of Ly5.2 B6 mice. Donor-derived DCs were identified as Ly5.2+Ia+ cells as described in Figure 3A at various time points (1 to 4 weeks) after transplantation. Each point is the mean ± 1 SD of 3 such reconstitution experiments, each based on a pool of 4 spleens from the reconstituted mice.
Allogenic MLR.
Allogenic MLR was performed by using purified CD4+ T cells (3 × 10⁵ cells/well in 96-round-well plate) as responder cells. ⋄ represents Ly5.2+CD8α+Ia+ DCs from naive Ly5.2 B6 mice (wild-type CD8α+ DCs), whereas ■ represents Ly5.2+CD8α+Ia+ DCs from Ly5.2+CD8α+CD11c−Lin−precursor-reconstituted Ly5.1 B6 mice (donor-derived CD8α+ DCs). ○ represents mature DCs generated from BM-derived HPCs (BM-derived DCs). All the indicated cell subpopulations were purified or generated as described in “Materials and methods.” Results are expressed as the mean ± 1 SD of the triplicate cultures and are representative of 3 independent experiments.
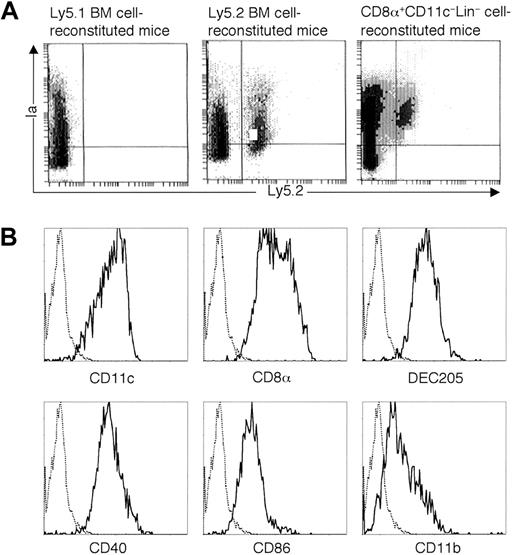
To elucidate whether CD8α+CD11c−Lin− cells could also home to other lymphoid organs, thymi and lymph nodes were isolated from the recipient mice. As shown in Figure6A, donor-derived Ly5.2+Ia+ cells were detected in the thymi at day 14 after transplantation. These donor-derived cells expressed CD11c, CD8α, DEC205, CD40, and CD86 molecules, some of which expressed CD11b molecule (Figure 6B). In addition, as shown in Figure7A, donor-derived Ly5.2+Ia+ cells were also detected in the lymph nodes (combined axillary, cervical, inguinal, and mesenteric lymph nodes) at day 14 after transplantation. These donor-derived cells expressed CD11c, CD8α, DEC205, CD40, and CD86 molecules, some of which expressed CD11b molecule (Figure 7B).
Development of donor-derived DCs in the thymi from CD8α+CD11c−Lin− cells in vivo.
(A) CD8α+CD11c−Lin− cells isolated from the spleens of Ly5.2 B6 mice were intravenously transferred to the lethally irradiated congenic Ly5.1 B6 recipient mice, accompanied by Ly5.1-type BM cells to rescue the recipient mice from lethal irradiation. Mice transferred with Ly5.1-type BM cells were used as negative control, whereas mice transferred with Ly5.2-type BM cells were used as positive control. At day 14 after transplantation, thymi were digested with collagenase D. Collected thymocytes were enriched with CD11c-conjugated microbeads and then stained with FITC-conjugated anti-Ly5.2 and PE-conjugated anti-Ia. The quads were set up on the isotype-matched control dot plot. The results are representative of 3 independent experiments. (B) Phenotype characterization of CD8α+CD11c−Lin− cell–derived thymic DCs. Cells were collected as described in (A) and then stained with biotin-conjugated anti-Ly5.2, followed by APC-streptavidin, as well as PE-conjugated anti-Ia, FITC-conjugated anti-CD11c, anti-CD8α, anti-CD40, anti-CD86, or anti-CD11b. As for the staining of DEC205, rat DEC205 was used as first antibody, followed by FITC-conjugated goat F(ab′)2 antirat IgG (H&L). Solid and dotted lines indicated the histograms of specific stainings and isotope-matched controls gated on the Ly5.2+Ia+ cells, respectively. The results are representative of 3 independent experiments.
Development of donor-derived DCs in the lymph nodes from CD8α+CD11c−Lin− cells in vivo.
(A) CD8α+CD11c−Lin− cells isolated from the spleens of Ly5.2 B6 mice were intravenously transferred to the lethally irradiated congenic Ly5.1 B6 recipient mice, accompanied by Ly5.1-type BM cells to rescue the recipient mice from lethal irradiation. Mice transferred with Ly5.1-type BM cells were used as negative control, whereas mice transferred with Ly5.2-type BM cells were used as positive control. At day 14 after transplantation, combined axillary, cervical, inguinal, and mesenteric lymph nodes were collected and digested with collagenase D. Cells were enriched with CD11c-conjugated microbeads and then stained with FITC-conjugated anti-Ly5.2 and PE-conjugated anti-Ia. The quads were set up on the isotype-matched control dot plot. The results are representative of 3 independent experiments. (B) Phenotype characterization of CD8α+CD11c−Lin− cell–derived DCs in the lymph nodes. Cells were collected as described in (A) and then stained with biotin-conjugated anti-Ly5.2, followed by APC-streptavidin, as well as PE-conjugated anti-Ia, FITC-conjugated anti-CD11c, anti-CD8α, anti-CD40, anti-CD86, or anti-CD11b. As for the staining of DEC205, rat DEC205 was used as first antibody, followed by FITC-conjugated goat F(ab′)2 antirat IgG (H&L). Solid and dotted lines represent the histograms of specific stainings and isotope-matched controls gated on the Ly5.2+Ia+cells, respectively. The results are representative of 3 independent experiments.
To examine the potential of CD8α+CD11c−Lin− cells to generate other lineages in vivo, the expressions of CD3ε (T cells), B220 (B cells), NK1.1 (NK cells), and Gr-1 (granulocytes) on Ly5.2-positive cells were also analyzed by immunofluorescence staining at various time points (1, 2, 3, and 4 weeks) after transplantation. None of these cell lineage markers such as for T cells, NK cells, or myeloid cells were detectable on the surface of donor-derived cells. However, there were a small number of scattered donor-derived B220+ cells that could not be detected 4 weeks after transplantation (Figure 8 and not shown).
CD8α+CD11c−Lin− cells fail to differentiate into T cells, NK cells, or other myeloid lineage cells.
At day 21, the splenocytes from the CD8α+CD11c−Lin−cell–reconstituted mice were collected and stained with FITC-conjugated anti-Ly5.2 and PE-conjugated anti-CD3ε, anti-B220, anti-NK1.1, or anti–Gr-1, respectively. The quads were set up on the isotype-matched control dot plot. The results are representative of 6 independent experiments.
Localization of donor-derived DCs in the spleen sections
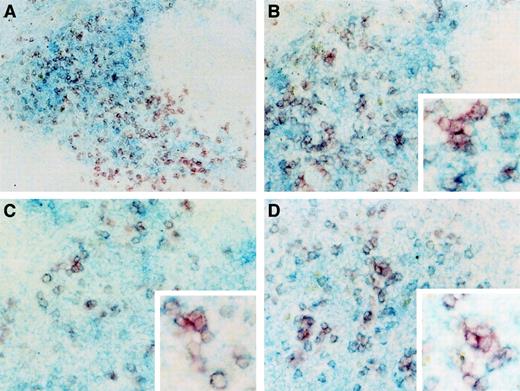
CD8α+ DCs have been identified in the T-cell areas of lymphoid organs,5 whereas CD8α− DCs mainly distribute in the areas of marginal zone surrounding T-cell areas.13 To investigate the localization of donor-derived DCs in the spleen, series of frozen splenic sections from the CD8α+CD11c−Lin−precursor–reconstituted mice were stained with Ly5.2 marker (visualized in red color) in combination with CD8α, CD11c (N418), or DEC-205 (visualized in blue color). CD8α staining represents the T-cell areas of the PALS. As shown in Figure9A-B, all the donor-derived cells were colocalized in the T-cell areas (Figure 9A), and double-stained donor-derived Ly5.2+CD8α+ cells were shown in purple color (Figure 9B). The donor-derived cells also expressed CD11c and DEC-205 antigens (Figure 9C-D). These results suggest that newly generated CD8α+ DCs from donor CD8α+CD11c−Lin− cells exclusively reside in the T-cell areas.
Localization of donor-derived DCs in the spleen sections.
At day 14, the splenic sections were performed and double stained as described in “Materials and methods.” (A) Donor marker Ly5.2 was stained as red color, whereas CD8α marker was stained as blue color. Original magnification, × 100. (B) The same staining was performed as described in (A). Original magnifications, × 200 and × 400 (the insert picture at the right-bottom side). (C-D) Donor marker Ly5.2 was stained as red color, whereas CD11c (C) and DEC205 (D) markers were stained as blue color, respectively. Original magnifications, × 200 and × 400 (the insert pictures at the bottom right sides). The results are representative of 3 independent experiments.
Donor-derived CD8α+DCs secrete IL-12 and IFN-γ on ex vivo culture
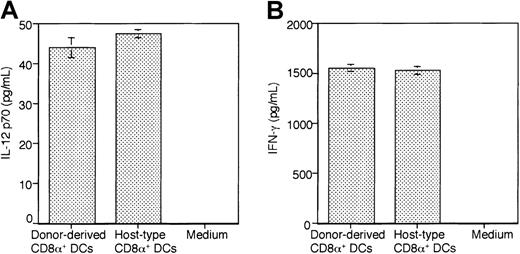
One of the functional features of CD8α+ DCs is that this DC subset exclusively secretes high levels of IL-12 and IFN-γ in response to appropriate stimulations.6-8 To characterize the cytokine profile of the donor-derived DCs, Ly5.2+CD8α+Ia+DCs from Ly5.2+CD8α+CD11c−Lin−precursor–reconstituted Ly5.1 B6 mice and host-type CD8α+ DCs from Ly5.1 BM cell– reconstituted Ly5.1 B6 mice were highly purified by cell sorting. They were cultured in the presence of GM-CSF (20 ng/mL) + IFN-γ (20 ng/mL) + Pansorbin (50 μg/mL) for 40 hours for the secretion of IL-12 p70, or rmIL-12 (16 ng/mL) for 48 hours for the secretion of IFN-γ. As shown in Figure 10A-B, high levels of IL-12 p70 and IFN-γ were detected in the supernatant of donor-type DC cultures.
IL-12 p70 and IFN-γ detection by ELISA.
Ly5.2+CD8α+Ia+ DCs from Ly5.2+CD8α+CD11c−Lin−precursor–reconstituted Ly5.1 B6 mice (donor-derived CD8α+ DCs) and host-type CD8α+ DCs from Ly5.1 BM cell–reconstituted Ly5.1 B6 mice (host-type CD8α+ DCs) were purified as described in “Materials and methods,” respectively. (A) Cells (7.5 × 10⁴) from each population were cultured in the presence of GM-CSF (20 ng/mL) + IFN-γ (20 ng/mL) + Pansorbin (50 μg/mL) in 200 μL medium for 40 hours. (B) Cells (3.3 × 10⁴) from each population were stimulated in vitro with rmIL-12 (16 ng/mL) in 200 μL medium for 48 hours. Supernatants were assayed for IL-12 p70 and IFN-γ with ELISA, respectively. Results are expressed as the mean ± 1 SD of the triplicate cultures and are representative of 3 independent experiments.
Chemokine and chemokine-receptor expression of donor-derived DCs
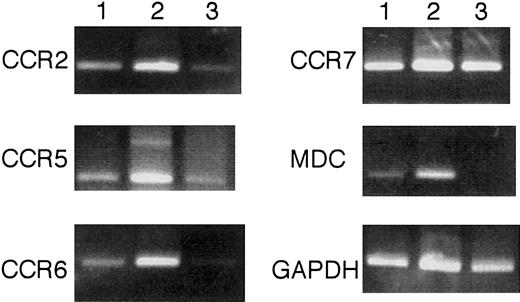
Finally, the expression of chemokine and chemokine receptor of Ly5.2+CD8α+Ia+ DCs from naive Ly5.2 B6 mice (Figure 11, lane 1) and Ly5.2+CD8α+CD11c−Lin−precursor–reconstituted Ly5.1 B6 mice (Figure 11, lane 2), as well as CD8α+CD11c−Lin− cells from Ly5.2 B6 mice (Figure 11, lane 3), was examined by using reverse transcription (RT)–PCR assay. As shown in Figure 11, Ly5.2+CD8α+Ia+ DCs from the reconstituted mice expressed CCRs, such as CCR2, CCR5, CCR6, and CCR7, and a T-cell attracting chemokine, MDC. In contrast, CD8α+CD11c−Lin− cells expressed CCR2, CCR5, and CCR7, but barely CCR6. CD8α+CD11c−Lin− cells did not express MDC.
Chemokine and chemokine receptor expression by RT-PCR.
Ly5.2+CD8α+Ia+ DCs from naive Ly5.2 B6 mice (lane 1), Ly5.2+CD8α+Ia+ DCs from Ly5.2+CD8α+CD11c−Lin−precursor–reconstituted Ly5.1 B6 mice (lane 2), and CD8α+CD11c−Lin− cells from Ly5.2 B6 mice (lane 3) were purified as described in “Materials and methods.” Total RNAs were extracted from 2 × 10⁵indicated cells by using RNAzolB. RT-PCR was assessed as described in “Materials and methods.” The results are representative of 3 independent experiments.
Discussion
DCs in vivo are heterogeneous populations on the basis of their phenotype, function, and tissue distribution.1-13 In mouse lymphoid organs, CD8α+ and CD8α− DC subsets have been identified and termed “lymphoid DCs” and “myeloid DCs,” respectively.1,3,14 15 In this study, we characterized a committed DC precursor, which was identified as CD8α+CD11c−Lin− phenotype in the mouse spleen. Moreover, the CD8α+CD11c−Lin− cells were also identified in BM and lymph nodes. These splenic CD8α+CD11c−Lin− cells could differentiate into immature and mature DCs expressing CD8α antigen. These CD8α+ DCs derived from CD8α+CD11c−Lin− cells resided in the T-cell areas of the spleen. Functionally, these CD8α+CD11c−Lin− cell–derived DCs could stimulate allogenic T-cell proliferation and secrete IL-12 and INF-γ. Interestingly, CD8α+CD11c−Lin− cells failed to differentiate into other cell lineages, including T cells, NK cells, and myeloid cells. However, as shown in Figure 8, there were some scattered donor-derived B220+ cells. We currently could not rule out the possibility that CD8α+CD11c−Lin− cells might be able to generate some B220+ cells of unknown type after transplantation. All these data indicate that CD8α+CD11c−Lin− cells represent a committed precursor of CD8α+ DCs in the mouse spleen. In addition, these CD8α+CD11c−Lin− cells could also home to thymus and lymph nodes and were capable of developing into CD8α+ DCs in these locations.
It is well established that CD8α+ DCs are mainly found in the T-cell areas of PALS of the mouse spleen, whereas CD8α− DCs are found in the marginal zones.5,13 DEC-205 is considered a marker of interdigitating cells (IDCs), and the expression of DEC-205 correlates with that of CD8α.30,31 It has been further clarified that only IDCs are DEC205+ and CD8α+, suggesting that IDCs are the most probable candidates for the CD8α+ subset of DCs, leaving the marginal zone DCs as the CD8α− subset.29 With the use of double-color immunohistochemistry staining, we found that CD8α+CD11c−Lin− cell–derived CD8α+ DCs in the spleen mainly located in T-cell areas of PALS. These donor-derived DCs expressed CD8α, CD11c, and DEC-205 markers, suggesting that donor-derived DCs represent the IDCs in the spleen.
An important role for the chemokine and chemokine receptor system in DC migration and maintenance of the microanatomic environment of secondary lymphoid organs has been studied extensively. It has been reported that CCR2-deficient mice display restrictive DC defects in the localization of CD8α+ Th1-inducing splenic DCs,32 whereas ligand interactions with CCR5 can trigger IL-12 production by the CD8α+ subset of DCs after microbial stimulation.33 Epstein-Barr virus–induced molecule 1 ligand chemokine (ELC) and secondary lymphoid tissue chemokine (SLC) are specifically expressed in the T-cell areas where mature DCs home to become IDCs.34,35 Studies in plt mice36 and CCR7-deficient mice37 provide strong evidence for a determinant role of SLC and ELC/CCR7 axis in directing DC migration to T-cell areas of lymphoid tissues. It has been recently identified that DCs are a major source of MDC in vitro and in vivo.38 The up-regulation of T-cell–attracting chemokine MDC expression may enhance the encounters between DCs and antigen-specific T cells.39 By using RT-PCR, we observed that CD8α+CD11c−Lin− cell–derived CD8α+ DCs expressed CCRs, such as CCR2, CCR5, CCR6, and CCR7, as well as T-cell–attracting chemokine MDC, which displayed the similar expression pattern as CD8α+ DCs from naive B6 mice. Thus, on the basis of the immunohistochemistry study and the expression pattern of chemokine and chemokine receptor, CD8α+CD11c− Lin−precursor–derived CD8α+ DCs represent the splenic CD8α+ DC subset.
Accumulating evidence suggests that CD8α+ and CD8α− DCs play distinct roles in initiating immune responses. In vivo studies revealed that both CD8α+ and CD8α− subtypes of DCs could sensitize naive T lymphocytes and direct the development of distinct T-helper populations. Antigen-pulsed CD8α− DCs induce a Th2-type response, whereas injection of CD8α+ DCs leads to Th1 differentiation.6,7,40 CD8α+ DCs have been shown to produce more IL-12 than CD8α−DCs.6 It was elucidated that, after stimulation with IL-12, splenic CD8α+ DCs produced more IFN-γ than CD8α− DCs did.8 We observed that CD8α+CD11c−Lin− cell–derived CD8α+ DCs were able to secrete similar levels of bioactive IL-12 p70 as well as INF-γ after stimulation with GM-CSF + IFN-γ + Pansorbin and IL-12 in vitro, respectively, as the counterparts from mice receiving autologous BM transplants. These data indicate that donor-derived CD8α+ DCs developed from CD8α+CD11c−Lin− precursors display similar characteristics to those of splenic CD8α+DC subset from mice receiving autologous BM transplants functionally.
Previous studies have demonstrated that CD8α+ DCs can be generated from mouse CD4low lymphoid precursor as well as CD4−8−3−44+25+precursor, suggesting that CD8α+ DCs are of lymphoid origin.14,15,17 However, recent studies have challenged the conception of lymphoid DCs. Martin et al16 have shown that thymic CD4low precursors can generate both CD8α− and CD8α+ DCs in the spleen of the irradiated recipient. More recently, it has been demonstrated that both CMPs and CLPs can differentiate into CD8α+ and CD8α− DC subsets in vivo.19,20 Other studies have also demonstrated that the generation of CD8α+ DCs does not always correspond to the development of lymphoid cells in vivo.41-43 All these data suggest that CD8α+ DCs can be generated from different hematopoietic progenitor cells in vivo. However, it remains unclear whether there is a common differentiation pathway for the generation of CD8α+ DCs among these different hematopoietic progenitor cells.
Several lines of evidence suggest that CD8α+CD11c−Lin− cells represent a committed DC precursor that can develop into CD8α+ DCs. First, CD8α+CD11c−Lin− cells failed to differentiate into CD8α− DCs in vivo. Second, CD8α+CD11c−Lin− cells failed to differentiate into CD8 T cells, NK cells, or myeloid cells in vivo. And third, it was reported that the CD8α+CD11c−/dull cells were increased in Flt3L-treated mice, accompanied by the significantly increased splenic CD8α+ DCs.5 44 Although the differentiation capacity of CD8α+CD11c−/dull cells to CD8α+ DCs had not been investigated in that study, a possible pathway for CD8α+CD11c−/dull cells to develop into CD8α+ DC subset was proposed. Taken together, the above lines of evidence support that CD8α+CD11c−Lin− cells may be the immediate precursor that has committed to differentiate into CD8α+ DCs in vivo. Further experiments will be focused on whether different hematopoietic progenitor cells, such as CMPs and CLPs, may differentiate into CD8α+ DC subset in vivo via the immediate precursor termed as CD8α+CD11c−Lin− cells, which are undertaken in our laboratory.
In summary, the data presented here first characterized a committed DC precursor, which was identified as CD8α+CD11c−Lin− cells in the spleen that could differentiate into CD8α+ DCs but not CD8α− DCs, T cells, NK cells, or other myeloid lineage cells in vivo. Identification of this committed CD8α+ DC precursor will be useful for further understanding the ontogeny of CD8α+ DCs from different hematopoietic progenitor cells at the cellular and molecular levels.
We thank Dr H. Ishikawa (School of Medicine, Keio University, Tokyo, Japan) for his generous provision of C57BL/6 Ly5.1 mice and Dr Yi Zhang (Division of Hematology/Oncology, University of Pennsylvania School of Medicine, Philadelphia) and Dr K. Matsuno (Department of Anatomy I, Dokkyo University School of Medicine, Tochigi, Japan) for their critical reviews of the manuscript.
The publication costs of this article were defrayed in part by page charge payment. Therefore, and solely to indicate this fact, this article is hereby marked “advertisement” in accordance with 18 U.S.C. section 1734.
References
Author notes
Kouji Matsushima, Department of Molecular Preventive Medicine, School of Medicine, The University of Tokyo, 7-3-1, Hongo, Bunkyo-ku, Tokyo 113-0033, Japan; e-mail:koujim@m.u-tokyo.ac.jp.




This feature is available to Subscribers Only
Sign In or Create an Account Close Modal