Abstract
Phosphatidylserine (PS), exclusively present in the inner monolayer of the normal red blood cell (RBC) membrane, is exposed in subpopulations of sickle cells. PS-exposing RBCs were found predominantly among the densest and the very light sickle cells. Within the light RBC fraction, PS exposure was found on reticulocytes, transferrin receptor–expressing reticulocytes, and mature RBCs. The last subset contained low-density valinomycin-resistant RBCs, previously shown to have high Na+ and low K+content. This subpopulation contained the highest percentage of PS-exposing cells. The PS-exposing sickle cells did not show the sustained high cytosolic Ca++ levels that have been shown to activate scramblase activity. Data from this study indicate that PS exposure can occur at different stages in the life of the sickle RBC and that it correlates with the loss of aminophospholipid translocase activity, the only common denominator of the PS-exposing cells. The additional requirement of scramblase activation may occur during transient increases in cytosolic Ca++.
Introduction
The well-preserved asymmetric phospholipid distribution in the red blood cell (RBC) is lost in a subpopulation of sickle cells.1,2 Exposure of phosphatidylserine (PS) on RBCs has been shown to accelerate thrombin-forming processes3 and is therefore thought to contribute to an imbalance in hemostasis in the sickle cell patient. We have previously reported a correlation between the extent of PS exposure in sickle cell patients and their risk for stroke, as assessed by transcranial Doppler rates.4 Similar PS-exposing populations have been reported in a few other diseases, such as β-thalassemia and chronic kidney failure,5-7 but are found most consistently and abundantly in sickle cell anemia.
The mechanisms by which PS-exposing cells are formed and persist in the circulation of sickle cell patients are not known. The absence of PS-exposing subpopulations in hereditary spherocytosis, hereditary elliptocytosis, or α-thalassemia,6,8 indicates that PS exposure cannot simply be attributed to anemia or a higher rate of erythropoiesis. It is unclear how the primary defect in sickle cell anemia, a point mutation in hemoglobin leading to polymerization of RBCs under deoxygenating conditions, could result in the formation of PS-exposing cells. Phospholipid asymmetry is maintained by the adenosine 5′-triphosphate (ATP)–dependent aminophospholipid translocase, or flipase, which actively transports PS (and phosphatidylethanolamine) from the outer to the inner monolayer.9 In addition to inhibition of the flipase, active phospholipid scrambling is needed to expose PS on the membrane surface.10 In RBCs, this process can be initiated by activation of a Ca++-dependent scramblase.11,12 There is independent evidence that many sickle RBCs experience periods of increased cytoplasmic Ca++ during deoxygenation-induced sickling.13Repeated sickling of sickle cells has been shown to lead to formation of dense cells and irreversibly sickled cells (ISCs) that are present in the mature RBC population.14-16 Sickle cell dehydration is mediated in part by activation of the Ca++-dependent K+ (Gardos) channels.13 17
On the basis of these findings, we hypothesized that the cell membrane damage and calcium influx accompanying repeated sickling in vivo could directly lead to induction of membrane phospholipid scrambling. This idea was supported by the finding that high hemoglobin F, which prevents sickling, resulted in fewer PS-exposing cells.18We anticipated that PS-exposing cells would be found mainly in the dense cell fraction, representing the cells that are damaged possibly owing to multiple sickling events, and would share common denominators, such as ISC morphology, increased cytosolic Ca++, a decreased flipase activity, and an increased scramblase activity. We therefore analyzed the density distribution of PS-exposing sickle cells, using labeling with fluorescent annexin V (AV), and tested the correlation of PS exposure with measurements of RBC morphology, cytosolic Ca++, and flipase and scramblase activity.
We find that PS-exposing cells are present in both the high and the very low-density fractions of sickle cells, in the very young (transferrin receptor–exposing reticulocytes) as well as mature RBCs. The common denominator of the PS-exposing cells is the inhibition of the flipase. Our data indicate that the mechanisms that induce PS exposure in sickle cells can be activated at an early stage of RBC maturation as well as during life in the circulation.
Materials and methods
Red blood cells
Human venous blood in EDTA anticoagulant was obtained from sickle cell patients (homozygous for hemoglobin S) after informed consent. Our patient population consisted mainly of children and young adults. For the detailed studies, samples were selected only from patients who were not recently or chronically transfused, and not treated with hydroxyurea. Hydroxyurea treatment will change cell-density patterns, and transfusion results in heterogeneous RBC populations. Whole blood was kept at 4°C and used within 24 hours. White blood cells were removed by passing 1 mL blood on a 2-mL column of α-cellulose/Sigmacell 50 (Sigma, St Louis, MO) 1:1,19eluted with K-buffer (80 mM KCl, 70 mM NaCl, 10 mM Hepes, 0.2 mM MgCl2, and 0.05 mM ethyleneglycotetraacetic acid [EGTA], pH 7.4). In addition, RBCs were washed twice in at least 10 vol K-buffer, with very careful aspiration of the remaining buffy coat to leave the upper layer of RBCs intact.
Labeling with AV and flow cytometric analysis
Labeling with fluorescein isothiocyanate–AV (FITC-AV) to detect PS exposure on sickle RBCs was performed as described earlier.1 Green fluorescent protein–annexin V (GFP-AV), a kind gift of Joel Ernst (University of California, San Francisco) was used as an alternative to FITC-AV with the benefit of a higher specific fluorescence. Recombinant AV isolated by phospholipid-affinity chromatography was biotinylated by means of the FluoReporter protein-labeling kit (Molecular Probes, Eugene, OR) to obtain biotin-AV. Labeling with either AV conjugate at 30 to 40 ng/mL was routinely performed at 2 × 10⁶ to 5 × 10⁶ cells/mL (0.016% to 0.04% hematocrit) in Hepes-buffered saline (HBS) (10 mM Hepes and 145 mM NaCl, pH 7.4) containing 2 mM CaCl2. Biotin-AV–labeled cells were visualized with R-phycoerythrein–conjugated streptavidin (PE-SA) at a final concentration of 2 μg/mL under the same conditions. Data acquisition was performed on a Becton Dickinson FACScan and analysis was done with CellQuest software (Becton Dickinson, San Jose, CA).
Density distribution of PS-exposing RBCs
Stractan (arabinogalactan; Larex, St Paul, MN) was dissolved to 35% (350 g/L) in phosphate-buffered saline (PBS) (10 mM sodium phosphate, pH 7.4, 138 mM NaCl, and 2.7 mM KCl) containing 11 mM glucose, and adjusted to the desired densities with this buffer. RBCs were layered on discontinuous Stractran gradients of 17% to 29%, corresponding to densities of 1.070 to 1.124 g/mL, and spun at 35 000g for 45 minutes at 4°C. The isolated cell fractions were washed 3 times in PBS to remove Stractan. RBCs from the Stractan separation were labeled with FITC-AV and analyzed by flow cytometry to detect PS exposure as described above.
Fluorescence microscopy
The lowest-density (less than 1.082 g/mL) and highest-density (greater than 1.12 g/mL) fractions of sickle RBCs were isolated as described above and labeled with FITC-AV followed by fixation in 2% formaldehyde. Cells were examined either in bright field or by epifluorescence to visualize FITC labeling by means of a Zeiss Axiovert 135 inverted microscope (Thornwood, NY) equipped with a 63 × 1.3 Neofluor oil immersion lens, a quantitative image-processing system based on the Microimager 1400 digital camera (Xillix Technologies, Vancouver, BC, Canada), and the Scil-image analysis software package (University of Amsterdam, The Netherlands).
Characterization of the very light fraction
To characterize the PS-exposing cells in the very light fraction, sickle RBCs were separated on arabinogalactan, followed by dual-color labeling with fluorescent probes and analysis by flow cytometry as described below.
Isotonic high K+-Larex with a density of 1.082 g/mL was prepared according to the company's instructions by diluting 2.158 vol Cellsep Universal solution (arabinogalactan, Larex) with 1 vol high K+-reticulocyte diluent (Larex). Then, 1 vol RBC suspension (50% hematocrit in K-buffer) was layered on 2.5 volumes of this Larex suspension and centrifuged at 30 000g for 30 minutes at 4°C. The very light cell fraction on top of this gradient was washed 3 times in K-buffer to remove Larex. The isolated RBCs were labeled either with a combination of AV and thiazole orange to detect PS exposure in the total reticulocyte fraction or with a combination of AV and anti–transferrin receptor antibody to detect PS exposure in the fraction of very young reticulocytes. Monoclonal mouse antibody against the human transferrin receptor (CD71) was obtained from AMAC/Immunotech (Westbrook, ME) and used at 3 μL/mL with 2 × 10⁶ to 5 × 10⁶ cells/mL in HBS containing 2 mM CaCl2, followed by suspension of the cell pellet to 1 × 10⁸ to 2.5 × 10⁸ cells/mL in R-phycoerythrin–conjugated goat anti–mouse immunoglobulin G (IgG) (Jackson ImmunoResearch, West Grove, PA) at 100-fold dilution in the same buffer. This labeling was controlled with nonspecific mouse IgG, which did not result in significant fluorescence. GFP-AV was used in combination with this label to allow dual-color flow cytometry. Thiazole orange (Aldrich, Milwaukee, WI) was used to detect RNA-containing RBCs. After reconstitution at 1 mg/mL in methanol, a stock was prepared in HBS containing 0.02% sodium azide. The reagent was used at 60 ng/mL thiazole orange in HBS containing 2 mM CaCl2, in which the RBCs were resuspended at 2 × 10⁶ to 5 × 10⁶ cells/mL after labeling with biotin-AV and PE-SA; this was followed by analysis between 30 and 60 minutes after application by flow cytometry. Data evaluation was done for the population gated for intact RBCs, with care taken to exclude the white blood cell fraction.
Valinomycin-resistant RBCs
Isolation of a small fraction of light sickle RBCs, previously shown to have high Na+ and low K+ content, followed the procedures used in their original description,20 with minor modifications. The very light RBC fraction (density lower than 1.082 g/mL), prepared in K-buffer as described above, was resuspended at 5% hematocrit in V-buffer (15 mM KCl, 125 mM NaCl, 20 mM Hepes, 0.2 mM MgCl2, and 0.05 mM EGTA, pH 7.4) and incubated for 30 minutes with 10 μM valinomycin (Sigma) at 37°C. Under these conditions of K+-permeabilization with valinomycin, RBCs with relatively normal high-K+ content lose KCl and water, dehydrate, and can be isolated by subsequent density fractionation. The RBCs were pelleted, resuspended at 50% hematocrit, and immediately layered on 0.5 mL isotonic low-K+ Larex solution (15 mM KCl) with a density of 1.082 g/mL, which was prepared with 2.158 vol Cellsep Universal solution and 1 vol 3-fold concentrated buffer V. The gradient was spun at 30 000g for 30 minutes at 4°C, and the top and bottom fractions were isolated and washed to remove Larex. Dual-color labeling was subsequently performed with biotin-AV/PE-SA and thiazole orange as described above.
Flipase determination
Flipase activity was assessed by the extent of fluorescent phospholipids retained in the plasma membrane after back-extraction with bovine serum albumin (BSA), which extracts only these exogenously added fluorescent phospholipids and not endogenous phospholipids from the outer monolayer.21 When the flipase is active, PS is transported to the inner monolayer and cannot be back-extracted. RBCs prelabeled with biotin-AV and PE-SA were resuspended at 0.4% hematocrit in F-buffer (10 mM Hepes, 120 mM NaCl, 5 mM KCl, 1 mM MgSO4, 2 mM CaCl2, 10 mM glucose, 10 mM inosine, 10 mM adenosine, 10 mM pyruvate, pH 7.4). We added 1-palmitoyl-2-(6-[(7-nitro-2-1,3-benzoxadiazol-4-yl)amino]caproyl)phospho-L-serine (NBD-PS) from a stock in ethanol to a final concentration of 87 nM, corresponding to 0.5% of the total phospholipid in the RBC membrane. After 1-hour incubation at room temperature, 100 μL of this suspension was added to 30 μL 10% BSA in HBS and back-extracted for 2 minutes, followed by centrifugation and resuspension of the pellet in 500 μL HBS containing 2 mM CaCl2. To quantify the total incorporation of NBD-phospholipid, 100 μL of the incubation suspension without BSA addition was spun and the pellet resuspended in 500 μL HBS with CaCl2. The extent of fluorescence in the individual RBCs was detected by flow cytometry. In some control experiments, the flipase was inhibited by treatment of the RBCs with 10 mM n-ethylmaleimide (NEM) for 30 minutes at 37°C as described before.22 PS-exposing cells were created by incubating NEM-pretreated cells with 1 μM calcium ionophore A23187 and 1 mM CaCl2, followed by removal of Ca++ and ionophore as described before.22 To measure the NBD-PS translocation during calcium-induced scrambling, RBCs at 0.4% hematocrit were incubated with NBD-PS, as described above, in the presence of 0.4 μM calcium ionophore A23187 and 2 mM CaCl2, which resembled the conditions described above and led to a similar population of PS-exposing cells (data not shown).
Detection of intracellular Ca++
The presence of cells with increased intracellular Ca++ was assessed by means of the commonly used fluorescent probe Fluo3-AM and flow cytometry. Although Fluo3 fluorescence is observed with other cations, as described earlier, it has the highest response with Ca++.23 Fluo3 was used in combination with AV labeling to test the correlation between increased levels of intracellular Ca++ and PS exposure. Briefly, cells (0.4% hematocrit) were loaded with 1 μM Fluo3-AM for 1 hour at 37°C in C-buffer (10 mM Hepes, 70 mM NaCl, 80 mM KCl, 0.15 mM MgCl2, 0.1 mM EGTA, 10 mM inosine, and 5 mM pyruvate, pH 7.4). After washing, the cells were labeled with biotin-AV/PE-SA as described above. To indicate the Fluo3 fluorescence intensity of RBCs with high intracellular Ca++, RBCs were loaded with Ca++ by treatment with the calcium ionophore A23187 (0.2 μM) at 0.1% hematocrit in the presence of 1 or 2 mM CaCl2.
Results
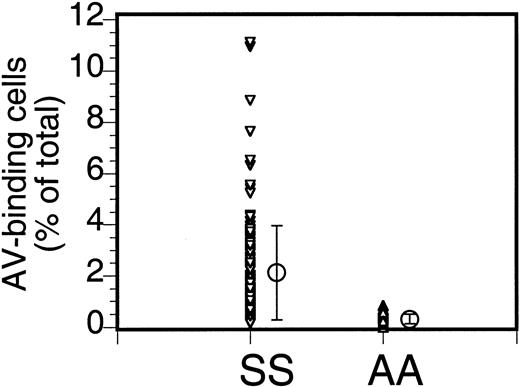
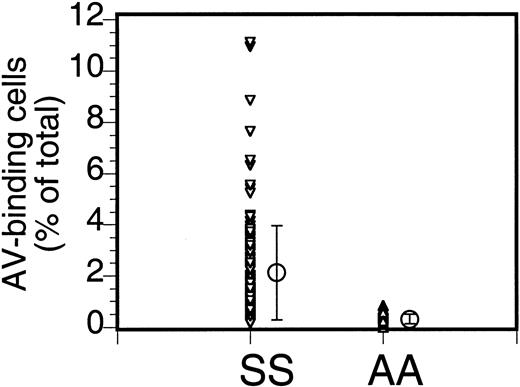
The percentage of PS-exposing cells in sickle cell anemia can vary widely. Our data (Figure 1) from 110 patients (147 samples; multiple data for the same patient were averaged) indicate an average of 2.1% ± 1.8% PS-exposing cells (mean ± SD; range, 0.1% to 11.1%). Multiple analyses of blood from the same patient taken at different times could vary widely (from 0.9% to 4.4%), as indicated before,2 and the cause of this variability is not known.
Annexin labeling of sickle cells.
Sickle cells (SS) or RBCs from healthy volunteers (AA) were labeled with FITC-AV and the percentage of labeled cells was assessed by flow cytometry. Each data point ((▵,▿) indicates the percentage of AV-binding cells obtained for each individual sample, and the mean (○) and SD (error bars) of 147 sickle cell samples from 110 donors and 18 normal controls are shown (repeat samples from the same donor taken at different times were averaged).
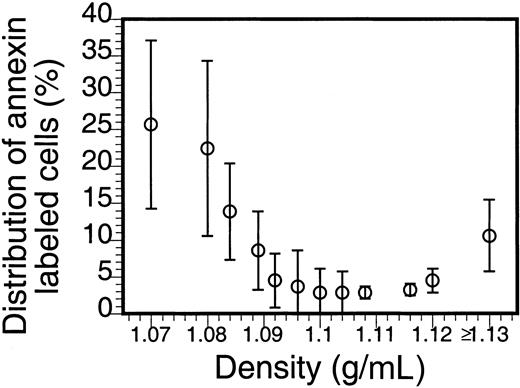
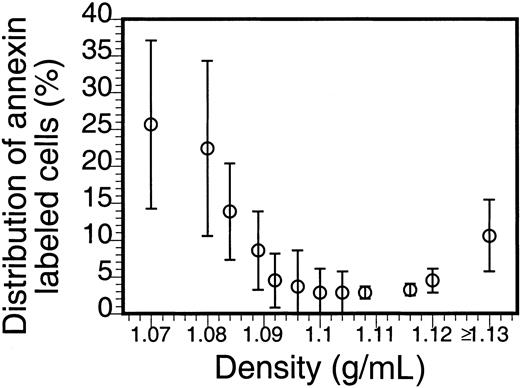
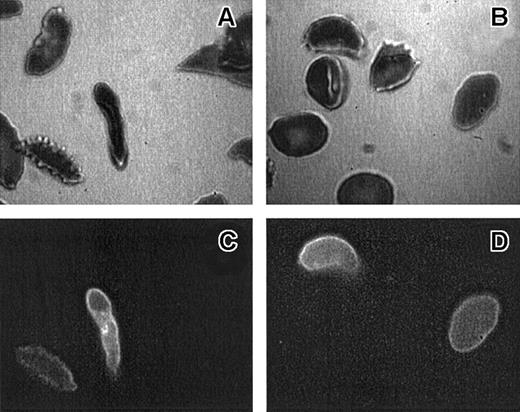
The density distribution of AV-binding sickle cells in Figure2 clearly shows an enrichment in the low- and high-density fractions. That the larger percentage of these PS-exposing cells is in the densest fraction suggests a correlation with the processes that lead to the formation of ISCs and other dense cells, yet the large percentage of the AV-binding cells found in the low-density fractions indicates that PS exposure in sickle RBCs is not directly correlated to their dehydration. Analysis by fluorescence microscopy (Figure 3) reveals that, although AV-binding ISCs are present, in the dense fraction not all ISCs bind AV (Figure 3A,C) and that similarly in the low-density fraction no correlation could be made between morphology and PS exposure (Figure 3B,D).
Density distribution of PS-exposing sickle cells.
Sickle cells were separated on Stractan density gradients, and FITC-AV labeling was assessed as described in “Materials and methods.” The number of AV-binding cells in each fraction, calculated by multiplying the percentage of AV-binding cells with the total number of cells in that fraction, is expressed as a percentage of the total AV-binding population. The graph shows the mean and SD of blood samples from 5 sickle cell patients.
Morphology of AV-binding sickle cells.
Bright-field (panels A, B) and epi-fluorescence (panels C, D) micrographs of the same RBCs from a high-density (1.13 g/mL or greater) (panels A, C) or low-density (less than 1.08 g/mL) (panels B, D) sickle cell population. ISCs are defined as cells that are elongated with length 2 or more × width.
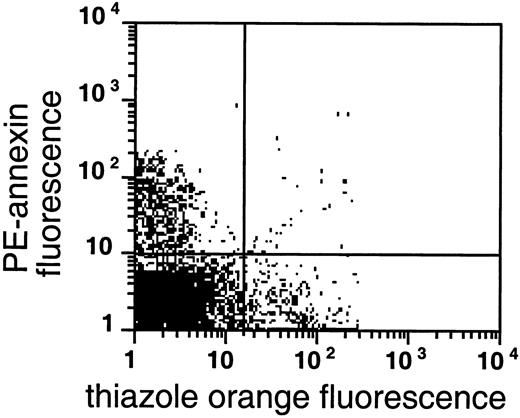
In normal RBC density profiles, cell age is correlated with density, with the youngest cells (reticulocytes) being the lightest. This density-age correlation does not apply as straightforwardly to sickle cells.15,24 25 Nevertheless, the fraction with a density lower than 1.082 g/mL is in most cases enriched in sickle reticulocytes. We investigated the presence of PS-exposing cells in this fraction using thiazole orange, a cell-permeant nucleotide stain routinely used for reticulocyte analysis, as a marker for RNA-containing cells and distinguished the youngest reticulocytes by the persistence of the transferrin receptor on their surface. The availability of different AV conjugates allowed us to combine either reticulocyte probe with the simultaneous determination of PS exposure.
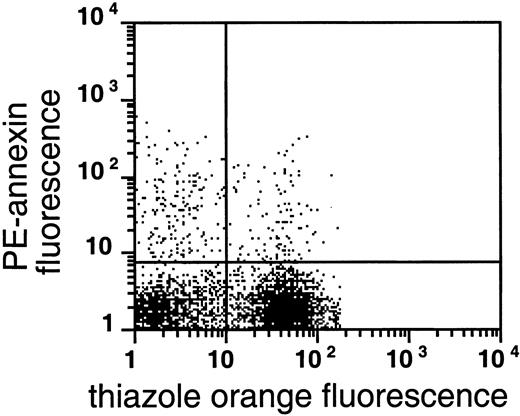
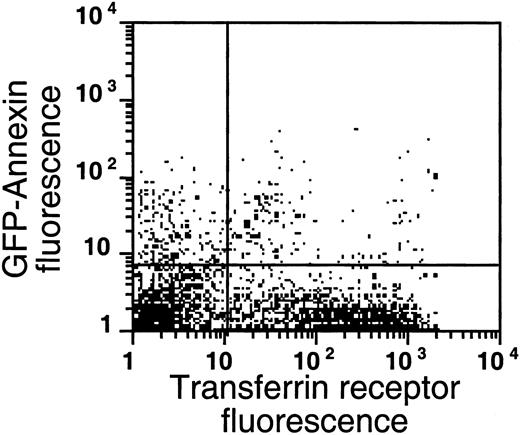
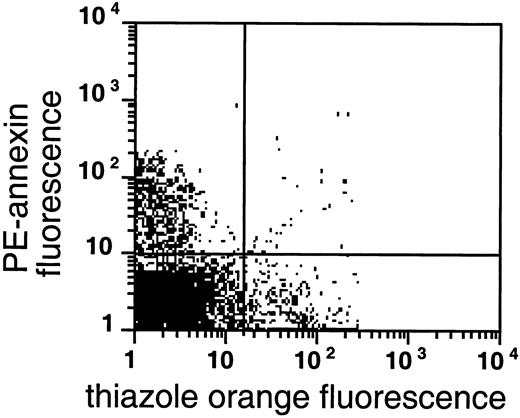
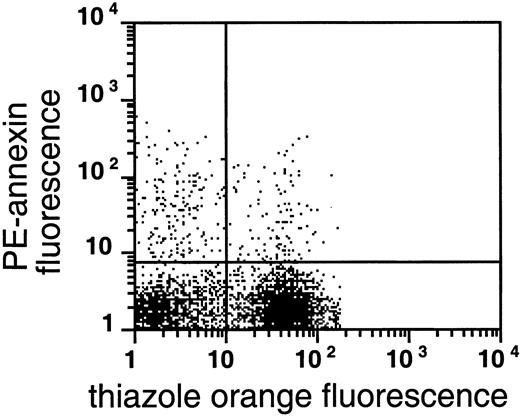
As shown in Figures 4 and5, AV binding was seen in a substantial subset of the reticulocytes, and the transferrin receptor–expressing reticulocytes were present in the very light fraction (density less than 1.082 g/mL). The reticulocyte content in the very light fraction ranged from 13% to 78%, with an average of 49% (n = 14), and the average enrichment of reticulocytes was 3.5-fold compared with the total RBC population. The transferrin receptor was identified in 21% to 74% of these light cells with an average of 57% (n = 4); this paralleled the percentage of total reticulocytes in these fractions, indicating that almost all sickle reticulocytes in this density fraction still carried the transferrin receptor. The percentage of AV-binding cells ranged from 1.4% to 17.5% in these very light fractions. On average, 54% ± 24% (n = 8) of the PS-exposing cells contained RNA and 62% ± 30% (n = 4) of these cells contained the transferrin receptor, as indicated by double-labeling with both AV and thiazole orange or transferrin receptor antibody. The data show that, as with mature sickle RBCs, a small but significant fraction (0.9% to 15%) of reticulocytes (containing RNA) or transferrin receptor–expressing cells (the youngest reticulocytes) expose PS.
PS exposure among reticulocytes.
Double labeling of sickle cells from the very light fraction (density less than 1.082 g/mL) with biotin-AV/PE-SA and thiazole orange indicate the presence of RNA in PS-exposing RBCs. Shown are the results with one typical specimen, which was comparable to 7 similar experiments.
PS exposure among transferrin receptor–expressing cells.
Sickle cells from the very light fraction (density less than 1.082 g/mL) were double-labeled with GFP-AV and PE-labeled anti–transferrin receptor antibody. Shown are the results with one typical specimen, which was comparable to 3 similar experiments.
On the other hand, our results also indicate that within the very light fraction relatively mature (non–RNA-containing) PS-exposing RBCs must be present to account for the rest of the AV-binding cells. A specific subset of low-density sickle cells (mostly nonreticulocytes) that was shown to have high Na+ and low K+ content was recently described. Therefore, these cells do not dehydrate (as do normal high-K+ RBCs) when they are permeabilized to K+ in low-K+ media with the ionophore valinomycin.20 These valinomycin-resistant RBCs were abnormally leaky to K+ (and presumably also to Na+) and sustained their abnormal Na-to-K ratios despite highly active Na/K pumps. To examine whether these sickle RBCs with abnormally functioning membranes might represent the nonreticulocyte, low-density RBCs that exposed PS, the valinomycin-resistant fraction was isolated and analyzed for RNA content and AV-binding as indicated in Figure 6. The isolated fraction consisted of 95% ± 4% (n = 4) mature RBCs, defined as cells that do not label with thiazole orange, consistent with the initial description of these cells.20 The population contained 6.8% ± 4.7% cells that bound AV, indicating an average enrichment of 1.6-fold compared with the very light fraction of the same patient, and a 2.3- to 23-fold enrichment of AV-binding cells compared with the entire RBC population of the same patient. Valinomycin treatment alone, either in high- or low-K+ buffer, did not alter the PS exposure in control cells (data not shown). These data show that the valinomycin-resistant cell fraction is enriched in cells that expose PS. Taking the data together, we were unable to find a sickle RBC population with a specific density that contained exclusively PS-exposing cells, and we detected reticulocytes as well as mature RBCs that exposed PS on their surface.
PS exposure in the valinomycin-resistant fraction of light sickle RBCs.
Double labeling of valinomycin-resistant sickle cells with biotin-AV/PE-SA and with thiazole orange as an RNA stain. These results with one sample were typical of 4 similar experiments.
PS exposure in the valinomycin-resistant fraction of light sickle RBCs.
Double labeling of valinomycin-resistant sickle cells with biotin-AV/PE-SA and with thiazole orange as an RNA stain. These results with one sample were typical of 4 similar experiments.
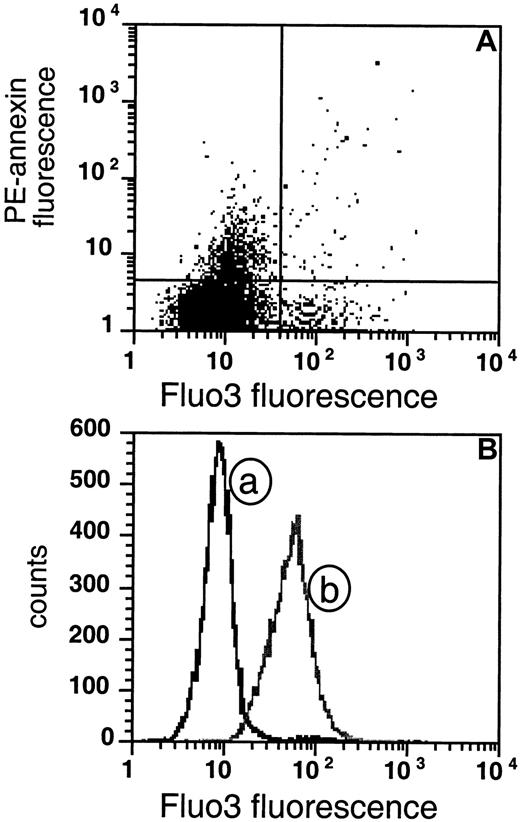
Elevation of intracellular Ca++ is thought to initiate the scrambling of membrane phospholipids. We hypothesized that persistently high levels of intracellular Ca++ are a common denominator in the PS-exposing sickle cell fraction. Such high Ca++levels could occur only as experimental artifacts or with premorbid RBCs in the circulation that have equilibrated with external Ca++. We used the Ca++ marker Fluo3 to measure cytosolic Ca++ in the sickle cell population. This compound shows a positive response when Ca++ is elevated above approximately 1 μM.23,26 As a positive control, we used the calcium ionophore A23187 to load the RBCs with cytosolic Ca++. As in normal cells,23 we observed the expected increase in intracellular Ca++ in ionophore-treated sickle cells in the presence of 2-mM external CaCl2 as shown in Figure 7B. Also, after treatment with calcium ionophore A23187 in the presence of 1 mM CaCl2, sickle cells bound AV (data not shown), indicating that the Ca++ loading resulted in PS exposure as in normal cells.
PS-exposing cells do not show sustained high intracellular Ca++.
(A) The extent of AV fluorescence is compared with Fluo3 fluorescence in sickle RBCs. The cells were loaded with Fluo3-AM for 1 hour and subsequently labeled with biotin-AV and PE-SA (data are shown for 1 experiment that was typical of 5 similar experiments). (B) The distribution of the same sickle cells as in panel A is plotted as a function of Fluo3 fluorescence (curve a) and compared with the distribution of cells loaded in vitro with Ca++ by incubation with the calcium ionophore A23187 in presence of 2 mM CaCl2 (curve b).
We found that most sickle cell samples contain a fraction of cells (3.6% ± 1.0%, n = 6) that stain highly with Fluo3, indicating that those cells contain high intracellular Ca++ (Figure7A, right quadrants). However, when these procedures were done in the absence of extracellular Ca++, substantially fewer Fluo3-positive cells (1.2% ± 0.5%, n = 6) were found, supporting the likelihood that many of these high-Ca++ RBCs were generated during in vitro handling. Since the AV labeling requires the presence of 2 mM CaCl2, this experimental artifact cannot be avoided. On the other hand, the AV-binding (PS-exposing) fraction of the sickle cells did not coincide with this Ca++-loaded subset, as is evident from Figure 7A. The great majority of PS-exposing cells are low in Fluo3 fluorescence (upper left quadrant), and only a low number of PS-exposing sickle cells are high in Ca++(upper right quadrant). Comparing all our tested samples, we found that the mean fluorescence in the upper left quadrant (PS-exposing) was not significantly different from that in the lower left quadrant (PS- negative), although on occasion (as in Figure 7A), an apparent slight increase in Fluo3 fluorescence, within the range of the negative population, seemed to occur. Similar results were obtained with the very light cell fraction (data not shown). These results indicate that the maintenance of PS exposure does not require sustained high levels of intracellular Ca++ (greater than 1 μM).
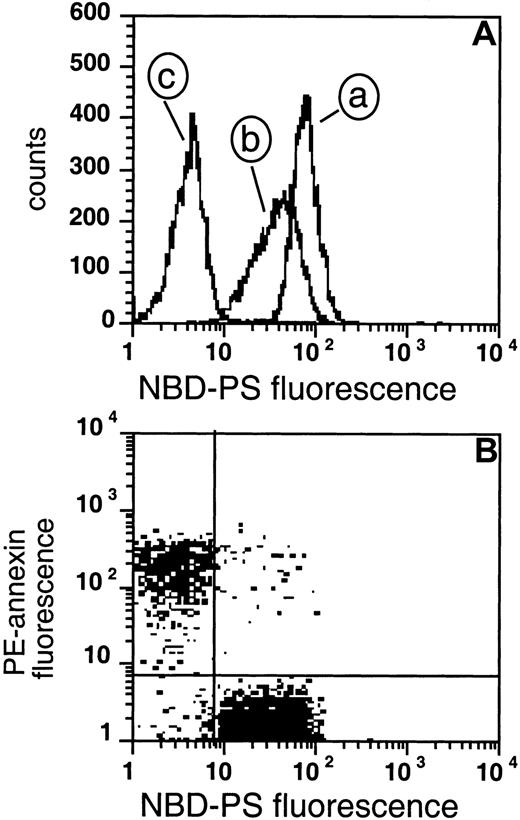
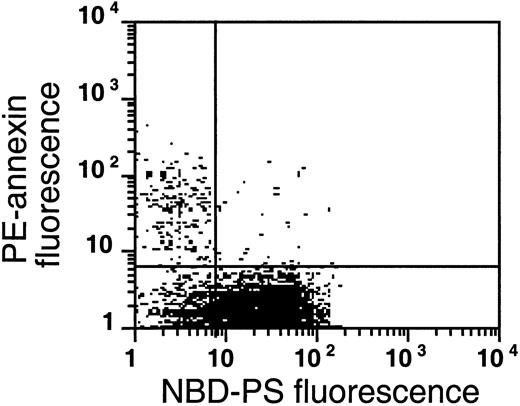
Another requirement for PS exposure in sickle cells is inhibition of the flipase because, even if the scramblase is activated, an active flipase would rapidly transport PS from the outer to inner monolayer. We therefore assessed the transbilayer movement of PS by measuring the redistribution of exogenously added NBD-labeled PS combined with labeling of endogenous PS with AV, as shown in Figure8. We employed back-extraction with BSA after a 1-hour incorporation of the NBD-PS analogue to obtain information on the steady-state localization of this fluorescent lipid across the bilayer. The remaining fluorescence after BSA extraction from the (nonextractable) amount of NBD-PS indicates the probe in the inner monolayer and possibly the cytosol, and reflects the balance between inward and outward translocation rates of the probe. Endogenous PS cannot be extracted by BSA and the annexin-based fluorescence reflects the presence of endogenous PS in the outer monolayer of the cell. Together, these 2 measurements reflect movement from the outer to the inner monolayer (NBD-PS) and from inner to outer monolayer (endogenous PS).
Measurement of flipase activity and PS exposure.
(A) The fluorescence of cells loaded with NBD-PS for 1 hour (curve a), followed by back-extraction with BSA (curve b), or NEM-treated RBCs loaded with NBD-PS followed by back-extraction (curve c). (B) Two cell populations were mixed prior to labeling: 20% of the cells were PS-exposing after NEM treatment and loading with Ca++followed by removal of ionophore and Ca++, and 80% were normal control RBCs. These cells were labeled with PE-SA/biotin-AV, and subsequently incubated with NBD-PS, followed by back-extraction with BSA.
Figure 8 shows the principle of this measurement in normal RBCs. Normal RBCs labeled with NBD-PS are fluorescent (8A, curve a), and extraction with BSA results in only a small loss of fluorescence (8A, curve b) since most of the NBD-PS has moved to the inner monolayer and cannot be extracted. Cells that are treated with NEM to inhibit the flipase and subsequently labeled with NBD-PS show a total fluorescence similar to cells not treated with NEM. Treatment with BSA, however, leads to a loss of more than 90% of fluorescence (curve c), indicating that PS did remain in the outer monolayer and was extracted. Ca++loading of RBCs has been suggested as inhibiting the flipase9 in addition to activating the scramblase. To exclude the possibility that sustained scrambling activity would cause the low NBD fluorescence found after back-extraction in the PS-exposing cells, we measured NBD-PS transport in normal RBCs during scramblase activation (in the presence of ionophore and 2 mM CaCl2). The fluorescence remaining in these cells after back-extraction was significantly higher than in cells treated with NEM (data not shown), indicating that while the flipase was inhibited, the bidirectional movement induced by the scramblase caused more PS to reside in the inner monolayer and remain inaccessible to back-extraction.
Figure 8B illustrates how 2 combined measurements, AV labeling and flipase measurement, can distinguish PS-exposing cells with an inactive flipase from cells with an active flipase and intact membrane asymmetry. Normal RBCs were mixed with NEM-treated, transiently Ca++-loaded RBCs in a ratio of 8:2. The mixture was subsequently labeled with AV, followed by NBD-PS labeling and extraction with BSA. The top left quadrant shows that 20% of the cells are labeled with annexin V, reflecting exposure of endogenous PS. This population shows a low NBD fluorescence, indicating that the flipase in these (NEM-treated) cells was not able to transport NBD-PS to the inner monolayer, rendering it extractable by BSA. In contrast, the lower right quadrant shows normal cells with high NBD fluorescence that were able to transport NBD-PS to the inner monolayer, nonextractable by BSA. The lack of annexin labeling in this population shows that endogenous PS is not exposed on the surface.
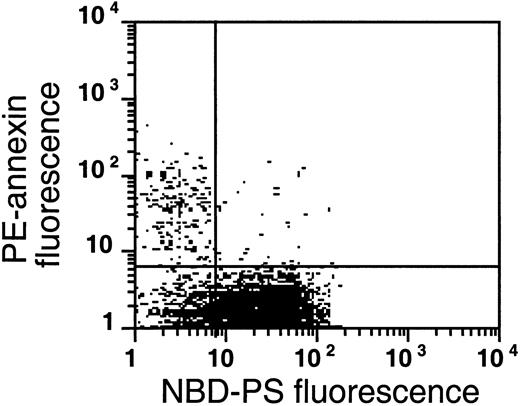
A similar analysis of sickle cells shows the presence of 3 populations (Figure 9). The low level of NBD-PS fluorescence retained in the AV-binding subpopulation of the left upper quadrant is comparable to that of NEM-treated cells, indicating that in these cells the flipase is inactive and that NBD-PS cannot be transported to the inner monolayer, hence this probe is available for BSA extraction. In this population, endogenous PS is exposed. Virtually all (80% ± 9%, n = 4) sickle cells that expose PS (ranging from 0.5% to 2.3% for these samples) show an inability to transport NBD-PS from the outer to the inner monolayer, similar to normal cells treated with NEM. This inability indicates that a loss of flipase activity is a common denominator in PS-exposing sickle cells. The second population, in the lower left quadrant, does not expose endogenous PS, but is not able to transport NBD-PS from the outer to the inner monolayer, which would make it available for BSA extraction. Most sickle cell samples show such a subpopulation, in which the flipase is inactivated but PS has not (yet) moved to the outer monolayer, suggesting that the scramblase was not activated after inhibition of the flipase. The third population (lower right quadrant) resembles the normal RBCs in Figure 8B. These cells were able to transport NBD-PS to the inner monolayer, rendering it nonextractable by BSA, and the absence of annexin labeling in this population shows that endogenous PS is not exposed on the surface of these cells.
The flipase is inactivated in the PS-exposing subpopulation of sickle cells.
This plot is a typical example of the analysis of flipase activity and PS exposure in sickle cells following the labeling procedure described in Figure 8B (this experiment was typical of 4 similar experiments). After PE-SA/biotin-AV labeling, sickle cells were incubated with NBD-PS for 1 hour and back-extracted with BSA.
Taken together, these data indicate that the flipase and scramblase activities are not necessarily linked. It may also be that the scramblase activity is not permanently enhanced in PS-exposing sickle cells, which is consistent with the absence of high levels of intracellular Ca++.
Discussion
Early reports that demonstrated a re-organization of the membrane phospholipids in sickle cell anemia indicated that this abnormality was found during deoxygenation,27,28 mainly on the spicules,29 and permanently in irreversible sickle cells.30 Those data were consistent with the presumption that repeated sickling in the vasculature resulted in this defect. The techniques used in those studies did not permit the detection of individual PS-exposing cells and lacked the sensitivity to determine the presence of PS-exposing cells in vivo. Recent techniques have allowed a more detailed examination of the state of cells that have lost phospholipid asymmetry in vivo. In particular, the use of AV has provided new evidence that PS exposure is limited to a subpopulation of sickle cells.1 2 Our present data on 147 samples show that the size of this population can vary widely among sickle cell patients, yet a detectable subset is found consistently.
PS exposure on RBCs is evident only after the flipase has been de-activated and the membrane phospholipids have been scrambled by an additional mechanism.10 At the onset of our investigations, we hypothesized that these conditions would be met in sickle cells that have undergone multiple cycles of sickling in the course of their life span, as reflected by their high density or irreversible sickle shape, in coherence with the earlier studies. We determined the density distribution of the PS-exposing subpopulation and discovered that these cells not only were found among the densest sickle cells, but were, unexpectedly, most numerous in the very light RBC fraction. Within this least dense population, we found subsets of reticulocytes, including the youngest transferrin receptor–expressing cells, as shown before,2 that exposed PS, as well as subsets of mature (non–RNA-staining) PS-exposing valinomycin-resistant cells. In addition, analysis by fluorescent microscopy demonstrated PS exposure in some but not all ISCs, as well as in sickle cells with a normal discocytic shape under oxygenating conditions. Our data show that PS-exposing cells are found in multiple subsets of sickle cells that vary with respect to density, RNA content, and shape, suggesting that factors other than multiple sickling events play a role in their generation.
It has been reported that the flipase activity is compromised in sickle cells, in particular during deoxygenation.21 However, the spin-labeled phospholipid analogues used in that study did not permit analysis of individual cells. The present study allowed single-cell analysis of the PS transbilayer movement in PS-exposing cells by means of NBD-labeled phospholipids and flow cytometry. We found that all PS-exposing sickle cells showed inactivation of the flipase (Figure 9). We determined earlier that many of these PS-exposing cells are reticulocytes. This implies that some RBCs lose flipase activity early on during their life span and could be predisposed for early removal from the circulation. On the other hand, cells were present in the sickle cell population in which the flipase was inactive while endogenous PS was not exposed. The fact that those cells, which were not able to transport PS from the outer to the inner monolayer, nevertheless did not transport endogenous PS from the inner to the outer monolayer indicates that separate processes govern the direction of their transbilayer movement. These data support the notion that the scrambling process has not been activated in all flipase-inactivated cells.
There is clear evidence for ion transport abnormalities in sickle RBCs, which include a sickling-induced cation permeabilization, resulting in transient increases in cytosolic Ca++.17 This, together with activation of KCl cotransport, primarily in the younger RBCs, results in dehydration of sickle RBCs and reticulocytes.24,25 In addition, as noted above, a small fraction of light sickle cells has recently been described that has low K+ and high Na+ contents and is therefore resistant to dehydration when K+-permeabilized by valinomycin in plasmalike low-K+ media.20There is some evidence that these valinomycin-resistant RBCs may be generated from dense sickle cells.20,31 The increased presence of PS-exposing cells in the valinomycin-resistant fraction suggests some common underlying factors in the generation of both types of membrane abnormalities. While the increased calcium influx during sickling clearly contributes to the formation of dense sickle cells,13,17 this relationship does not explain the formation of valinomycin-resistant cells.20
The Ca++-activated membrane phospholipid scrambling activity in RBCs11,12 that may be responsible for the PS exposure observed in sickle cells is mediated by a scramblase, which has a half-maximal activation in the range of 20 to 88 μM Ca++.32,33 The mean cytoplasmic Ca++ concentration in the total population of sickle RBCs was reported to be elevated from about 10 nM in oxygenated cells to about 30 nM in deoxygenated sickle cells.17 Our data (Figure 7) show that the intracellular Ca++ concentration is not permanently elevated beyond 1 μM (the concentration detectable above background by Fluo3) in individual PS-exposing sickle cells. Such high Ca++ levels could result from severe ATP depletion and/or severe membrane damage, leading to equilibration with plasma Ca++, increased calcium permeability, and extremely impaired function of the calcium pump, which could be found only in premorbid cells or as an experimental artifact. The observation that PS-exposing RBCs do not have a sustained high Ca++ level tends to exclude them from those categories and argues against the generation of these cells in vitro by experimental handling. In addition, it appears that Ca++-activated scrambling is not a continuous, ongoing process in the PS-exposing sickle cells, and the proposed relationship between the calcium influx and the formation of these cells must therefore remain tentative. However, it cannot be excluded that the scramblase undergoes temporary activation owing to transient high levels of Ca++ in some RBCs. It is also conceivable that higher, micromolar levels of Ca++ might occur as transient events immediately adjacent to regions of membrane calcium influx, thereby activating the scramblase. In cells with an active flipase, this would not lead to permanent PS exposure. In cells in which the flipase was inactivated, however, PS would remain in the outer monolayer even after the Ca++ had been pumped out and the scramblase was de-activated. Alternatively, if it is assumed that RBCs with an inactivated flipase are able to survive in the circulation for a number of days, it could be possible that passive transmembrane movement of PS from the inner to the outer monolayer is responsible for the observed PS exposure, eliminating the need for scramblase activation. Our data suggest that the flipase inactivation precedes the activation of scrambling and thus leads to a situation where PS exposure is persistent. The mechanism by which the flipase is inactivated is unknown, but might be related to the increased oxidation of membrane components in the sickle cells.9,22 34
In summary, we have shown that the sickle RBCs can expose PS at several stages during their life span. The PS-exposing subpopulation includes both sickle reticulocytes, as shown before,2 and more mature RBCs, and has the highest prevalence among the mature valinomycin-resistant RBCs. While our data do not show increased Ca++ in PS-exposing sickle cells, it cannot be excluded that in some RBCs, transient increases in intracellular Ca++ or local high concentrations adjacent to their membranes might lead to episodes of phospholipid scrambling. The only clear common denominator in the PS-exposing RBCs appears to be the de-activation of the flipase. Our data are consistent with the hypothesis that PS exposure is found in cells that have first lost flipase activity, followed by a reversible activation of the scramblase, possibly during a transient influx of calcium.
The authors thank Rachel Lewis and Mandy Hua for conducting preliminary experiments and Joel Ernst for the kind supply of GFP-AV.
Supported by grants HL20985, HL55213, HL28018, and M01 RR01271 from the National Institutes of Health.
The publication costs of this article were defrayed in part by page charge payment. Therefore, and solely to indicate this fact, this article is hereby marked “advertisement” in accordance with 18 U.S.C. section 1734.
References
Author notes
Kitty de Jong, Children's Hospital Oakland Research Institute, 5700 Martin Luther King Jr Way, Oakland, CA 94609;kdejong@chori.org.

