In this issue of Blood, Atiq et al present data to support the hypothesis that low von Willebrand factor (VWF) is an age-dependent evolution of type 1 von Willebrand disease (VWD) rather than its own discrete clinical entity.1
VWD is the most common inherited bleeding disorder. Diagnosis and accurate subtyping of VWD is complex because of a variety of factors, including physiological stress at the time blood samples are drawn, changes in the hormonal milieu due to menstruation or pregnancy, and other factors, such as specimen integrity and laboratory quality. VWD is classified as either quantitative (types 1 and 3) or qualitative (type 2) defects, with type 1 VWD representing the most common inherited form. Initial testing should include assessment of VWF antigen levels (VWF:Ag), platelet-dependent VWF activity (eg, VWF glycoprotein IbM), and factor VIII coagulant activity (FVIII:C).
In 2007, an expert consensus panel, convened by the US National Heart, Lung, and Blood Institute (NHLBI), defined type 1 VWD as plasma VWF levels <30 IU/dL, whereas levels of 30 to 50 IU/dL were categorized as low VWF, a risk factor for bleeding.2 Individuals with VWF levels <30 IU/dL are more likely to harbor pathogenic mutations in the VWF gene, and familial inheritance is strongest in this population as well. Although pathogenic VWF mutations are important in the pathophysiology of VWD, numerous modifier genes also determine plasma VWF levels and contribute to bleeding phenotype.3 Many patients who had been diagnosed as having type 1 VWD before the publication of the NHLBI guidelines suddenly found themselves labeled with a term that suggested they did not have a bleeding disorder, but yet were often managed in a similar manner to those carrying the diagnosis of VWD. This change in diagnostic criteria was not universally adopted globally, leading to differences in diagnosis and management in different centers and countries.
In 2021, a multidisciplinary panel, convened by the American Society of Hematology (ASH), the International Society on Thrombosis and Hemostasis (ISTH), the National Hemophilia Foundation (NHF; now National Bleeding Disorder Foundation), and the World Federation of Hemophilia (WFH), published evidence-based clinical practice guidelines on the diagnosis and management of VWD.4 The 2021 guidelines recommended that both patients with levels <30 IU/dL and those with VWF levels of 30 to 50 IU/dL along with a concurrent bleeding phenotype be diagnosed as having type 1 VWD. The guideline panel recommended this change to ensure access to care, recognizing that many patients with VWF levels between 30 and 50 IU/dL had significant bleeding that required active management, similar to those with much lower levels. The recommendation was supported by a systematic review and meta-analysis of the medical literature, including studies on mutation detection, likelihood ratios, correlation between VWF levels and bleeding scores, and bleeding tendency.5 The ASH ISTH NHF WFH diagnostic guideline panel recognized that recommendations on diagnostic thresholds for type 1 VWD would likely be the most controversial and, therefore, called for specific research on “patients with VWF levels between 0.30 and 0.60 IU/mL as well as the correlation with bleeding symptoms and information about family members of patients with type 1 VWD,”4(p291) leading to the current study by Atiq et al.
The authors combined data from 2 large cohort studies, the Low VWF Ireland Cohort (LoVIC) and the Willebrand in the Netherlands (WiN) studies, to understand whether low VWF (VWF levels of 30-50 IU/dL) represented a distinct clinical entity separate from type 1 VWD, or whether these were overlapping entities. Across the 2 cohort studies, 565 patients were included in the combined analysis. The authors observed an age-dependent increase in VWF levels over time in most of the patients in the 2 cohort studies. In a subgroup of WiN patients with type 1 VWD who had normalization of their VWF levels over time, there appeared to be clear overlap with the subjects in the LoVIC cohort, with a similar rate of increase in VWF levels each year. Further analysis showed that those classified as having low VWF in the LoVIC cohort would have been classified the same as those in the WiN study had they been diagnosed at the same age, suggesting that those characterized as having low VWF would have been diagnosed as having type 1 VWD had they been diagnosed earlier in life.
The authors then analyzed FVIII:C/VWF:Ag ratios to identify patients with reduced VWF synthesis or secretion, again showing no difference for low VWF in LoVIC compared with those with type 1 VWD in WiN, suggesting similar pathophysiology of type 1 VWD with normalized levels due to aging. In a subset of the WiN cohort in whom VWF remained <30 IU/dL over time, there were significantly increased FVIII:C/VWF:Ag and VWF propeptide/VWF:Ag ratios, suggesting a combination of reduction in VWF synthesis/secretion along with enhanced VWF clearance resulted in this subgroup's failure to normalize over time. An interesting aspect of the desmopressin testing across the cohorts was the fact that desmopressin responsiveness increased with aging. Many centers limit desmopressin use after the age of 60 or 70 years because of adverse events, particularly in those with coexistent cardiovascular disease. These data support the possibility of a clinical trial in older adults using a low-dose desmopressin approach, as well as exploring novel therapies other than desmopressin that may stimulate release of endogenous VWF from the vascular endothelium.
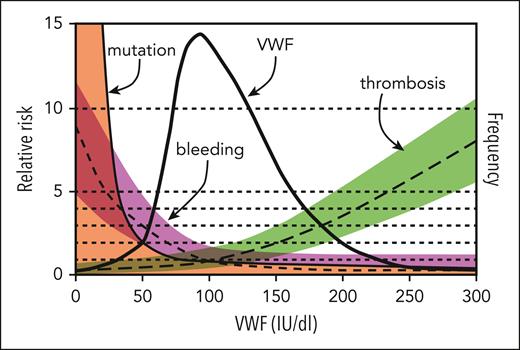
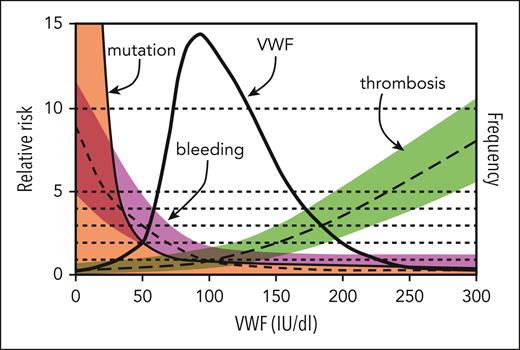
This study supports the idea that low VWF is not a distinct clinical entity but is instead a progressive physiological increase in VWF that occurs with normal aging. What remains to be seen is whether there is an evolution in bleeding symptoms that occurs in parallel to aging's physiological increase in VWF levels. A sentiment expressed by the late Dr J. Evan Sadler was that management decisions in VWD should be based on bleeding phenotype instead of a dichotomous threshold arbitrarily placed on a continuous variable (see figure).6 Given variability in the quality of laboratory testing and difficulty in accurately measuring VWF antigen and activity levels, VWD continues to be challenging to accurately diagnose and subtype; however, this study provides useful data to further refine diagnostic thresholds for type 1 VWD in the future.
Model for the relationship of VWF level to risk of bleeding, thrombosis, and VWF mutations. The thick solid line indicates the frequency distribution of VWF levels (IU/dL) for the population, and 95% of values lie between 50 and 200 IU/dL. Also shown are estimates of the relative risk of bleeding (short-dashed line, magenta shading), thrombosis (long-dashed line, green shading), and mutation within the VWF gene (thin solid line, orange shading) as a function of VWF level; the relative risk is defined as 1.0 at the population mean VWF level of 100 IU/dL. Although previous versions of this figure separated type 1 VWD as <20 to 30 IU/dL and low VWF as 30 to 50 IU/dL, data from the current study by Atiq et al suggest that individuals with levels 30% to 50% are a result of physiological aging. Modified from the review by Sadler.6
Model for the relationship of VWF level to risk of bleeding, thrombosis, and VWF mutations. The thick solid line indicates the frequency distribution of VWF levels (IU/dL) for the population, and 95% of values lie between 50 and 200 IU/dL. Also shown are estimates of the relative risk of bleeding (short-dashed line, magenta shading), thrombosis (long-dashed line, green shading), and mutation within the VWF gene (thin solid line, orange shading) as a function of VWF level; the relative risk is defined as 1.0 at the population mean VWF level of 100 IU/dL. Although previous versions of this figure separated type 1 VWD as <20 to 30 IU/dL and low VWF as 30 to 50 IU/dL, data from the current study by Atiq et al suggest that individuals with levels 30% to 50% are a result of physiological aging. Modified from the review by Sadler.6
Conflict-of-interest disclosure: N.T.C. reports serving as a consultant for Takeda; participating in advisory boards for Takeda, Genentech, Sanofi Genzyme, and Medzown; and receiving honoraria/travel support from OctaPharma AG.


