Key Points
Granulocyte activation and inflammatory cytokine signaling by interferon gamma and IL-6 drive TCL progression and disease symptoms.
Jak1/2 inhibitors simultaneously target malignant T cells and inflammatory granulocytes in ITK-SYK mice and human PTCL–derived xenografts.
Abstract
Peripheral T-cell lymphomas (PTCLs), especially angioimmunoblastic and follicular TCLs, have a dismal prognosis because of the lack of efficient therapies, and patients’ symptoms are often dominated by an inflammatory phenotype, including fever, night sweats, weight loss, and skin rash. In this study, we investigated the role of inflammatory granulocytes and activated cytokine signaling on T-cell follicular helper–type PTCL (TFH-PTCL) disease progression and symptoms. We showed that ITK-SYK–driven murine PTCLs and primary human TFH-PTCL xenografts both induced inflammation in mice, including murine neutrophil expansion and massive cytokine release. Granulocyte/lymphoma interactions were mediated by positive autoregulatory cytokine loops involving interferon gamma (CD4+ malignant T cells) and interleukin 6 (IL-6; activated granulocytes), ultimately inducing broad JAK activation (JAK1/2/3 and TYK2) in both cell types. Inflammatory granulocyte depletion via antibodies (Ly6G), genetic granulocyte depletion (LyzM-Cre/MCL1flox/flox), or IL-6 deletion within microenvironmental cells blocked inflammatory symptoms, reduced lymphoma infiltration, and enhanced mouse survival. Furthermore, unselective JAK inhibitors (ruxolitinib) inhibited both TCL progression and granulocyte activation in various PTCL mouse models. Our results support the important role of granulocyte-driven inflammation, cytokine-induced granulocyte/CD4+ TCL interactions, and an intact JAK/STAT signaling pathway for TFH-PTCL development and also support broad JAK inhibition as an effective treatment strategy in early disease stages.
Introduction
T-cell lymphomas (TCLs) are a heterogeneous group of malignancies arising from the mature T-cell compartment with a dismal prognosis because of the lack of specific therapies and resistance to classical chemotherapies.1-5 T-cell follicular helper–type peripheral TCLs (TFH-PTCLs) include 3 subtypes: angioimmunoblastic T-cell lymphomas (AITLs), follicular TCL (FTCLs), and nodal PTCLs with TFH phenotype (NOS type, which are usually not specific). In initial disease stages, patients with PTCL often present with nonspecific symptoms, such as fever, night sweat, weight loss, and skin rash, corresponding to an adverse prognostic inflammatory phenotype, which includes relative or absolute granulocytosis and lymphopenia.6-9 Identification of the malignant T-cell clone and classification is often difficult because of the low quantity of the malignant T cells within the bone marrow (BM) and lymph nodes, whereas nonmalignant inflammatory cells are largely overrepresented.
The fusion of the interleukin 2 (IL-2)-inducible T-cell kinase and the spleen tyrosine kinase (ITK-SYK) was discovered in a subset of TFH-PTCLs and is associated with the follicular TCL subtype.10,11 ITK-SYK activates T-cell receptor (TCR) signaling, and its overexpression in murine hematopoietic stem cells or T cells induces a lethal murine PTCL with spleen, lung, and skin infiltrates.12,13 ITK-SYK mice also develop a systemic inflammation with granulocytosis, lymphopenia, and inflammatory cytokines, such as IL-5, IL-6, and interferon gamma (IFN-γ), thus resembling the human disease.12-14
JAK/STAT signaling plays an important role in physiological T-cell immunity, and its activation by various extracellular stimuli leads to the differentiation of CD4+ T cells into multiple T-cell subtypes, such as T helper 1 (Th1), Th2, and Th17 or regulatory T cells (Treg).15-18 Aberrant activation of this signaling pathway was detected in most forms of TCL,19 such as anaplastic large cell lymphoma,20-22 AITL,14,23 human T-lymphotropic virus 1–associated adult T-cell leukemia/lymphoma, and PTCL-NOS.24 The overactivation is either caused by mutations within the JAK/STAT pathway itself or by cross-signaling induced by kinase fusions, such as nucleophosmin-anaplastic lymphoma kinase (NPM-ALK) in anaplastic large cell lymphoma.25,26 In addition, ITK-SYK partially exerts its oncogenic function via aberrant JAK/STAT signaling, including the activation of STAT3 and JAK3/STAT5 within the malignant T cells.27,28
In myeloid cells, constitutive JAK/STAT signaling via mutations such as JAK2 V617F is a major driver of myeloproliferative syndromes and causes a chronic inflammatory disease along with granulocyte expansion (myelofibrosis and polycythemia vera), granulocyte activation, and inflammatory cytokine signaling.29-32 Furthermore, granulocyte activation is strongly involved in graft-versus-host disease and can be successfully blocked by the use of JAK1/2 inhibitors, such as ruxolitinib.33,34
In our study, we investigated the role of activated granulocytes and inflammatory cytokine signaling on TFH-PTCL development and disease symptoms. We identified positive feedback loops in between granulocytes and CD4+ malignant T cells via IFN-γ and IL-6, and showed that the JAK1/2 inhibitor ruxolitinib, in contrast to the JAK2 inhibitor pacritinib, blocks both TCL expansion in and emigration from lymphoid organs, such as the thymus, into the skin and inhibits the inflammatory disease phenotype, including granulocytosis. Granulocyte depletion itself or IL-6 deletion within microenvironmental cells has similar effects, supporting its proinflammatory role in TCL development. Results could be recapitulated in mouse models with primary human AITL/follicular TCL and PTCL-NOS xenografts, thus supporting ruxolitinib treatment as an interesting therapeutic strategy to simultaneously block T-cell lymphoma growth and inflammation, especially in early disease stages.
Methods
ITK-SYK animal experiments
ITK-SYK TCL mice were generated as previously described.13,14 BALB/c donor males were injected with 5-fluorouracil (150 mg/kg) intraperitoneally (IP), and BM cells were harvested 4 days later. Erythrocytes were lysed with Grey solution, and the BM cells were cultivated in Dulbecco modified Eagle medium containing 10% fetal bovine serum, stem cell factor, IL-6, and IL-3. Virus production using a murine stem cell virus (MSCV)/internal ribosome entry site/green fluorescent protein (GFP) (pMIG) vector35 and pMSCV/ITK-SYK construct, BM cell transduction, recipient irradiation, transplantation (5 × 10⁵ cells per mouse), and infection efficacy assessment were performed as previously described.14 Disease development was monitored with weekly weight measurements, phenotypic score assessment (weight, tail inflammation/necrosis, ear inflammation/necrosis, and skin infiltrates; supplemental Table 1, available on the Blood website), blood cell counts (scil Vet abc Plus), and peripheral blood (PB) cell flow cytometry: T cells (CD90.2+, CD4+/−, and CD8+/−CD7+/–), B cells (B220), granulocytes (CD11b+/Ly6G+ or Gr1+/F4/80−), macrophages (Gr1−/F4/80+), and monocytes (CD11b+/Gr1−). At defined time points, mice were euthanized for organ analysis (organ weight measurements, flow cytometry, and histology) and serum cytokine analysis.
For short-term neutropenia, ITK-SYK mice were injected IP twice with Ly6G (clone 1A8; 250 μg per mouse) or immunoglobulin G control antibody (BioLegend). For long-term neutropenia, we generated LyzMCre/Cre Mcl1flox/flox mice (B6;129-Mcl1tm35jk/J, Jackson Laboratory; and B6.129P2-Lyz2tm1(cre)ifo/J mice;36 the genotyping protocol is given in the supplemental Methods). IL-6 knockout mice (IL6tm1Kopf) were purchased from The Jackson Laboratory.37
Ruxolitinib (30 mg/kg; in polyethylenglycol 300 and 5% dextrose [1:3]) or pacritinib (150 mg/kg) and vehicle controls were administered twice daily via oral gavage.
For retransplantation experiments, 4 different CD90+ T-cell subsets (CD4+, CD8+, CD4+CD8+, and CD4−CD8−) were sorted from the spleens or thymi of ITK-SYK diseased animals, mixed with 1 × 10⁶ wild-type (WT) support BM, and transplanted into lethally irradiated BALB/c mice.
Animal experiments were approved by the Regierungspräsidium Freiburg (G-15/085) and were in accordance with international standards for humane care and use of laboratory animals. Detailed protocols for cell culture, flow cytometry using antibodies, cytokine arrays, immunohistochemistry, and immunoblotting are depicted in supplemental Methods and supplemental Table 2.
Xenografts derived from patients with TCL
This study was approved by the institutional review board of the University Medical Center Freiburg and the University Hospital Halle, and patient samples were obtained after informed consent, per the Declaration of Helsinki. PB and serum samples for cytokine detection were obtained from patients with treatment-naive PTCL-NOS and TFH-PTCL with circulating lymphoma cells (patient list is given in supplemental Table 3). Pathology results from the original patients were presented to the reviewers. Sequencing of lymphoma samples (formalin fixed paraffin-embedded lymph nodes) was performed using an Illumina TruSight Comprehensive Cancer Panel and a TruSight RNA Fusion Panel, per the manufacturer’s instructions. PB cells (between 6 × 10⁶ and 1 × 10⁷) were purified using Ficoll gradient, after which each TCL was injected IP and intravenously into a single NOG mouse. Engraftment was assessed via flow cytometry, and the clonal TCR via spectra typing (supplemental Methods). Engrafted huCD4+CD7low T cells in the spleen were harvested, retransplanted into 2 NOG mice (transplantation 2), and then expanded by transplanting ∼27 × 106 to 35 × 106 human CD45+ cells into 8 or 9 NOG mice (transplantation 3). Ruxolitinib or vehicle treatments (n = 4-5 per group) started 14 days after transplantation.
Reverse transcription, quantitative PCR (TaqMan/Sybr Green), and gene arrays
Total cellular RNA was extracted from sorted malignant T cells (CD3+ GFP+) and nonmalignant granulocytes (CD11b+ Ly6G+ GFP−) of the spleens of ITK-SYK+ mice (QIAGEN RNeasy mini kit). Complementary DNA was synthesized, followed by TaqMan polymerase chain reaction (PCR; primers are listed in supplemental Table 4), and target gene quantification (ΔΔ-CT method for β-actin). Transcriptome analysis was performed using the Clariom S Pico assay for mouse (Thermo Fisher Scientific).
Statistical analysis
Data are represented as the mean ± standard error of the mean. For statistical comparisons between groups, a 2-tailed Student t test or a Mann-Whitney test was performed. P < .05 was considered statistically significant: ∗P < .05; ∗∗P < .01; and ∗∗∗P < .001. Correlations were assessed with the Spearman rank correlation coefficient. Analyses were performed using GraphPad Prism version 5.03.
Supplemental Methods include cell culture conditions, flow cytometry, cytokine arrays, genotyping protocols, and TCR sequencing protocols.
Results
The CD4+ ITK-SYK+ lymphoma subpopulation induces a retransplantable PTCL and drives inflammation including granulocyte expansion
The ITK-SYK BMT mouse model resembles human follicular TCL and also phenocopies the systemic inflammation present in many patients with PTCL.13 BALB/c BM cells were transduced with the fusion oncogene ITK-SYK (Figure 1A) and subsequently transplanted into lethally irradiated recipient mice. Within 7 weeks, the mice developed a murine PTCL with infiltration of ITK-SYK+/CD3+ malignant T cells into the central zones of the lymphoid follicles in the spleen (Figure 1B), lymph nodes, BM, lung, and skin, which results in the destruction of adipose tissues and necrosis of ears and tail skin.13,14 ITK-SYK mice also developed a systemic inflammation with granulocytosis in the PB, spleen, BM (Figure 1C-D), lungs, intestines, and other organs. Granulocyte expansion occurred independently of the ITK-SYK status of the expanding myeloid cells, which implies that T-cell lymphoma–derived cytokines drive the myeloid expansion (Figure 1D). In contrast, the ITK-SYK oncogene accumulated within the CD3+ T-cell population, which consisted of >80% CD4+ T cells but also contained CD8+, CD4+CD8+, and CD4−CD8− ITK-SYK+ T cells (Figure 1E). Retransplantation of the 4 sorted ITK-SYK+ T-cell subpopulations (CD4+, CD8+, CD4+CD8+, and CD4−CD8−) into secondary recipients demonstrated that only CD4+ ITK-SYK+ T cells induced a reproducible murine PTCL (retransplantation of CD4+ ITK-SYK+ spleen cells: 100% PTCL penetrance; and CD4+ ITK-SYK+ thymus cells: 56% penetrance; Figure 1F-G) and completely copied the original phenotype including inflammatory symptoms and granulocytosis (Figure 1H-L). Our experiments therefore identify CD4+ ITK-SYK+ T cells as the source for the retransplantable stem cell population and the driver of inflammation.
CD4+ malignant T cells contain the leukemic stem cell population in murine ITK-SYK+ PTCLs and drive an inflammatory phenotype including granulocyte expansion. (A) Schematic representation of ITK-SYK. blue, kinase domain. (B) Representative images of CD3-stained spleens of GFP control vs ITK-SYK+ mice. (C) Percentage of CD11b+Ly6G+ granulocytes within GFP+ or GFP− PB cells, the spleen, or BM cells of control BALB/c mice that received a transplantation with BM transduced with empty pMIG-vector (GFP mice; left) or with pMIG/ITK-SYK-vector (ITK-SYK mice; right) (n = 5 per group). Blood samples were taken on day 43 after transplantation and analyzed via flow cytometry (fluorescence-activated cell sorting [FACS]). (D) Representative images for CD11b staining showing granulocytes/macrophages within the BM of control mice and ITK-SYK+ mice. (E) Representative gating strategy for ITK-SYK+ malignant T-cell subtypes before sorting and secondary transplantation (day 43 after transplantation): GFP+ cells represent ITK-SYK–expressing cells, followed by CD3+ gating, and then distribution into CD4+, CD8+, CD4+CD8+, and CD4−CD8− cells. (F,G) Overall survival (OS) of lethally irradiated BALB/c mice that received transplantation with thymic or splenic ITK-SYK/GFP+ T-cell subsets (CD4+, CD8+, CD4+CD8+, or CD4−CD8− T cells) mixed with 1 × 10⁶ untreated BALB/c BM support cells. Thymic T cells transplanted were between 4000 and 15 000 per mouse (CD4+, n = 9; CD8+, n = 7; CD4+CD8+, n = 2; CD4−CD8−, n = 2) and spleen T cells were between 20 000 and 50 000 per mouse (CD4+, n = 4; CD8+, n = 9; CD4+CD8+, n = 2; CD4−CD8−, n = 5). Engraftment of ITK-SYK–expressing CD4+ and CD8+ T cells was independent of the number of transplanted cells, and the OS was monitored for 12 months. Lines representing thymic CD8+ and CD4+CD8+ T cells are hidden behind the line representing thymic CD4−CD8− cells. (H) Representative images of tails and ears of mice that received retransplantation with ITK-SYK+ CD4+ cells from the thymus or spleen. (I-L) Comparative analysis of mice that either received transplantation with control BM only (gray bar, n = 5) or combined with sorted ITK-SYK+ CD4+ T cells from the thymus (n = 5) or spleen (n = 4) of ITK-SYK+ mice (red bars). (I) Comparison of phenotypic score (supplemental Table 1) using weight loss, and tail, ear, and skin infiltration as indicators for TCL manifestation and inflammation. Comparison of (J) spleen weight, (K) percentage of lymphocytes in the PB, and (L) percentage of granulocytes in the PB at the time of death or after 12 months at termination of the experiment. n.d, not detected; PH, pleckstrin-homology domain; ReTx, retransplantation; TH, Tec-homology domain.
CD4+ malignant T cells contain the leukemic stem cell population in murine ITK-SYK+ PTCLs and drive an inflammatory phenotype including granulocyte expansion. (A) Schematic representation of ITK-SYK. blue, kinase domain. (B) Representative images of CD3-stained spleens of GFP control vs ITK-SYK+ mice. (C) Percentage of CD11b+Ly6G+ granulocytes within GFP+ or GFP− PB cells, the spleen, or BM cells of control BALB/c mice that received a transplantation with BM transduced with empty pMIG-vector (GFP mice; left) or with pMIG/ITK-SYK-vector (ITK-SYK mice; right) (n = 5 per group). Blood samples were taken on day 43 after transplantation and analyzed via flow cytometry (fluorescence-activated cell sorting [FACS]). (D) Representative images for CD11b staining showing granulocytes/macrophages within the BM of control mice and ITK-SYK+ mice. (E) Representative gating strategy for ITK-SYK+ malignant T-cell subtypes before sorting and secondary transplantation (day 43 after transplantation): GFP+ cells represent ITK-SYK–expressing cells, followed by CD3+ gating, and then distribution into CD4+, CD8+, CD4+CD8+, and CD4−CD8− cells. (F,G) Overall survival (OS) of lethally irradiated BALB/c mice that received transplantation with thymic or splenic ITK-SYK/GFP+ T-cell subsets (CD4+, CD8+, CD4+CD8+, or CD4−CD8− T cells) mixed with 1 × 10⁶ untreated BALB/c BM support cells. Thymic T cells transplanted were between 4000 and 15 000 per mouse (CD4+, n = 9; CD8+, n = 7; CD4+CD8+, n = 2; CD4−CD8−, n = 2) and spleen T cells were between 20 000 and 50 000 per mouse (CD4+, n = 4; CD8+, n = 9; CD4+CD8+, n = 2; CD4−CD8−, n = 5). Engraftment of ITK-SYK–expressing CD4+ and CD8+ T cells was independent of the number of transplanted cells, and the OS was monitored for 12 months. Lines representing thymic CD8+ and CD4+CD8+ T cells are hidden behind the line representing thymic CD4−CD8− cells. (H) Representative images of tails and ears of mice that received retransplantation with ITK-SYK+ CD4+ cells from the thymus or spleen. (I-L) Comparative analysis of mice that either received transplantation with control BM only (gray bar, n = 5) or combined with sorted ITK-SYK+ CD4+ T cells from the thymus (n = 5) or spleen (n = 4) of ITK-SYK+ mice (red bars). (I) Comparison of phenotypic score (supplemental Table 1) using weight loss, and tail, ear, and skin infiltration as indicators for TCL manifestation and inflammation. Comparison of (J) spleen weight, (K) percentage of lymphocytes in the PB, and (L) percentage of granulocytes in the PB at the time of death or after 12 months at termination of the experiment. n.d, not detected; PH, pleckstrin-homology domain; ReTx, retransplantation; TH, Tec-homology domain.
Short-term and long-term granulocyte depletion prolongs survival and reduces inflammation in the ITK-SYK PTCL mouse model
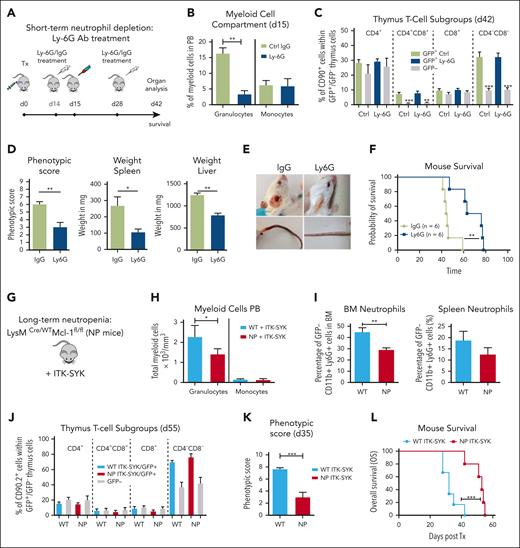
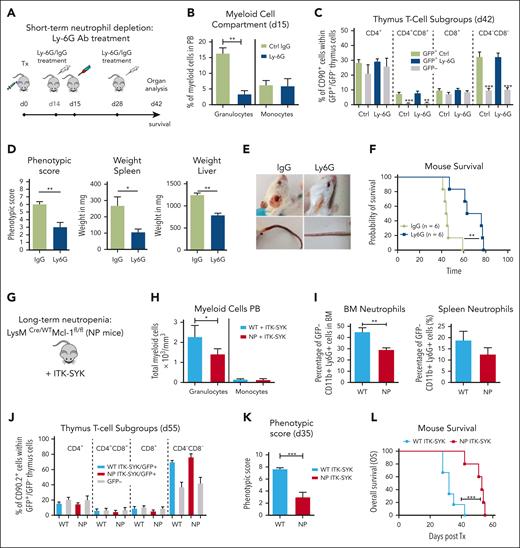
Next, we aimed to understand how granulocytosis and granulocyte-driven inflammation could influence the disease phenotype of ITK-SYK+ PTCLs. For short-term granulocyte depletion, ITK-SYK mice that underwent transplantation were injected with 2 doses of Ly6G or immunoglobulin G control antibody on day 14 and day 28 after transplantation (Figure 2A). The Ly6G antibody caused an effective depletion of murine granulocytes within 24 hours in the PB, spleen, BM, and other organs (in PB from 16.4% to 4.6%; Figure 2B36), whereas it did not affect monocytes, macrophages, hemoglobin levels, thrombocyte and B-cell counts, or malignant ITK-SYK+ T-cell quantities and distribution (Figure 2B-C; supplemental Figure 1). Granulocyte depletion could be sustained over several weeks with repeated Ly6G antibody injections (supplemental Figure 2), and it inhibited splenomegaly, normalized splenic cell counts, reduced liver infiltration, and delayed the onset of severe disease symptoms, including weight loss, skin infiltrates, and skin necrosis (phenotypic score reduced from 6.33 ± 1.21 to 3.3 ± 2.42 [Ly6G]; Figure 2D-E), resulting in a significantly enhanced median OS time (median, 44-72 days; Figure 2F).
Short-term and long-term granulocyte depletion reduces inflammation and prolongs survival in the ITK-SYK PTCL mouse model. (A) Workflow for short-term granulocyte depletion with the Ly6G antibody vs control IgG antibody. Antibody injection (250 μg) was performed IP on day 14 and day 28 after ITK-SYK transplantation. (B) Percentage of granulocytes and monocytes in the PB 1 day after control or Ly6G antibody treatment (n = 6 per group). (C) Percentage of different T-cell subsets analyzed by FACS within ITK-SYK/GFP+ and GFP− thymus cells of ITK-SYK mice on day 28 after first and day 14 after second antibody injection (n = 6 per group). (D) Phenotypic score, spleen weight, and liver weight of ITK-SYK mice treated with Ly6G vs control antibody, day 14 after the second treatment (n = 6 per group). (E) Representative images of ITK-SYK mice treated with IgG control vs Ly6G antibody. (F) Kaplan-Meier survival curve representing the survival of ITK-SYK mice after 2 IP injections with IgG isotype control antibody or anti-Ly-6G antibody (n = 6 per group). (G) Genotype of long-term neutrophil granulocyte depleted Lysm-Cre/WT/MCL-1fl/fl mice (NP) on a C57BL/6N background. (H) Total granulocytes and monocytes from the PB of WT and NP mice that had received transplantation with ITK-SYK, day 55 after transplantation (n = 6 per group). (I) Percentage of neutrophil granulocytes (CD11b+ Ly6G+) in the BM and spleen of WT control or NP mice. (J) Percentage of different T-cell subsets analyzed by FACS within ITK-SYK/GFP+ and GFP– thymus cells of ITK-SYK mice with WT vs Lysm-Cre/WT/MCL-1fl/fl background (n = 6 per group). (K) Phenotypic score of WT ITK-SYK mice vs (NP) ITK-SYK mice on day 35 after transplantation (n = 6 per group). (L) Kaplan-Meier survival curve representing the survival of WT ITK-SYK mice vs Lysm-Cre/WT/MCL-1fl/fl (NP) ITK-SYK mice (n = 6 per group). (B-D,H-J) Bars represent mean values with error bars showing the SEM. Statistical significance was calculated using Student unpaired t test. Asterisks represent the significance of the difference between GFP+ and GFP– populations within the same mice. (F,L) Statistical analysis was performed using the log-rank Mantel-Cox test. ∗P < .05, ∗∗P < .01, ∗∗∗P < .001. IgG, immunoglobulin G; SEM, standard error of the mean.
Short-term and long-term granulocyte depletion reduces inflammation and prolongs survival in the ITK-SYK PTCL mouse model. (A) Workflow for short-term granulocyte depletion with the Ly6G antibody vs control IgG antibody. Antibody injection (250 μg) was performed IP on day 14 and day 28 after ITK-SYK transplantation. (B) Percentage of granulocytes and monocytes in the PB 1 day after control or Ly6G antibody treatment (n = 6 per group). (C) Percentage of different T-cell subsets analyzed by FACS within ITK-SYK/GFP+ and GFP− thymus cells of ITK-SYK mice on day 28 after first and day 14 after second antibody injection (n = 6 per group). (D) Phenotypic score, spleen weight, and liver weight of ITK-SYK mice treated with Ly6G vs control antibody, day 14 after the second treatment (n = 6 per group). (E) Representative images of ITK-SYK mice treated with IgG control vs Ly6G antibody. (F) Kaplan-Meier survival curve representing the survival of ITK-SYK mice after 2 IP injections with IgG isotype control antibody or anti-Ly-6G antibody (n = 6 per group). (G) Genotype of long-term neutrophil granulocyte depleted Lysm-Cre/WT/MCL-1fl/fl mice (NP) on a C57BL/6N background. (H) Total granulocytes and monocytes from the PB of WT and NP mice that had received transplantation with ITK-SYK, day 55 after transplantation (n = 6 per group). (I) Percentage of neutrophil granulocytes (CD11b+ Ly6G+) in the BM and spleen of WT control or NP mice. (J) Percentage of different T-cell subsets analyzed by FACS within ITK-SYK/GFP+ and GFP– thymus cells of ITK-SYK mice with WT vs Lysm-Cre/WT/MCL-1fl/fl background (n = 6 per group). (K) Phenotypic score of WT ITK-SYK mice vs (NP) ITK-SYK mice on day 35 after transplantation (n = 6 per group). (L) Kaplan-Meier survival curve representing the survival of WT ITK-SYK mice vs Lysm-Cre/WT/MCL-1fl/fl (NP) ITK-SYK mice (n = 6 per group). (B-D,H-J) Bars represent mean values with error bars showing the SEM. Statistical significance was calculated using Student unpaired t test. Asterisks represent the significance of the difference between GFP+ and GFP– populations within the same mice. (F,L) Statistical analysis was performed using the log-rank Mantel-Cox test. ∗P < .05, ∗∗P < .01, ∗∗∗P < .001. IgG, immunoglobulin G; SEM, standard error of the mean.
To confirm these results, we used a genetic model for long-term granulocyte depletion, the LysM-Cre/wt /Mcl-1fl/fl mice with a specific deletion of Mcl1 in granulocytes and monocytes (Figure 2G). Only granulocytes, not monocytes, require the antiapoptotic Mcl1 protein for their survival, and, therefore, LysM-Cre/wt /Mcl-1fl/fl mice have strongly reduced granulocyte counts, with unaffected monocyte counts.36,38,39 LysM-Cre/wt /Mcl-1fl/fl BM cells were infected with retroviral ITK-SYK and syngeneically transplanted into LysM-Cre/wt/MCL-1fl/fl mice. Granulocytes (CD11b+Ly6G+) were efficiently depleted in ITK-SYK+ mice within the PB, BM, and spleen (Figure 2H-I), whereas ITK-SYK+ T-cell numbers and distribution were not affected (Figure 2J; supplementary Figure 3). Moreover, long-term granulocyte depletion efficiently reduced disease symptoms, including reduced weight loss, reduced skin infiltrates, and a lower phenotypic disease score (from 7.66 ± 0.47 to 3 ± 1.82; Figure 2K) in ITK-SYK mice. Mouse survival was significantly prolonged from 32 days (control group) to 56 days (neutropenia mice; Figure 2L). Taken together, our results suggest that inflammatory granulocytes strongly contribute to the disease phenotype of ITK-SYK+ TCL mice and that their depletion reduces disease symptoms and enhances mouse survival.
ITK-SYK drives constitutive TCR and Jak/Stat signaling in CD4+ TCLs and induces positive autoregulatory loops in between TCLs and granulocytes via IFN-γ and IL-6
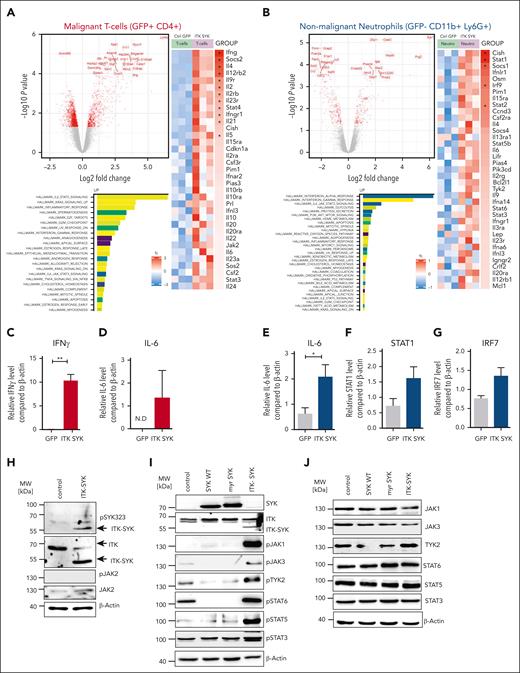
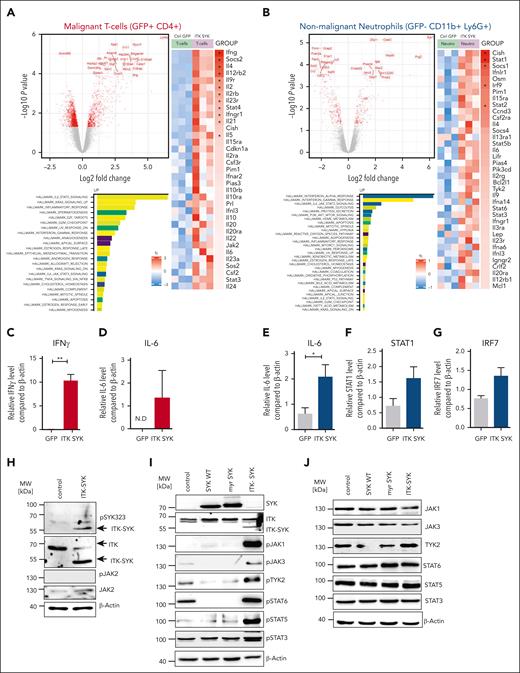
Next, we aimed to identify the pathways that are altered because of the overexpression of ITK-SYK within the CD4+ T cells and nonmalignant, inflammatory granulocytes. ITK-SYK+CD4+ T cells and ITK-SYK− granulocytes were sorted from the spleens of infected mice. RNA was extracted and gene expression analysis was performed using Affimetrix array sets. Pathway analysis was performed to identify the hallmarks of cancer, Kyoto Encyclopedia of Genes and Genomes signaling pathways, and gene ontology biological processes. The strongest upregulated pathways in T cells were TCR signaling (previously shown by Pechloff at al12), inflammatory response signaling, Jak/Stat signaling including cytokine-cytokine receptor signaling, and leukocyte chemotaxis (Figure 3A; supplemental Figure 4). IFN-γ as well as other cytokines such as IL-2, IL-4, IL-5, IL-6, IL-15, and IL-10 were massively upregulated in ITK-SYK+ T cells, suggesting a mixed Th1 and Th2 activation. Upregulated genes within Jak/Stat signaling were Jak2,Pim1, Stat3, and Stat4. Promigratory signals for leukocyte trafficking to the skin, inflammatory sites, and tumor tissues were strongly enhanced (Cxcr3, Cxcr6 receptor, and Myo1f), including pathways that induce evasion of T cells from the thymus (Adam8).40-43
ITK-SYK drives constitutive TCR and Jak/Stat signaling in CD4+TCLs and induces positive autoregulatory loops in between TCLs and granulocytes via IFN-γ and IL-6. ITK-SYK/GFP+ CD4+ T cells and granulocytes were sorted from the spleens of diseased ITK-SYK+ mice, total RNA was isolated, and subsequently transcriptome analysis using microarrays was performed. (A,B) Volcano plots show the top genes upregulated or downregulated for GFP+ CD4+ malignant T cells (A) and GFP– CD11b+ Ly6G+ splenic neutrophils (B). Bars show highest upregulated pathways by GESA using gene sets for hallmarks of cancer. A heatmap was generated using Kyoto Encyclopedia of Genes and Genomes gene sets analysis and shows genes involved in the Jak/Stat signaling pathway in malignant T cells (A) and neutrophils (B). (C-G) TaqMan qPCRs were performed using complementary DNA generated from messenger RNA isolated from primary murine ITK-SYK/GFP+CD4+ T cells (C,D) and GFP–CD11b+Ly6G+ granulocytes (E-G) for IFN-γ, IL-6, STAT1, and IRF7 and compared with β-Actin as a control (n = 3 per group). Cells were extracted from the spleens on day 35 after transplantation. (H) Western blot of the murine CD4+ T-cell line D10.G4.1 expressing pMIG (control) or ITK-SYK/GFP and stained with antibodies against phosphorylated and total JAK2, phosphorylated SYK323, ITK, and β-Actin as loading control. (I,J) Western blot of D10.G4.1 expressing pMIG, pMIG/SYK WT, pMIG/myr-SYK, or pMIG/ITK-SYK and stained with antibodies against total SYK, ITK (I) as well as phosphorylated (I) and total (J) JAK1, JAK3, TYK2, STAT6, STAT5, and STAT3, with β-actin as the loading control. (C-G) Bars represent mean values with error bars showing the SEM. Statistical significance was calculated using Student unpaired t test. Asterisks represent the significance of the difference between GFP+ and GFP− populations within the same mice. ∗P < .05, ∗∗∗P < .001. GESA, GSE222050; N.D, not detected; qPCR, quantitative PCR.
ITK-SYK drives constitutive TCR and Jak/Stat signaling in CD4+TCLs and induces positive autoregulatory loops in between TCLs and granulocytes via IFN-γ and IL-6. ITK-SYK/GFP+ CD4+ T cells and granulocytes were sorted from the spleens of diseased ITK-SYK+ mice, total RNA was isolated, and subsequently transcriptome analysis using microarrays was performed. (A,B) Volcano plots show the top genes upregulated or downregulated for GFP+ CD4+ malignant T cells (A) and GFP– CD11b+ Ly6G+ splenic neutrophils (B). Bars show highest upregulated pathways by GESA using gene sets for hallmarks of cancer. A heatmap was generated using Kyoto Encyclopedia of Genes and Genomes gene sets analysis and shows genes involved in the Jak/Stat signaling pathway in malignant T cells (A) and neutrophils (B). (C-G) TaqMan qPCRs were performed using complementary DNA generated from messenger RNA isolated from primary murine ITK-SYK/GFP+CD4+ T cells (C,D) and GFP–CD11b+Ly6G+ granulocytes (E-G) for IFN-γ, IL-6, STAT1, and IRF7 and compared with β-Actin as a control (n = 3 per group). Cells were extracted from the spleens on day 35 after transplantation. (H) Western blot of the murine CD4+ T-cell line D10.G4.1 expressing pMIG (control) or ITK-SYK/GFP and stained with antibodies against phosphorylated and total JAK2, phosphorylated SYK323, ITK, and β-Actin as loading control. (I,J) Western blot of D10.G4.1 expressing pMIG, pMIG/SYK WT, pMIG/myr-SYK, or pMIG/ITK-SYK and stained with antibodies against total SYK, ITK (I) as well as phosphorylated (I) and total (J) JAK1, JAK3, TYK2, STAT6, STAT5, and STAT3, with β-actin as the loading control. (C-G) Bars represent mean values with error bars showing the SEM. Statistical significance was calculated using Student unpaired t test. Asterisks represent the significance of the difference between GFP+ and GFP− populations within the same mice. ∗P < .05, ∗∗∗P < .001. GESA, GSE222050; N.D, not detected; qPCR, quantitative PCR.
Within the granulocytes, the strongest activated pathways were those of IFN-α and IFN-γ response, Jak/Stat signaling, and antigen presentation (Figure 3B). The main upregulated Jak/Stat signaling mediators were IL-6, Stat1, Stat2, Stat3, Stat5b, Stat6, Pim1, and Tyk2 (further data are given in supplemental Figure 4).
Validation via quantitative PCR confirmed a 10-fold induction of IFN-γ in ITK-SYK+ T cells, whereas expression of the IFN-γ receptor and a typical IFN-γ response with induced upregulations of Irf7 and Stat1 were observed in granulocytes (Figure 3C-D). In addition, IL-6, IL-9, and Osm were also strongly upregulated in inflammatory granulocytes (polymorphonuclear neutrophils [PMNs]) and could stimulate the respective upregulated cytokine receptors on the malignant T cells, thus implicating positive regulatory feedback loops between ITK-SYK+ malignant T cells and activated inflammatory granulocytes.
ITK-SYK directly induces activation of JAK1, JAK3, and TYK2 in murine CD4+ T cells
To discriminate between pathways either activated directly by ITK-SYK or by the microenvironment, ITK-SYK was overexpressed in the murine CD4+ T-cell line, D10.G4.1, which is cultivated without contact to granulocytes or other micorenvironmental cells. ITK-SYK expression directly induced phosphorylation of Jak1, Jak3, and Tyk2 as well as their downstream effectors, Stat6, Stat3, and Stat5. SYK WT or myristylated SYK, which is localized at the membrane, similar to ITK-SYK, did not induce Jak/Stat signaling, implicating ITK as an essential component for Jak/Stat activation. Interestingly, Jak2 and Stat4, which were strongly induced under in vivo conditions were not directly activated by ITK-SYK, indicating that their induction depends on the interaction with the microenvironment in vivo (Figure 3E-I; data not shown).
Ruxolitinib but not pacritinib treatment blocks ITK-SYK–induced TCL and inflammation
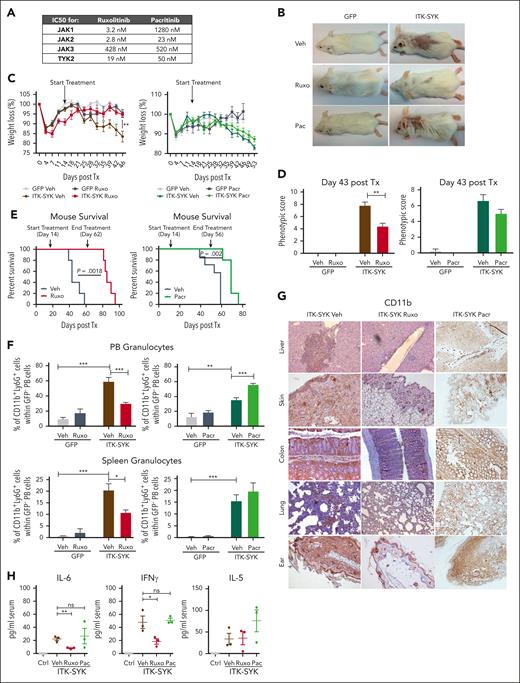
Jak/Stat signaling is broadly activated in ITK-SYK+ T cells and, additionally, in the inflammatory granulocytes, involving nearly all JAK kinases (JAK1/2/3 and TYK2; Figure 3). Ruxolinib and pacritinib are broadly acting JAK inhibitors, which block Jak2 and Tyk2, but only ruxolitinib additionally inhibits Jak1 (Figure 4A). Both inhibitors were used to block Jak/Stat signaling in TCLs and granulocytes in ITK-SYK mice. Ruxolitinib treatment almost completely blocked skin, ear, and tail inflammation/encrustations (Figure 4B), prevented weight loss (Figure 4C), and improved the phenotypic disease score (control-treated, 7.8 ± 1.16 vs ruxolitinib-treated, 4.4 ± 1.02; Figure 4D), whereas pacritinib could not prevent any of those disease symptoms. Nevertheless, mouse survival was significantly extended by both drugs, with ruxolitinib (increased from 58 days to 95 days) being more effective than pacritinib (increased from 59 days to 76 days) (Figure 4E). The effect of ruxolitinib treatment was even sustained for several weeks after stopping drug treatment. Granulocyte measurements in the PB and spleen (Figure 4F) and immunohistochemistry staining for CD11b+ myeloid cells showed a strong reduction of granulocytic infiltrates into the skin, liver, colon, lung, and ears after ruxolitinib but not after pacritinib treatment (Figure 4G). In concordance, inflammatory cytokines such as IL-6 and IFN-γ could be downregulated by ruxolitinib but not by pacritinib, whereas IL-5 levels remained elevated independently of the treatment (Figure 4H). Our results suggest that combined Jak1/2 and Tyk2 inhibition via ruxolitinib is necessary to block the inflammatory phenotype driven by granulocytes and aberrant cytokine signaling in ITK-SYK+ PTCLs, whereas failure to block Jak1, as observed with pacritinib, improves survival but causes an insufficient inflammatory disease control.
Ruxolitinib but not pacritinib treatment blocks ITK-SYK–induced TCL and inflammation. GFP (n = 6) and ITK-SYK mice (n = 6) were treated with vehicle (Veh), ruxolitinib (Ruxo; 30 mg/kg body weight; red), or pacritinib (Pacr; 150 mg/kg body weight; green) twice daily for 32 consecutive days for organ analysis and then euthanized. For survival, mice were treated until ITK-SYK+ vehicle group had died (43 days). (A) The 50% inhibitory (IC50) values for ruxolitinib vs pacritinib for human JAK kinases (JAK1-3 and TYK2). (B) Representative images of GFP and ITK-SYK+ mice treated with vehicle, ruxolitinib, or pacritinib for 28 days. Control- and pacritinib-treated mice show loss of fur and skin encrustations as signs of disease. (C) Weight development of mice shown as the changed percentage compared with starting weight on day 0 after transplantation. Statistical significance was calculated for the values on treatment day 28. (D) Phenotypic score of GFP and ITK-SYK mice on treatment day 28. (E) Kaplan-Meier survival curves representing the survival of ITK-SYK mice after treatment with vehicle vs ruxolitinib (left; n = 5) or vehicle vs pacritinib (right; n = 7, vehicle; n = 5, pacritinib) until 46 treatment days. Statistical analysis was performed using the Log-rank Mantel-Cox test. (F) Percentage of CD11b+Ly6G+ neutrophil granulocytes within GFP– PB cells or spleen cells of GFP control and ITK-SYK mice after treatment. Blood samples were taken on treatment day 28 and analyzed by FACS. Spleens were taken on treatment day 32 after transplantation. (G) Representative images of immunohistochemical HRP-DAB staining with anti-CD11b antibody of paraffin-embedded organs of ITK-SYK mice after treatment with vehicle, ruxolitinib, or pacritinib for 32 days. (H) Serum cytokine levels of murine IL-6, IFN-γ, and IL-5 of GFP vehicle (Ctrl) vs ITK-SYK mice after treatment with vehicle (Veh), ruxolitinib (Ruxo), or pacritinib (Pac) on treatment day 32. Bars represent mean values with error bars showing the SEM. Statistical significance was calculated using the Student unpaired t test. ∗P < .05, ∗∗P < .01, ∗∗∗P < .001. Ctrl, control; HRP/DAB, peroxidase detection kit; ns, nonsignificant.
Ruxolitinib but not pacritinib treatment blocks ITK-SYK–induced TCL and inflammation. GFP (n = 6) and ITK-SYK mice (n = 6) were treated with vehicle (Veh), ruxolitinib (Ruxo; 30 mg/kg body weight; red), or pacritinib (Pacr; 150 mg/kg body weight; green) twice daily for 32 consecutive days for organ analysis and then euthanized. For survival, mice were treated until ITK-SYK+ vehicle group had died (43 days). (A) The 50% inhibitory (IC50) values for ruxolitinib vs pacritinib for human JAK kinases (JAK1-3 and TYK2). (B) Representative images of GFP and ITK-SYK+ mice treated with vehicle, ruxolitinib, or pacritinib for 28 days. Control- and pacritinib-treated mice show loss of fur and skin encrustations as signs of disease. (C) Weight development of mice shown as the changed percentage compared with starting weight on day 0 after transplantation. Statistical significance was calculated for the values on treatment day 28. (D) Phenotypic score of GFP and ITK-SYK mice on treatment day 28. (E) Kaplan-Meier survival curves representing the survival of ITK-SYK mice after treatment with vehicle vs ruxolitinib (left; n = 5) or vehicle vs pacritinib (right; n = 7, vehicle; n = 5, pacritinib) until 46 treatment days. Statistical analysis was performed using the Log-rank Mantel-Cox test. (F) Percentage of CD11b+Ly6G+ neutrophil granulocytes within GFP– PB cells or spleen cells of GFP control and ITK-SYK mice after treatment. Blood samples were taken on treatment day 28 and analyzed by FACS. Spleens were taken on treatment day 32 after transplantation. (G) Representative images of immunohistochemical HRP-DAB staining with anti-CD11b antibody of paraffin-embedded organs of ITK-SYK mice after treatment with vehicle, ruxolitinib, or pacritinib for 32 days. (H) Serum cytokine levels of murine IL-6, IFN-γ, and IL-5 of GFP vehicle (Ctrl) vs ITK-SYK mice after treatment with vehicle (Veh), ruxolitinib (Ruxo), or pacritinib (Pac) on treatment day 32. Bars represent mean values with error bars showing the SEM. Statistical significance was calculated using the Student unpaired t test. ∗P < .05, ∗∗P < .01, ∗∗∗P < .001. Ctrl, control; HRP/DAB, peroxidase detection kit; ns, nonsignificant.
Ruxolitinib but not pacritinib blocks migration of CD4+ T cells from the thymus into the skin and inhibits Stat3/Plc-γ phosphorylation
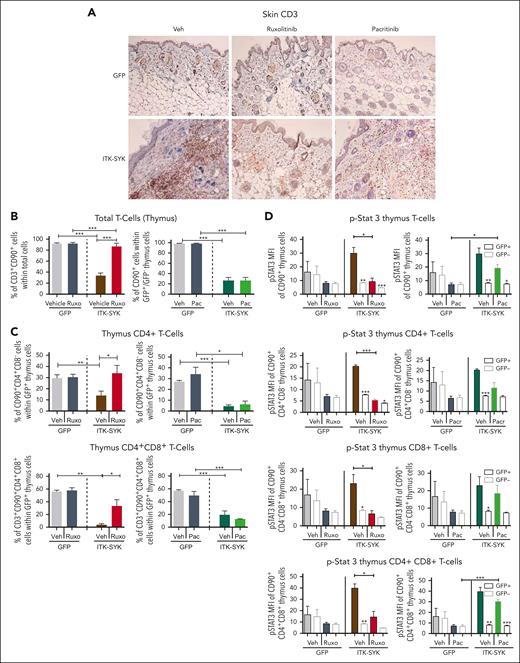
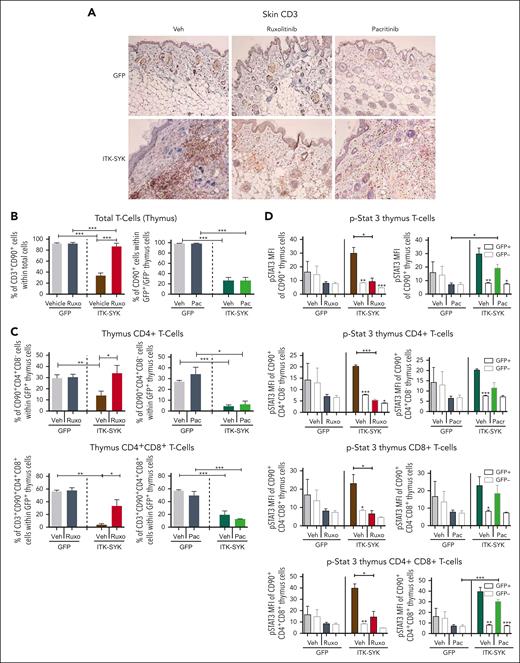
Expression of the ITK-SYK oncogene in T cells induced the expression of homing factors such as Cxcr3, Cxcl6, and Adam8 (Figure 2) which affected T-cell homing/localization by driving the evasion of T cells from the thymus (Adam8) into other organs such as the skin, resulting in chronic inflammation and subsequent destruction of adipose tissues (Figure 5A-B). Subanalysis of all ITK-SYK+ T cells in the thymus showed a major reduction in CD4+ and CD4+CD8+ T cells, whereas CD8+ and CD4−CD8− T cells were not affected or even slightly increased (Figure 5C; supplemental Figure 5). Cxcr3 and Cxcr6 both involve dual Jak1/2 signaling. Conclusively, only ruxolitinib treatment completely restored and normalized the quantity of GFP+CD4+ and GFP+CD4+CD8+ T cells within the thymus, whereas pacritinib could block neither the emigration of T cells from the thymus nor their invasion into the skin (Figure 5A,C; supplemental Figure 6). Phospho-flow cytometry of thymus cells revealed hyperphosphorylation of Stat3, Stat5, and PLC-γ in the malignant ITK-SYK+CD4+ T cells, CD8+ T cells, and CD4+CD8+ T cells (Figure 5E; supplemental Figures 6-8). Ruxolitinib blocked Stat3 and phospholipase C gamma (PLC-γ) phosphorylation within all ITK-SYK+ T-cell subpopulations, whereas pacritinib was only partially effective (Figure 5E; supplemental Figure 8). Stat5 phosphorylation could not be sufficiently inhibited by any of the compounds (supplemental Figure 7), which might indicate that Jak3, which is not targeted by either of the inhibitors, is its major regulator.44
Ruxolitinib but not pacritinib blocks T-cell infiltration into the skin, inhibits evasion of CD4+ T cells out of the thymus, and inhibits Stat3/5 phosphorylation. GFP or ITK-SYK mice were treated with vehicle, ruxolitinib, or pacritinib for 32 days, euthanized, and analyzed as described in Figure 4. (A) Immunohistochemical HRP-DAB staining with anti-CD3 antibody (T cells) of paraffin-embedded skin tissue of GFP and ITK-SYK mice after treatment with vehicle (Veh), ruxolitinib, or pacritinib for 32 days. (B) Percentages of T cells, granulocytes, and monocytes within total thymus cells of GFP and ITK-SYK mice after treatment with vehicle or ruxolitinib for 32 days. (C) Percentage of CD90+CD4+ (CD4+) and CD90+CD4+CD8+ (CD4+CD8+) cells within GFP+ thymus cells of GFP and ITK-SYK mice after treatment with vehicle, ruxolitinib, or pacritinib for 32 days. (D) Mean fluorescence intensity for intracellular FACS staining of phosphorylated STAT3 in total CD3+CD90+ thymic T cells, CD4+ T cells, CD8+ T cells, and CD4+CD8+ T cells from treated control/GFP or ITK-SYK mice within GFP+ and GFP– T cells. Bars represent mean values with error bars showing the SEM. Statistical significance was calculated using the Student unpaired t test. ∗P < .05, ∗∗P < .01, ∗∗∗P < .001.
Ruxolitinib but not pacritinib blocks T-cell infiltration into the skin, inhibits evasion of CD4+ T cells out of the thymus, and inhibits Stat3/5 phosphorylation. GFP or ITK-SYK mice were treated with vehicle, ruxolitinib, or pacritinib for 32 days, euthanized, and analyzed as described in Figure 4. (A) Immunohistochemical HRP-DAB staining with anti-CD3 antibody (T cells) of paraffin-embedded skin tissue of GFP and ITK-SYK mice after treatment with vehicle (Veh), ruxolitinib, or pacritinib for 32 days. (B) Percentages of T cells, granulocytes, and monocytes within total thymus cells of GFP and ITK-SYK mice after treatment with vehicle or ruxolitinib for 32 days. (C) Percentage of CD90+CD4+ (CD4+) and CD90+CD4+CD8+ (CD4+CD8+) cells within GFP+ thymus cells of GFP and ITK-SYK mice after treatment with vehicle, ruxolitinib, or pacritinib for 32 days. (D) Mean fluorescence intensity for intracellular FACS staining of phosphorylated STAT3 in total CD3+CD90+ thymic T cells, CD4+ T cells, CD8+ T cells, and CD4+CD8+ T cells from treated control/GFP or ITK-SYK mice within GFP+ and GFP– T cells. Bars represent mean values with error bars showing the SEM. Statistical significance was calculated using the Student unpaired t test. ∗P < .05, ∗∗P < .01, ∗∗∗P < .001.
Ruxolitinib inhibits PTCL expansion and systemic inflammation in patient-derived PTCL xenograft mouse models
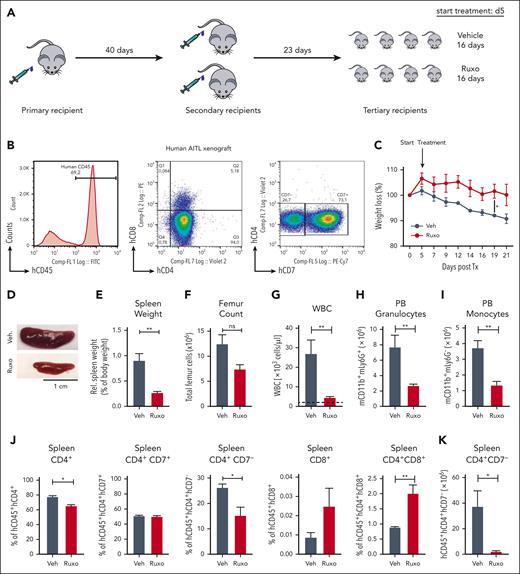
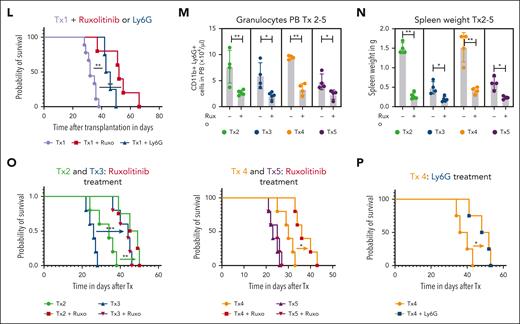
Next, we wanted to understand the role of the granulocyte/T-cell lymphoma interactions in human PTCLs. Because ITK-SYK is mainly expressed in follicular TCL and because we identified the CD4+ TCL population to be the main disease and inflammation driver, we focused on human CD4+ PTCLs. We developed several human xenograft models for primary patient-derived CD4+ TFH-PTCL and 1 CD4+ PTCL-NOS in NOG mice. PTCLs that were engrafted had the following mutations/fusions: PTCL1/Tx1 (STAT3 and AITL), PTCL2/Tx2 (TP53, TET2, and follicular PTCL), PTCL3/Tx3 (RHOA G17V, TET2, and AITL), PTCL4/Tx4 (ITK-SYK and follicular PTCL), and PTCL5/Tx5 (TP53, CDKN2A, and PTCL-NOS). Primary CD4+ PB cells (between 6 × 10⁶ and 10 × 106) were injected IP and intravenously into a single immunodeficient NOG mouse (Figure 6A). Engraftment was assessed using flow cytometry (CD4+CD7low for PTCL1), and TCR clonality analysis, using spectratyping (Figure 6B; supplemental Figure 9). Mice that underwent engraftment developed a massive splenomegaly, and human CD4+ spleen cells were harvested and retransplanted into 2 and then ∼8 to 10 recipients. The mice developed a similar phenotype compared with that of our murine ITK-SYK model, with reduced body weight, increased spleen size, increased spleen weight, and skin infiltrates as well as increased white blood cell (WBC) counts along with granulocytosis and monocytosis (Figure 6C-I). Vehicle or ruxolitinib treatment was started 2 weeks after transplantation and continued for 16 days. Spleen size and weight as well as BM and spleen cellularity, WBC counts, granulocyte numbers, and monocytes numbers were normalized with ruxolitinib treatment (Figure 6C-I). Similar to the ITK-SYK mouse model, ruxolitinib treatment selectively reduced the relative and total amounts of the malignant T-cell population (CD4+CD7low), whereas the percentage of the other engrafted T cells, such as CD4+CD8+ T cells, CD8+ T cells, or CD4+CD8+ T cells increased (Figure 6J-K), indicating a specific sensitivity of the malignant CD4+ T cells toward JAK1/2 inhibition. Continuous ruxolitinib treatment significantly extended mouse survival (Figure 6L). Murine granulocytosis and splenomegaly was also observed after the engraftment of all other CD4+ PTCLs (Tx4 with ITK-SYK) and could be normalized with ruxolitinib treatment in all cases (Figure 6M-N). Ruxolitinib treatment extended mouse survival in 4 of 5 xenografts (Figure 6L-O). To understand whether the effects of ruxolitinib are mediated by the direct effects on tumor cells or via the effect on granulocytes, we reengrafted PTCL1 and PTCL4 (ITK-SYK) and depleted the upregulated murine granulocytes via the Ly6G antibody. Ly6G treatment efficiently reduced murine granulocytes (supplemental Figure 10) and significantly enhanced mouse survival (Figure 6L,P), thus supporting the role of activated granulocytes as disease drivers in CD4+ PTCL subtypes.
Ruxolitinib inhibits PTCL expansion and systemic inflammation in patient-derived PTCL xenograft mouse models. (A) Transplantation scheme for engraftment and in vivo expansion of malignant T cells from a patient with AITL. Firstly, 1 NOG mouse received transplantation IV with 6 × 106 PB cells of a patient with AITL after Ficoll purification. Then, FACS analysis and spectratyping revealed engraftment of the malignant clone, T cells (> 95%) were extracted from the spleen, and 36.1 × 10⁶ hCD45 cells were transplanted IV into 2 secondary recipients. Upon engraftment, isolation and retransplantation was repeated, and 8 recipients received transplantation IV with 27 × 106 T cells. On day 5 after transplantation, treatment with vehicle or ruxolitinib twice daily was started and carried out for 16 days until mice were sacrificed for organ analysis. (B) FACS histogram plot shows huCD45+ cells in the first mouse that had received transplantation. CD45+ cells are nearly all T cells, positive for CD4 or double positive for CD4/CD8. The malignant population is characterized as CD4+ CD7 low (28% of CD4+ cells). (C) Percentage of weight loss of AITL xenografted mice after treatment with vehicle or ruxolitinib compared with starting weight measured on day 0 after transplantation. Statistical significance was calculated for the values on day 19 and day 21 (n = 4 per group). (D) Image of the spleens from AITL engrafted mice treated with vehicle or ruxolitinib for 21 days. (E-I) Comparison of spleen weights and femur cell counts, WBC counts, granulocyte counts, and monocyte counts of vehicle- or ruxolitinib-treated AITL mice. Dashed lines indicate baseline levels (mean of 3 WT NOG mice, ie, without transplantation). (J) Percentage of normal human T cells (hCD45+hCD4+, hCD45+hCD4+hCD7+, hCD45+hCD8+, and hCD45+hCD4+hCD8+) and the malignant hCD45+hCD4+hCD7− cells within total spleen cells after treatment with vehicle vs ruxolitinib and measured by FACS (n = 4 per group). (K) Total amount (× 106) of malignant T cells hCD45+hCD4+hCD7− in the spleen after the treatment period of 21 days. (L) Kaplan-Meier survival curve for Tx1 xenografted mice treated with vehicle controls (n = 5 for vehicle ruxolitinib and n = 5 for control antibody in 1 curve), ruxolitinib (n = 5), or Ly6G antibody (blue; n = 5). (M-O) Xenografts 2 to 5 (Tx 2-5) from 4 more PTCLs (1 AITL, 2 follicular TCL, and 1 PTCL-NOS). (M,N) Granulocyte counts and spleen weights in mice with xenografts (Tx 2-5) with and without ruxolitinib treatment (all P < .05). (O,P) Kaplan-Meier survival curve of xenografted mice (Tx 2-5) with or without ruxolitinib treatment (O) or Ly6G treatment (P). Bars represent mean values with error bars showing the SEM. Statistical significance was calculated using the Student unpaired t test. ∗P < .05, ∗∗P < .01, ∗∗∗P < .001.
Ruxolitinib inhibits PTCL expansion and systemic inflammation in patient-derived PTCL xenograft mouse models. (A) Transplantation scheme for engraftment and in vivo expansion of malignant T cells from a patient with AITL. Firstly, 1 NOG mouse received transplantation IV with 6 × 106 PB cells of a patient with AITL after Ficoll purification. Then, FACS analysis and spectratyping revealed engraftment of the malignant clone, T cells (> 95%) were extracted from the spleen, and 36.1 × 10⁶ hCD45 cells were transplanted IV into 2 secondary recipients. Upon engraftment, isolation and retransplantation was repeated, and 8 recipients received transplantation IV with 27 × 106 T cells. On day 5 after transplantation, treatment with vehicle or ruxolitinib twice daily was started and carried out for 16 days until mice were sacrificed for organ analysis. (B) FACS histogram plot shows huCD45+ cells in the first mouse that had received transplantation. CD45+ cells are nearly all T cells, positive for CD4 or double positive for CD4/CD8. The malignant population is characterized as CD4+ CD7 low (28% of CD4+ cells). (C) Percentage of weight loss of AITL xenografted mice after treatment with vehicle or ruxolitinib compared with starting weight measured on day 0 after transplantation. Statistical significance was calculated for the values on day 19 and day 21 (n = 4 per group). (D) Image of the spleens from AITL engrafted mice treated with vehicle or ruxolitinib for 21 days. (E-I) Comparison of spleen weights and femur cell counts, WBC counts, granulocyte counts, and monocyte counts of vehicle- or ruxolitinib-treated AITL mice. Dashed lines indicate baseline levels (mean of 3 WT NOG mice, ie, without transplantation). (J) Percentage of normal human T cells (hCD45+hCD4+, hCD45+hCD4+hCD7+, hCD45+hCD8+, and hCD45+hCD4+hCD8+) and the malignant hCD45+hCD4+hCD7− cells within total spleen cells after treatment with vehicle vs ruxolitinib and measured by FACS (n = 4 per group). (K) Total amount (× 106) of malignant T cells hCD45+hCD4+hCD7− in the spleen after the treatment period of 21 days. (L) Kaplan-Meier survival curve for Tx1 xenografted mice treated with vehicle controls (n = 5 for vehicle ruxolitinib and n = 5 for control antibody in 1 curve), ruxolitinib (n = 5), or Ly6G antibody (blue; n = 5). (M-O) Xenografts 2 to 5 (Tx 2-5) from 4 more PTCLs (1 AITL, 2 follicular TCL, and 1 PTCL-NOS). (M,N) Granulocyte counts and spleen weights in mice with xenografts (Tx 2-5) with and without ruxolitinib treatment (all P < .05). (O,P) Kaplan-Meier survival curve of xenografted mice (Tx 2-5) with or without ruxolitinib treatment (O) or Ly6G treatment (P). Bars represent mean values with error bars showing the SEM. Statistical significance was calculated using the Student unpaired t test. ∗P < .05, ∗∗P < .01, ∗∗∗P < .001.
Interaction between CD4+ ITK-SYK+ T cells and activated granulocytes via IFN-γ and IL-6
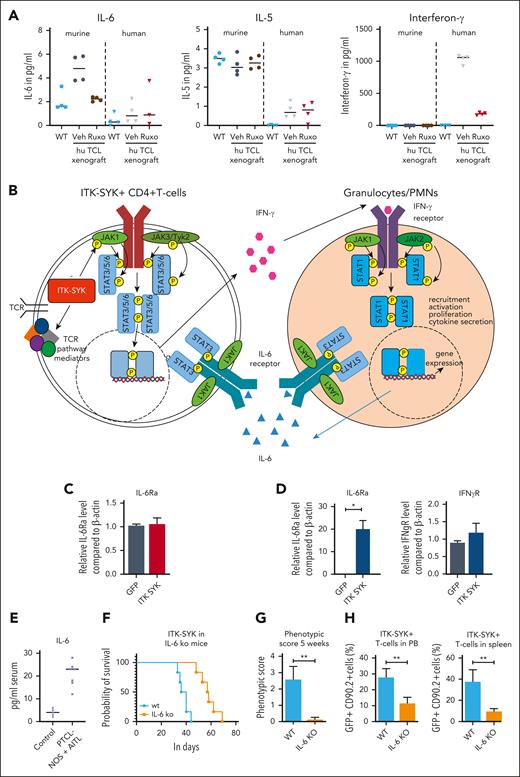
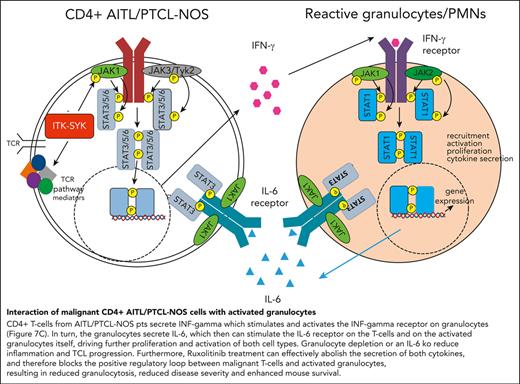
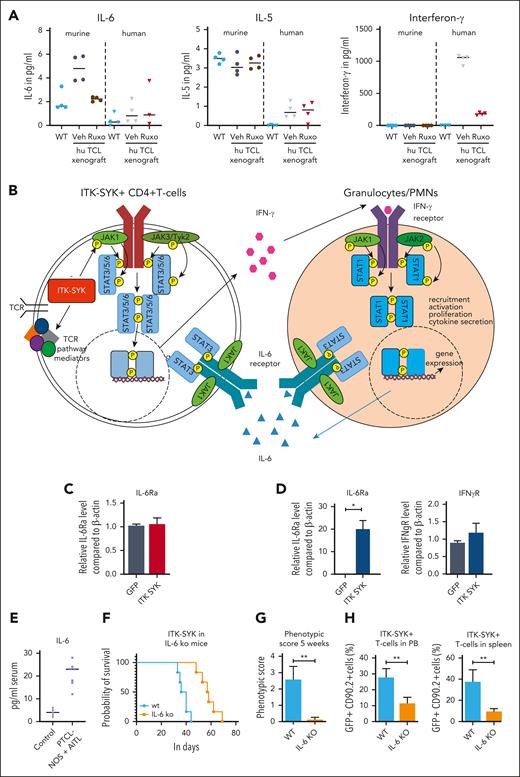
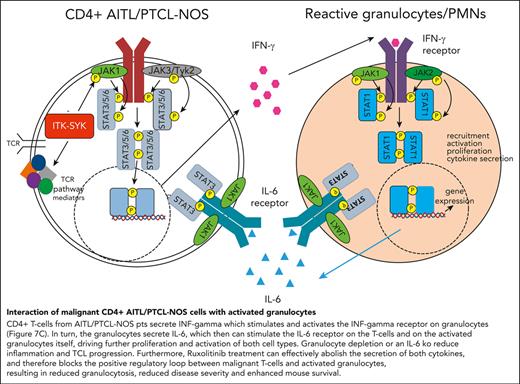
The xenograft mouse model allows us to distinguish between cytokines secreted by the human malignant T cells and by the murine microenvironment. Therefore, human and murine IFN-γ, IL-6, and IL-5 were analyzed in the serum of control mice (WT) and mice that had received PTCL xenografts, before and after ruxolitinib treatment (Figure 7A). In mice that had received xenografts, IFN-γ was exclusively human-derived (secreted from CD4+ human T cells), whereas IL-6 and IL-5 were mainly murine (from the murine microenvironment). Murine IL-6 but not murine IL-5, was induced by the human TCL xenograft, and only human IFN-γ and murine IL-6 but not murine IL-5, could be blocked with ruxolitinib treatment. In concordance, IL-6 serum levels were strongly elevated in the serum of the patients with TFH-PTCL from whom the xenografts were derived (plus 2 patients) compared with that in the serum of healthy controls (Figure 7E).45 Furthermore, the transplantation of ITK-SYK+ TCL cells into a mouse with an IL-6 knockout background significantly enhanced mouse survival, resulted in a strongly reduced disease phenotype, and reduced the expansion of malignant T cells in the PB and spleens (Figure 7F-H), thus demonstrating that micronenvironmentally secreted IL-6 propagates PTCL disease progression. Taken together, the results from the xenograft and the IL-6 knockout experiment clearly confirmed the results from the gene expression study (Figure 7B): IFN-γ is secreted by CD4+ PTCL cells and stimulates and activates the IFN-γ receptor on granulocytes (Figure 7C). In turn, the granulocytes secrete IL-6 (Figure 7A), which stimulates the IL-6 receptor on the malignant T cells and activated granulocytes (Figure 7C), driving further proliferation and activation of both cell types. Granulocyte depletion, IL-6 deletion in the microenvironment, and ruxolitinib treatment, which can abolish the secretion of both cytokines, can block the positive regulatory loop between malignant T cells and activated granulocytes, resulting in reduced inflammation and disease severity and enhanced mouse survival.
Interaction between malignant T cells und murine cytokines via IFN-γ and IL-6. (A) Serum cytokine levels of murine and human IL-6, IL-5, and IFN-γ of vehicle- and ruxolitinib-treated mice with AITL and xenografts on treatment day 16 was determined using BD CBA Flex Sets with subsequent FACS analysis (n = 4 per group). (B) Scheme demonstrating the interaction of ITK-SYK+ CD4+ T cells with neutrophil granulocytes via IFN-γ and IL-6, also demonstrating the involvement of the different JAK/STATs. ITK-SYK leads to an activation of JAK1 and JAK3 kinases and subsequent activation of STAT3 and/or STAT6, either by direct phosphorylation or via other mediators, such as an activated TCR pathway. STAT3 and STAT6 then induce gene expression of various target genes, leading to cell activation, proliferation, migration into distant organs, and cytokine secretion. One of the secreted cytokines is IFN-γ, which activates the IFN-γ receptor on myeloid cells. This activates JAK1 and JAK2 to phosphorylate STAT1, thus inducing gene transcription, ultimately resulting in their recruitment to distant organs as well as their activation, proliferation, and cytokine secretion. IL-6 is such a secreted cytokines, which in turn can induce further T-cell activation, thus forming a positive feedback loop. (C,D) Expression of the IL-6 receptor and the IFN-γ2 receptor on CD4+ T cells and on granulocytes in control vs ITK-SYK+ mice. (E) IL-6 levels in the serum of healthy controls vs patients with TFH-PTCL/PTCL-NOS (n = 7; supplemental Table 3). (F) Survival of mice that had received transplantation with ITK-SYK+ TCL cells into C57Bl6 controls or IL-6 knockout mice (n = 6 per group). (G) Phenotypic score after 5 weeks of transplantation (WT vs IL-6 knockout mice). (H) Malignant ITK-SYK+ T cells in the PB or spleen of WT vs IL-6 knockout mice (n = 6 per group). Bars represent mean values with error bars showing the SEM. Statistical significance was calculated using the Student unpaired t test. ∗P < .05, ∗∗P < .01, ∗∗∗P < .001. hu, human.
Interaction between malignant T cells und murine cytokines via IFN-γ and IL-6. (A) Serum cytokine levels of murine and human IL-6, IL-5, and IFN-γ of vehicle- and ruxolitinib-treated mice with AITL and xenografts on treatment day 16 was determined using BD CBA Flex Sets with subsequent FACS analysis (n = 4 per group). (B) Scheme demonstrating the interaction of ITK-SYK+ CD4+ T cells with neutrophil granulocytes via IFN-γ and IL-6, also demonstrating the involvement of the different JAK/STATs. ITK-SYK leads to an activation of JAK1 and JAK3 kinases and subsequent activation of STAT3 and/or STAT6, either by direct phosphorylation or via other mediators, such as an activated TCR pathway. STAT3 and STAT6 then induce gene expression of various target genes, leading to cell activation, proliferation, migration into distant organs, and cytokine secretion. One of the secreted cytokines is IFN-γ, which activates the IFN-γ receptor on myeloid cells. This activates JAK1 and JAK2 to phosphorylate STAT1, thus inducing gene transcription, ultimately resulting in their recruitment to distant organs as well as their activation, proliferation, and cytokine secretion. IL-6 is such a secreted cytokines, which in turn can induce further T-cell activation, thus forming a positive feedback loop. (C,D) Expression of the IL-6 receptor and the IFN-γ2 receptor on CD4+ T cells and on granulocytes in control vs ITK-SYK+ mice. (E) IL-6 levels in the serum of healthy controls vs patients with TFH-PTCL/PTCL-NOS (n = 7; supplemental Table 3). (F) Survival of mice that had received transplantation with ITK-SYK+ TCL cells into C57Bl6 controls or IL-6 knockout mice (n = 6 per group). (G) Phenotypic score after 5 weeks of transplantation (WT vs IL-6 knockout mice). (H) Malignant ITK-SYK+ T cells in the PB or spleen of WT vs IL-6 knockout mice (n = 6 per group). Bars represent mean values with error bars showing the SEM. Statistical significance was calculated using the Student unpaired t test. ∗P < .05, ∗∗P < .01, ∗∗∗P < .001. hu, human.
Discussion
Patients with PTCLs, especially AITL and follicular TCL, often have a strong inflammatory phenotype, which causes severe morbidity and mortality and even overrides the local effects of the malignant clone. Inflammation is driven by cytokines produced by the malignant CD4+ T cells, which attract bystander inflammatory cells, such as granulocytes or monocytes, to the site of malignancy, and also cause a systemic inflammation, with edema, skin rash, fever, and a systemic malaise of the patient. The disease along with the inflammatory symptoms could be recapitulated in mouse models of murine TCL or patient-derived AITL/follicular TCL xenografts (Figures 1 and 6). In both models, the malignant CD4+ T cells drive this inflammatory phenotype by producing excessive amounts of IFN-γ, which stimulates activation and expansion of granulocytes and other inflammatory cells (Figures 1 and 3). In reverse, the activated granulocytes secrete IL-6 and other cytokines, which stimulates JAK/STAT signaling within the malignant T cells and the granulocytes, supporting a self-supporting positive regulatory feedback loop in between malignant and inflammatory cells (Figures 3 and 7). The retransplantation of ITK-SYK+ CD4+ sorted cells into secondary recipients completely recapitulated the lethal TCL with almost 100% penetrance, which supports the role of the CD4+ population as the disease-initiating stem cell population, and as the source of systemic inflammation (Figure 1C).
To address the role of inflammation for the disease outcome in the ITK-SYK TCL mouse model, we first depleted the major reactive inflammatory bystander cell type, the neutrophil granulocytes. Depletion of granulocytes via the Ly6G antibody or genetic deletion of Mcl1, both strongly reduced disease symptoms in ITK-SYK mice, including reduced organ infiltration, and even resulted in prolonged mouse survival, which suggests that granulocyte expansion and activation mediates major disease symptoms in TCL (Figure 2).
IFN-γ, which is the strongest upregulated cytokine in CD4+ PTCL cells (Figure 3), is usually involved in Th2 antigen responses and stimulates the IFN-γ receptor on granulocytes, macrophages, and other microenvironmental cells.46 IFN-γ secretion of CD4+ T cells is regulated via the antigen-mediated activation of the TCR, but in the case of ITK-SYK and other fusion oncogenes, constitutive JAK-STAT activation (Stat3/6) directly induces IFN-γ production. In granulocytes IFN-γ activation can drive differentiation toward PMNs and induces an activation process with oxidative burst, differential gene expression, enhanced migration, and induction of antigen presentation (Figure 3).47 In turn, the activated granulocytes/PMNs secrete high amounts of IL-6,48 which can stimulate the IL-6 receptor on T cells and enhance their proliferation, survival, and migratory potential.49,50 Interestingly, patients with PTCL frequently harbor TET2 mutations within whole hematopoiesis. TET2 mutations contribute to the development of AITLs by propagating the development of clonal germinal center B cells, which induce the development of AITLs via the activation of the CD40/CD40 ligand axis.51 Furthermore, TET2 mutations enhance IL-6 secretion in myeloid cells.52 Interestingly, the L-6 deletion in microenvironmental cells nearly phenocopied the effect of total granulocyte depletion, enhanced mouse survival, reduced disease symptoms, and blocked TCL expansion in the ITK-SYK–driven TCL mouse model (Figure 7F-H), thus underlining the importance of microenvironment-driven factors for disease propagation.
The JAK/STAT signaling pathway is downstream to most involved cytokine receptors, such as IFN-γ signaling in granulocytes (Jak1/Jak2 and Stat1), IL-6 signaling (Jak1 and Stat3) in TCLs, and the promigratory signals via Cxcr3, Cxcl12 (both JAK1/2), and Jak3.15,49,53-57 Furthermore, JAK/STAT signaling can be directly activated by different TCL-driving oncogenes, such as ITK-SYK, ITK-FER, and NPM-ALK. ITK-SYK expression in a murine CD4+ T-cell line in vitro induced phosphorylation of Jak1, Tyk2, and Jak3 as well as Stat3, Stat5, and Stat6 (Figure 4). Interestingly, in the in vivo situation, we find an additional overexpression of Jak2 and Stat4 in ITK-SYK–expressing CD4+ T cells, most likely driven by microenvironmentally induced cytokine signaling via IL-12 or IL-18, which in turn could further enhance IFN-γ production (Figure 3).58 Because of the involvement of nearly all JAK kinases in these signaling processes, we used 2 broadly acting JAK inhibitors to prevent disease propagation and cytokine signaling. Ruxolitinib (which blocks JAK1/2 and TYK2) was highly effective in inhibiting TCL expansion, preventing aberrant CD4+ PTCL cell homing into the skin and other organs, completely blocking the secretion of IFN-γ and IL-6, and significantly enhancing mouse survival (Figures 5 and 6). Pacritinib, which inhibits Jak2/Tyk2 signaling but cannot block Jak1, also enhanced mouse survival but could not prevent the T-cell migration from the thymus into non-lymphoid organs, such as the skin, and could not block granulocyte activation and expansion or IFN-γ and IL-6 secretion. Our findings clearly support the important role of Jak1 in controlling the TCL disease and inflammation, but because pacritinib without blocking Jak1 also enhanced mouse survival and reduced Stat3/5 phosphorylation in malignant T cells, the other JAKs targeted by pacritinib (JAK2 and TYK2) might also contribute to disease severity.
Furthermore, in human AITL, follicular TCL, or PTCL-NOS the malignant clone often originates from the CD4+ T-cell population and can therefore secrete IFN-γ independent of the driver oncogene. Within this project, we managed to engraft 5 primary CD4+ PTCLs (2 AITL, 2 follicular PTCL, and 1 PTCL-NOS) into NOG mice, and were able to expand the cells using several generations of mice. Similar to our ITK-SYK mouse model, the innate immune system of the mice with CD4+ PTCL xenografts was activated, and we found a systemic inflammation along with granulocytosis and an upregulation of inflammatory cytokines, including IL-6 (Figure 6). The human/mouse mix system clearly showed that IFN-γ is exclusively produced by the human CD4+ T cells and that IL-6 is mainly secreted from the murine microenvironment (Figure 7). IL-6 was not only upregulated in the xenograft models but was also strongly enhanced in the serum of the original patients (Figure 7), which indicate an activated microenvironment in many patients with TFH-PTCL. Ruxolitinib treatment in the xenograft models and in the ITK-SYK mouse model efficiently suppressed the secretion of microenvironmentally produced IL-6 and also blocked TCL-induced IFN-γ production, supporting its role as a broadly acting inhibitor that targets both sides. Our results are clearly focused on TFH-PTCLs but might be applicable to all IFN-γ–producing TCLs, including other PTCL subtypes and even CD8+ TCLs.
Previous clinical trials demonstrated the efficacy of ruxolitinib in heavily pretreated late-stage TCLs, with a response rate of 30% and a clinical benefit rate of 45%.59,60 Moreover, JAK1 inhibitors demonstrated clinical efficacy, supporting the important role of JAK1 in TCL.61 Both trials did not systematically involve the observation of inflammatory symptoms or granulocyte activation including IL-6 secretion and did not measure IFN-γ levels produced by the malignant cells. The dependence of malignant cells on their microenvironment is usually strongest in the initial disease stages. Therefore, our aim is to design a clinical trial for ruxolitinib, focusing on patients in early disease stages and would include patients with severe inflammatory disease symptoms, and upfront inflammatory biomarker assessments (cytokine measurements, JAK/STAT activation, and granulocyte activation markers) to identify patients who might benefit most from broad JAK inhibition, which simultaneously targets lymphoma and inflammatory cells. In addition, the novel results regarding the involvement of germinal center B cells for FTH-PTCL development need to be addressed by either blocking the B cells directly or interfering with the CD40/CD40 ligand axis.
To our knowledge, the novelty of this study is, clearly, the strong involvement of granulocytes on disease progression in AITL and follicular PTCL as well as the identification of the associated positive autoregulatory cytokine loops and its possibility to interfere with this process by depleting granulocytes, by blocking IL-6 or downstream pathways involving Jak/Stat signaling, thus supporting the use of pan-JAK inhibitors, such as ruxolitinib, as a viable treatment strategy in early disease stages.
Acknowledgments
The authors thank Dieter Herchenbach and Klaus Geiger for their support in cell sorting, and Sabine Speier for her support with histology. Furthermore, the authors thank Sylvia Kock for the assistance with TCR rearrangement analysis. RNA samples were processed by Dietmar Pfeifer and Marlene Asal from the Genomics Facility at the University Medical Center Freiburg.
This work was supported by the Deutsche Krebshilfe grant 70112614, and by the Deutsche Forschungsgemeinschaft DFG-DI 1664/2-2, DFG-FOR 2033, and DFG-FOR 2674/1. The authors acknowledge funding from the Deutsche Forschungsgemeinschaft within the CRC1160 (Project ID 256073931-Z02) (M. Binder), CRC/TRR167 (Project ID 259373024-Z01) (M. Binder), CRC1453 (Project ID 431984000-S1) (M. Binder), and CRC1479 (Project ID: 441891347- S1) (M. Binder). The authors acknowledge funding from the German Federal Ministry of Education and Research within the Medical Informatics Funding Scheme (MIRACUM-FKZ 01ZZ1801B) (M. Binder) and EkoEstMed–FKZ 01ZZ2015 (G.A.).
Authorship
Contribution: A.J., T.M., S.M.M.G., S.K., D.C., S.O., C.K., C.M., D.B.-H., J.V.H., O.S., S.S., X.S. performed the experiments; A.J., S.M.M.G., and T.M. analyzed the data; M.F. provided technical support for cytometric bead array flow cytometer set-up and software analysis; D.P. performed sequencing; R.Z. provided the LyzMCre/CreMcl1fl/fl mouse model and discussed the results; N.v.B. provided ruxolitinib and provided advice; M. Boerries and G.A. performed sequencing analysis; C.W. and M. Bauer reassessed pathology from the original patients; A.J., P.F., M. Binder, T.W., and C.D. designed the research; and A.J., C.W., S.M.M.G., and C.D. wrote the manuscript.
Conflict-of-interest disclosure: The authors declare no competing financial interests.
Correspondence: Christine Dierks, Department of Hematology and Oncology, and stem cell transplantation, KIM IV, University Hospital Halle-Wittenberg, Germany, Ernst-Grube-Str. 40, D-06120 Halle, Germany; e-mail: christine.dierks@uk-halle.de.
References
Author notes
∗A.J. and S.M.M.G. contributed equally to this study.
The data generated in this article have been deposited in the Gene Expression Omnibus database (accession number GSE222050).
Data are available on request from the corresponding author, Christine Dierks (christine.dierks@uk-halle.de).
The online version of this article contains a data supplement.
The publication costs of this article were defrayed in part by page charge payment. Therefore, and solely to indicate this fact, this article is hereby marked “advertisement”in accordance with 18 USC section 1734.

![CD4+ malignant T cells contain the leukemic stem cell population in murine ITK-SYK+ PTCLs and drive an inflammatory phenotype including granulocyte expansion. (A) Schematic representation of ITK-SYK. blue, kinase domain. (B) Representative images of CD3-stained spleens of GFP control vs ITK-SYK+ mice. (C) Percentage of CD11b+Ly6G+ granulocytes within GFP+ or GFP− PB cells, the spleen, or BM cells of control BALB/c mice that received a transplantation with BM transduced with empty pMIG-vector (GFP mice; left) or with pMIG/ITK-SYK-vector (ITK-SYK mice; right) (n = 5 per group). Blood samples were taken on day 43 after transplantation and analyzed via flow cytometry (fluorescence-activated cell sorting [FACS]). (D) Representative images for CD11b staining showing granulocytes/macrophages within the BM of control mice and ITK-SYK+ mice. (E) Representative gating strategy for ITK-SYK+ malignant T-cell subtypes before sorting and secondary transplantation (day 43 after transplantation): GFP+ cells represent ITK-SYK–expressing cells, followed by CD3+ gating, and then distribution into CD4+, CD8+, CD4+CD8+, and CD4−CD8− cells. (F,G) Overall survival (OS) of lethally irradiated BALB/c mice that received transplantation with thymic or splenic ITK-SYK/GFP+ T-cell subsets (CD4+, CD8+, CD4+CD8+, or CD4−CD8− T cells) mixed with 1 × 10⁶ untreated BALB/c BM support cells. Thymic T cells transplanted were between 4000 and 15 000 per mouse (CD4+, n = 9; CD8+, n = 7; CD4+CD8+, n = 2; CD4−CD8−, n = 2) and spleen T cells were between 20 000 and 50 000 per mouse (CD4+, n = 4; CD8+, n = 9; CD4+CD8+, n = 2; CD4−CD8−, n = 5). Engraftment of ITK-SYK–expressing CD4+ and CD8+ T cells was independent of the number of transplanted cells, and the OS was monitored for 12 months. Lines representing thymic CD8+ and CD4+CD8+ T cells are hidden behind the line representing thymic CD4−CD8− cells. (H) Representative images of tails and ears of mice that received retransplantation with ITK-SYK+ CD4+ cells from the thymus or spleen. (I-L) Comparative analysis of mice that either received transplantation with control BM only (gray bar, n = 5) or combined with sorted ITK-SYK+ CD4+ T cells from the thymus (n = 5) or spleen (n = 4) of ITK-SYK+ mice (red bars). (I) Comparison of phenotypic score (supplemental Table 1) using weight loss, and tail, ear, and skin infiltration as indicators for TCL manifestation and inflammation. Comparison of (J) spleen weight, (K) percentage of lymphocytes in the PB, and (L) percentage of granulocytes in the PB at the time of death or after 12 months at termination of the experiment. n.d, not detected; PH, pleckstrin-homology domain; ReTx, retransplantation; TH, Tec-homology domain.](https://ash.silverchair-cdn.com/ash/content_public/journal/blood/141/23/10.1182_blood.2022015653/2/m_blood_bld-2022-015653r3-gr1.jpeg?Expires=1763796663&Signature=c61B3I~qkz4zkPhb~jUgLuzPuKh-d~zge1XEbYFn13hiC5yFb-uPKP9MbgIjsdz2kDPgtCAWt7BZcYzXnJVdbo7c0uaFt~gCJM08ZM2zftOUDZZzOmwBZRs1wthYueigB60vk5c09m6SuXubunFaClNXt3TvH27D56gQTDO2ziWZB49j7EHUCQVWHKmiDPotwMKy9H9nMGK96kIaXD1eO6svVPIb5b1Nq4Yi4v-F9WJPHTkfC0KAY7R7t9M6p5UipF9089sdygIPZFojEtGwqxp29NB5fBs2Mz1NpmL~zuEaTGHCe91uAkpgpAbAQ-UBrQFP-xrw0yBMxWthk~ppFg__&Key-Pair-Id=APKAIE5G5CRDK6RD3PGA)



![CD4+ malignant T cells contain the leukemic stem cell population in murine ITK-SYK+ PTCLs and drive an inflammatory phenotype including granulocyte expansion. (A) Schematic representation of ITK-SYK. blue, kinase domain. (B) Representative images of CD3-stained spleens of GFP control vs ITK-SYK+ mice. (C) Percentage of CD11b+Ly6G+ granulocytes within GFP+ or GFP− PB cells, the spleen, or BM cells of control BALB/c mice that received a transplantation with BM transduced with empty pMIG-vector (GFP mice; left) or with pMIG/ITK-SYK-vector (ITK-SYK mice; right) (n = 5 per group). Blood samples were taken on day 43 after transplantation and analyzed via flow cytometry (fluorescence-activated cell sorting [FACS]). (D) Representative images for CD11b staining showing granulocytes/macrophages within the BM of control mice and ITK-SYK+ mice. (E) Representative gating strategy for ITK-SYK+ malignant T-cell subtypes before sorting and secondary transplantation (day 43 after transplantation): GFP+ cells represent ITK-SYK–expressing cells, followed by CD3+ gating, and then distribution into CD4+, CD8+, CD4+CD8+, and CD4−CD8− cells. (F,G) Overall survival (OS) of lethally irradiated BALB/c mice that received transplantation with thymic or splenic ITK-SYK/GFP+ T-cell subsets (CD4+, CD8+, CD4+CD8+, or CD4−CD8− T cells) mixed with 1 × 10⁶ untreated BALB/c BM support cells. Thymic T cells transplanted were between 4000 and 15 000 per mouse (CD4+, n = 9; CD8+, n = 7; CD4+CD8+, n = 2; CD4−CD8−, n = 2) and spleen T cells were between 20 000 and 50 000 per mouse (CD4+, n = 4; CD8+, n = 9; CD4+CD8+, n = 2; CD4−CD8−, n = 5). Engraftment of ITK-SYK–expressing CD4+ and CD8+ T cells was independent of the number of transplanted cells, and the OS was monitored for 12 months. Lines representing thymic CD8+ and CD4+CD8+ T cells are hidden behind the line representing thymic CD4−CD8− cells. (H) Representative images of tails and ears of mice that received retransplantation with ITK-SYK+ CD4+ cells from the thymus or spleen. (I-L) Comparative analysis of mice that either received transplantation with control BM only (gray bar, n = 5) or combined with sorted ITK-SYK+ CD4+ T cells from the thymus (n = 5) or spleen (n = 4) of ITK-SYK+ mice (red bars). (I) Comparison of phenotypic score (supplemental Table 1) using weight loss, and tail, ear, and skin infiltration as indicators for TCL manifestation and inflammation. Comparison of (J) spleen weight, (K) percentage of lymphocytes in the PB, and (L) percentage of granulocytes in the PB at the time of death or after 12 months at termination of the experiment. n.d, not detected; PH, pleckstrin-homology domain; ReTx, retransplantation; TH, Tec-homology domain.](https://ash.silverchair-cdn.com/ash/content_public/journal/blood/141/23/10.1182_blood.2022015653/2/m_blood_bld-2022-015653r3-gr1.jpeg?Expires=1764642839&Signature=nddOhDSY6Hrqx~2HrNrV1uxaUCoG-q-DqaApfeFXvuWNgTXxD1WWfxFuzPzNbRZT4zciM78~ASaUSrzyDVtQIO2imKAyCqfaAiktoaD8iBd~ftUJMEoEookt-JyQsggqOouHeGJcUQgrqM3uGznjsd1xKzS9GZCI0DQOR7btL8SmFHg76LoiVqeA807qCmIO2vBS51zKSYehxDdVwv5U9kWFQ9CnEZnc-KOyUFZwELGD2ReoSsz0ym9XHFoR-Lxn4uGMiN5ginkdI1lOpnr5jTs4y2XJ3tazj7z5-ZU9wUqzq5kJ8-DYtEvMetj-4QiQJn~s1fDcKTp2rTCqnZq9Yg__&Key-Pair-Id=APKAIE5G5CRDK6RD3PGA)
