Key Points
Treatment of FLT3 internal tandem duplication AML with FLT3 inhibitors results in upregulation of inflammatory pathways in DTPs.
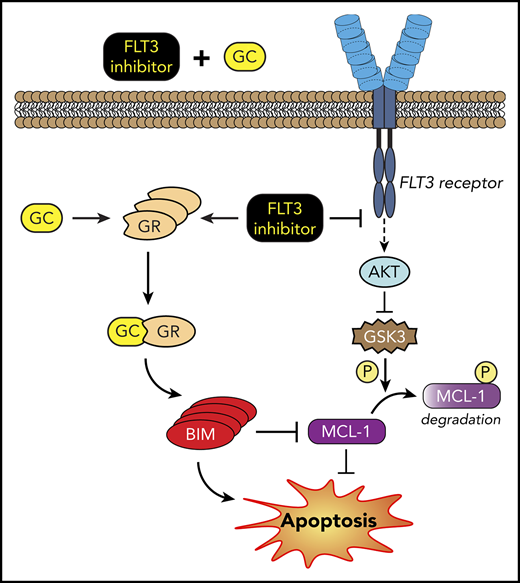
Anti-inflammatory GCs in combination with FLT3 inhibitors decrease DTPs by upregulating BIM and downregulating MCL-1.

Abstract
FLT3 is a frequently mutated gene that is highly associated with a poor prognosis in acute myeloid leukemia (AML). Despite initially responding to FLT3 inhibitors, most patients eventually relapse with drug resistance. The mechanism by which resistance arises and the initial response to drug treatment that promotes cell survival is unknown. Recent studies show that a transiently maintained subpopulation of drug-sensitive cells, so-called drug-tolerant "persisters" (DTPs), can survive cytotoxic drug exposure despite lacking resistance-conferring mutations. Using RNA sequencing and drug screening, we find that treatment of FLT3 internal tandem duplication AML cells with quizartinib, a selective FLT3 inhibitor, upregulates inflammatory genes in DTPs and thereby confers susceptibility to anti-inflammatory glucocorticoids (GCs). Mechanistically, the combination of FLT3 inhibitors and GCs enhances cell death of FLT3 mutant, but not wild-type, cells through GC-receptor–dependent upregulation of the proapoptotic protein BIM and proteasomal degradation of the antiapoptotic protein MCL-1. Moreover, the enhanced antileukemic activity by quizartinib and dexamethasone combination has been validated using primary AML patient samples and xenograft mouse models. Collectively, our study indicates that the combination of FLT3 inhibitors and GCs has the potential to eliminate DTPs and therefore prevent minimal residual disease, mutational drug resistance, and relapse in FLT3-mutant AML.
Introduction
Acute myeloid leukemia (AML) is a hematological malignancy characterized by an abnormal differentiation and proliferation of myeloid lineage cells.1 Despite current treatment procedures that consist of intensive chemotherapy and bone marrow transplant, AML remains a fatal disease with a 5-year survival rate of <30%.1 The identification of genes involved in leukemic transformation has opened the door to numerous targeted drug discovery efforts. FLT3, a class-III receptor tyrosine kinase, is one of the most sought out targets in AML. Upon binding its ligand, FLT3 drives cellular proliferation through activation of the MAPK, phosphatidylinositol 3-kinase (PI3K), and STAT5 signaling pathways.2 In AML, constitutive ligand-independent activation of the kinase, due to either internal tandem duplication (ITD) of the juxtamembrane domain or point mutations in the kinase domain of the FLT3 gene, occurs in ∼25% and 7% of AML cases, respectively.2,3 Patients with overexpression or mutation of FLT3 have a high relapse rate and poor overall prognosis, making it an attractive drug target.4,5
Recently, the multikinase inhibitor midostaurin and the dual FLT3/AXL inhibitor gilteritinib were approved by the US Food and Drug Administration (FDA) for the treatment of AML patients with FLT3 mutation.6,7 Several other FLT3-selective inhibitors, including quizartinib (AC220), are currently in advanced clinical development.8,9 In phase 1 and 2 trials, quizartinib was shown to be well tolerated and efficacious, as ∼50% of patients with FLT3-ITD AML refractory to prior therapy achieved a composite complete remission.9,10 However, the duration of response to FLT3 inhibitors is almost always short-lived before patients relapse and become resistant to further treatment.11,12 Thus, further investigation into the mechanisms of drug resistance to FLT3 inhibitors is warranted.
In recent years, there has been a growing interest in preventing drug resistance by targeting the initial stages of resistance before mutations are acquired. Sharma et al demonstrated that a subpopulation of epidermal growth factor receptor–mutant non-small cell lung cancer cells enter a nonmutational and reversibly resistant “persister” state in order to survive a high-dose treatment with an epidermal growth factor receptor–targeted inhibitor.13 They termed these cells “drug-tolerant persisters” (DTPs).13 Following this seminal paper, other studies have identified and characterized DTPs in various cancer models using targeted drugs as well as chemotherapy.14-16 Since DTPs are the cause of measurable/minimal residual disease and may comprise a population of cells that evolve to acquire resistance-conferring mutations, it is crucial to understand the mechanism of survival of these cells and determine how they can rationally be targeted.
In this study, we sought to investigate the drug-induced signaling changes that allow survival of the so-called DTPs during targeted therapy in FLT3-mutant AML. Here, we identify upregulation of inflammatory pathways as the immediate response to quizartinib treatment, which is maintained during the persister state. We establish that these DTPs upregulate glucocorticoid receptor (GR) expression which, along with increased inflammatory pathways, renders them sensitive to the combination treatment of FLT3 inhibitors with anti-inflammatory glucocorticoids (GCs). Finally, we demonstrate that the mechanism of enhanced cell death by the combination treatment is driven by the simultaneous downregulation of antiapoptotic MCL-1 and upregulation of proapoptotic BIM proteins.
Materials and methods
Cell cultures
MV4-11 (ACC-102; DSMZ, Braunschweig, Germany), MOLM13 (ACC-554; DSMZ), Kasumi-1 (CRL-2724; ATCC, Manassas, VA), and THP-1 (TIB-202; ATCC) human AML cell lines were cultured in Iscove modified Dulbecco medium or RPMI (Invitrogen, Carlsbad, CA) supplemented with 10% fetal bovine serum (Sigma-Aldrich, St. Louis, MO). BAF3-FLT3-ITD cell line was a generous gift from Kapil Bhalla (The University of Texas MD Anderson Cancer Center, Houston, TX) and was cultured in RPMI plus 10% fetal bovine serum. DTPs were generated by treating cell lines with 10 or 100 nM FLT3 inhibitors for 48 hours and isolating surviving cells using Ficoll-Paque centrifugation. Cryopreserved primary human bone marrow or peripheral blood samples for the ex vivo studies were obtained from AML patients who provided informed consent in accordance with Penn State Institutional Review Board. Cells were cultured in SFEM media (STEMCELL Technologies, Vancouver, BC, Canada) supplemented with human FLT3LG, human stem cell factor, human granulocyte-macrophage colony-stimulating factor, human granulocyte colony-stimulating factor, and human interleukin-3 (PeproTech, Rocky Hill, NJ) for 48 hours in 24-well plates at a density of 2 × 10⁵ cells/mL in a total of 1 mL per well. After 48 hours in culture, drugs or vehicle was added and incubated for additional 48 hours before harvesting cells for further analysis.
Transcriptome analysis
RNA-sequencing data are available on the Gene Expression Omnibus under accession number GSE116432.
Drug screening
DTPs and parental cells were seeded in a 384-well plate (12 500 cells/well in 25 µL media) and treated with drugs (1500 FDA-approved drugs from Prestwick chemical library) at a final concentration of 10 μM in 0.1% dimethyl sulfoxide (DMSO) for 48 hours. Cell viability was assessed using CellTiter-Glo (Promega, Madison, WI). Percent viability of DTPs and parental cells was normalized to DMSO controls.
Statistical analysis
GraphPad Prism 7 software was used to evaluate statistical significance using an unpaired, 2-tailed Student t test or analysis of variance with multiple comparisons and Tukey post hoc analysis. Values of P < .05 were assigned significance (**P < .01; ***P < .001; ****P < .0001; ns, not significant). Error bars in all figures indicate standard deviation.
Additional materials and methods are provided in the supplemental Methods (available on the Blood Web site).
Results
Quizartinib induces upregulation of inflammatory pathway in DTPs and increases sensitivity to anti-inflammatory drugs
To study the cellular response to FLT3-targeted therapy, we used the human AML cell line MV4-11, which harbors a homozygous FLT3-ITD mutation. MV4-11 cells are highly sensitive to the FLT3-selective inhibitors quizartinib and gilteritinib and the multikinase FLT3 inhibitors midostaurin and sorafenib, with 50% inhibitory concentrations in the low nanomolar ranges17 (supplemental Figure 1A). To study the initial response to acute cytotoxic FLT3 inhibition, we treated MV4-11 cells with 100 nM of each of the FLT3 inhibitors. Forty-eight hours after treatment, we conducted fluorescence activated cell sorter (FACS) analysis of live and dead cells using Annexin-V and 7-AAD staining. We observed that an average of 40% to 50% of cells survived 48 hours of drug exposure (Figure 1A), with longer durations of drug treatment resulting in increased cell death and the survival of a smaller subpopulation of cells (supplemental Figure 1B). Similar to a previously described DTP phenotype,13,18 the surviving cells displayed cell-cycle arrest (Figure 1B) and resistance to further quizartinib treatment (Figure 1C). We used cells derived from independent single clones to demonstrate that the observed resistance is unlikely to have occurred due to preexisting cells harboring resistance-conferring mutations (supplemental Figure 1C). The data also demonstrate that the drug-tolerant phenotype is transient, as their sensitivity reverts back to the parental (herein used to denote the bulk population of untreated cells) levels after culture in drug-free media for 28 days (supplemental Figure 1C).
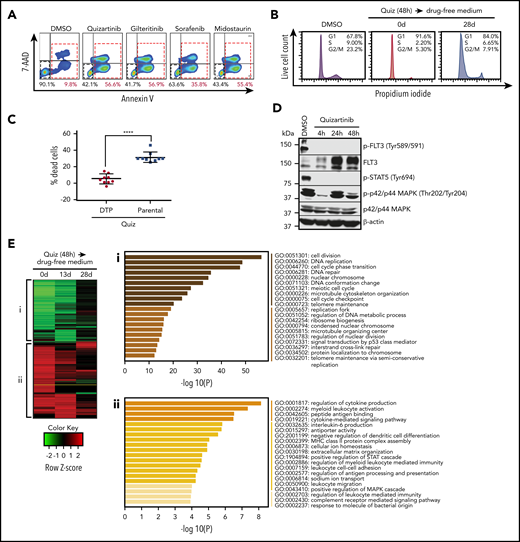
DTPs survive lethal doses of FLT3 inhibitors by upregulating inflammatory pathways. (A) Representative images (n = 3) of FACS analysis of MV4-11 cells following treatment with 100 nM quizartinib, gilteritinib, midostaurin, and sorafenib for 48 hours. Cells are labeled with APC-Annexin-V and 7-AAD. (B) Cell-cycle analysis was performed after MV4-11 cells were treated with DMSO or 100 nM quizartinib (Quiz) for 48 hours immediately after treatment (0 days) or after recovery in drug-free media for 28 days. Surviving cells were isolated by Ficoll centrifugation, stained with propidium iodide, and analyzed by FACS. (C) DTPs were isolated by Ficoll centrifugation after 48 hours of quizartinib treatment. The surviving DTPs as well as untreated parental cells were used for quantification of dead cells (Annexin-V positive) by APC-Annexin-V and 7-AAD staining and FACS analysis following further treatment with DMSO or 100 nM quizartinib for 48 hours (data normalized to DMSO control). (D) A representative immunoblot (n = 3) showing that phosphorylation of FLT3 and STAT5, but not p42/44 MAPK, is abolished in DTPs (MV4-11 cells that survived 100 nM quizartinib treatment of the indicated times). (E) A heat map of differentially expressed genes relative to untreated parental MV4-11 cells at the indicated time points (green, downregulated; red, upregulated). Pathway analysis of downregulated (i) and upregulated (ii) genes at 48 hours after treatment with 100 nM quizartinib. RNA-sequencing was conducted in 3 independent experiments with similar results. GO, Gene Ontology.
DTPs survive lethal doses of FLT3 inhibitors by upregulating inflammatory pathways. (A) Representative images (n = 3) of FACS analysis of MV4-11 cells following treatment with 100 nM quizartinib, gilteritinib, midostaurin, and sorafenib for 48 hours. Cells are labeled with APC-Annexin-V and 7-AAD. (B) Cell-cycle analysis was performed after MV4-11 cells were treated with DMSO or 100 nM quizartinib (Quiz) for 48 hours immediately after treatment (0 days) or after recovery in drug-free media for 28 days. Surviving cells were isolated by Ficoll centrifugation, stained with propidium iodide, and analyzed by FACS. (C) DTPs were isolated by Ficoll centrifugation after 48 hours of quizartinib treatment. The surviving DTPs as well as untreated parental cells were used for quantification of dead cells (Annexin-V positive) by APC-Annexin-V and 7-AAD staining and FACS analysis following further treatment with DMSO or 100 nM quizartinib for 48 hours (data normalized to DMSO control). (D) A representative immunoblot (n = 3) showing that phosphorylation of FLT3 and STAT5, but not p42/44 MAPK, is abolished in DTPs (MV4-11 cells that survived 100 nM quizartinib treatment of the indicated times). (E) A heat map of differentially expressed genes relative to untreated parental MV4-11 cells at the indicated time points (green, downregulated; red, upregulated). Pathway analysis of downregulated (i) and upregulated (ii) genes at 48 hours after treatment with 100 nM quizartinib. RNA-sequencing was conducted in 3 independent experiments with similar results. GO, Gene Ontology.
To investigate if the surviving cells, hereafter referred to as DTPs, reactivate FLT3 signaling or upregulate drug efflux for survival and drug tolerance, we analyzed the phosphorylation of FLT3 and downstream targets following treatment with quizartinib for 4, 24, and 48 hours (Figure 1D). Despite the upregulation of FLT3 receptor following quizartinib treatment, as previously noted,19 neither phosphorylated FLT3 nor phosphorylated STAT5 was detected in the viable cells at any time point, suggesting that reactivation of FLT3 signaling is not the mechanism by which DTPs survive. Interestingly, MAPK signaling was reactivated within 24 hours of treatment despite the blockade in FLT3 signaling. While this has been previously reported,20 it suggests that activation of MAPK signaling may represent an alternative survival pathway.
Next, in an effort to identify drug-induced rewiring of signaling that underlies survival of DTPs, we performed a genome-wide comparative transcriptome analysis. RNA sequencing was performed at 3 time points after 48-hour treatment with quizartinib: 0 days (immediate) and following 13- or 28-day culture in drug-free media. A heat map of differentially expressed genes (DEGs) (over 1.5-fold difference) at these three time points showed striking and similar changes in gene expression both immediately following treatment and after 13 days of subsequent culture in drug-free media compared with untreated parental cells (Figure 1E). Notably, by day 28 in drug-free media, the gene expression changes reverted back to a parental phenotype (Figure 1E), mirroring the transient drug-resistance and cell-cycle arrest phenotype13 (Figure 1B; supplemental Figure 1C). Pathway analysis of DEGs indicated that cell-cycle pathways were downregulated by quizartinib treatment, as expected (Figure 1Ei). Interestingly, analysis of upregulated genes showed a significant enrichment in inflammatory pathways (Figure 1Eii). These unique gene expression signatures were maintained in viable cells isolated after 5 days of continuous treatment with quizartinib (supplemental Figure 1D), suggesting that the transcriptomic features associated with the remaining subpopulation of DTPs after a prolonged treatment are acquired and can be targeted as early as 48 hours.
Proteins encoded by the DEGs obtained at 48 hours after treatment were used for in silico prediction of “druggable” targets in DTPs (Figure 2A). First, we built high-quality protein-protein interactions using STRING and BioGRID databases. We then compiled 472 protein-protein interactions connecting 469 proteins encoded by the DEGs in DTPs and computed a comprehensive set of topological parameters using the Network Analyzer of Cytoscape. Proteins with high node degrees (the number of other nodes that directly interact with the node of investigation) or high betweenness centrality (an indicator of a node’s centrality in a network) and their corresponding DEGs were identified and prioritized (supplemental Figures 2A-C). The Connectivity Map was applied to search and prioritize drugs that could reverse the gene expression signature identified so that drugs that have a high potential to repress or kill DTPs are prioritized. The anti-inflammatory drug celecoxib is one such drug identified using this strategy (supplemental Table 1). Similarly, other anti-inflammatory drugs, such as dexamethasone and fluticasone propionate, were identified as possible DTP inhibitors (supplemental Table 2) using the Ingenuity Pathway Analysis (IPA) upstream regulators and chemical inhibitors prediction tool.
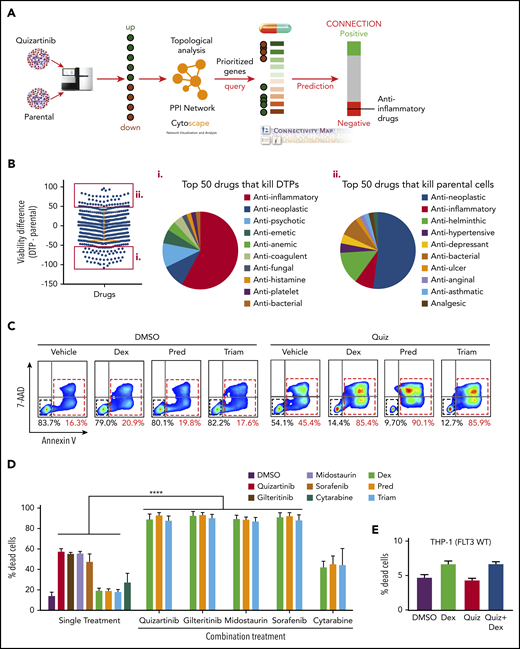
Anti-inflammatory drugs enhance the cytotoxicity of FLT3 inhibitors in FLT3-mutant AML cells. (A) Analysis scheme used to identify druggable targets in DTPs. (B) Drug screening of DTPs and parental MV4-11 cells using a library of 1500 FDA-approved drugs. Cells were incubated with the drug library for 48 hours, and viability was measured using CellTiter-Glo. The top 50 drugs that selectively kill DTPs or parental cells are highlighted by red boxes. Pie chart shows the top 50 drugs that selectively kill DTPs (i) or parental cells (ii). (C) Representative images (n = 4) of FACS analysis of APC-Annexin-V and 7-AAD stained MV4-11 cells following treatment with quizartinib (100 nM) alone or in combination with 50 µM dexamethasone (Dex), prednisolone (Pred), or triamcinolone (Triam) for 48 hours. (D-E) Combined analysis of replicate experiments to quantify dead cells (Annexin-V positive) using APC-Annexin-V and 7-AAD staining and FACS analysis for the indicated drug combinations (100 nM FLT3 inhibitors, 1 µM cytarabine, and 50 µM GCs) in MV4-11 (D) and THP1 (E) cells. WT, wild-type.
Anti-inflammatory drugs enhance the cytotoxicity of FLT3 inhibitors in FLT3-mutant AML cells. (A) Analysis scheme used to identify druggable targets in DTPs. (B) Drug screening of DTPs and parental MV4-11 cells using a library of 1500 FDA-approved drugs. Cells were incubated with the drug library for 48 hours, and viability was measured using CellTiter-Glo. The top 50 drugs that selectively kill DTPs or parental cells are highlighted by red boxes. Pie chart shows the top 50 drugs that selectively kill DTPs (i) or parental cells (ii). (C) Representative images (n = 4) of FACS analysis of APC-Annexin-V and 7-AAD stained MV4-11 cells following treatment with quizartinib (100 nM) alone or in combination with 50 µM dexamethasone (Dex), prednisolone (Pred), or triamcinolone (Triam) for 48 hours. (D-E) Combined analysis of replicate experiments to quantify dead cells (Annexin-V positive) using APC-Annexin-V and 7-AAD staining and FACS analysis for the indicated drug combinations (100 nM FLT3 inhibitors, 1 µM cytarabine, and 50 µM GCs) in MV4-11 (D) and THP1 (E) cells. WT, wild-type.
To test whether the gene expression changes result in therapeutic vulnerabilities, we performed a simultaneous and independent drug screening using 1500 FDA-approved drugs (Figure 2B). First, DTPs were generated by treating MV4-11 cells with 100 nM quizartinib for 48 hours followed by isolation of surviving cells by Ficoll-Paque density centrifugation. Then, DTPs and parental cells were subjected to 48-hour treatment with 10 µM of the drug library, and the cell viability percentage was normalized to cells treated with DMSO. Similar to the differential gene expression pattern and the in silico prediction, the drug screen showed that ∼60% of the top 50 drugs that selectively kill DTPs were anti-inflammatory drugs, specifically glucocorticoids (GCs) (Figure 2Bi; supplemental Table 3), while the parental cells were most sensitive to antineoplastic drugs (Figure 2Bii). Collectively, 3 independent methods (RNA sequencing, in silico prediction, and drug screening) suggest that inflammatory pathways play a role in survival of DTPs upon FLT3 inhibition.
GCs enhance the antileukemic efficacy of FLT3 inhibitors in FLT3-mutant AML
To validate the drug-screening results, we selected 3 anti-inflammatory GCs from the top 50 hits that are most commonly used in the clinic (dexamethasone, prednisolone, and triamcinolone). As these drugs selectively killed DTPs, but not parental cells, we tested their synergy with quizartinib and other FLT3 inhibitors. Importantly, GCs did not show any single-agent cell toxicity even at high doses (Figure 2C; supplemental Figure 3A). However, combination treatment of quizartinib with each of the GCs resulted in significantly enhanced killing, as the percent cell death after 48 hours increased from 40% to 50% with quizartinib monotherapy to 80% to 90% with combination treatment (Figure 2C). Furthermore, a similar result was observed when GCs were combined with other FLT3 inhibitors, midostaurin, gilteritinib, and sorafenib (Figure 2D) and in other FLT3 mutant cell lines, including MOLM13 and BAF3 cells transduced with FLT3-ITD (supplemental Figure 3B-C). In contrast, combination treatment of GCs with cytarabine, a chemotherapeutic drug used clinically to treat AML, did not demonstrate the same enhanced cell death observed with FLT3 inhibitors (Figure 2D; supplemental Figure 3B). Furthermore, synergy between quizartinib and dexamethasone was not observed in THP-1 (Figure 2E) and Kasumi-1 (supplemental Figure 3D) cells, 2 AML cell lines harboring wild-type FLT3.
We next performed a formal synergy analysis using the surface model of 0 interaction potency, which compares the change in the potency of individual drug-response curves to that of their combinations.21 The synergy score is visualized as a 3-dimensional interaction surface over quizartinib and dexamethasone dose matrix (supplemental Figure 4A) whereby red regions denote synergistic doses with their corresponding synergy scores in the z-axis (Figure 3A). A similar synergy was observed when dexamethasone was combined with quizartinib or gilteritinib in both MV4-11 and MOLM13 cells (supplemental Figure 4B-G).
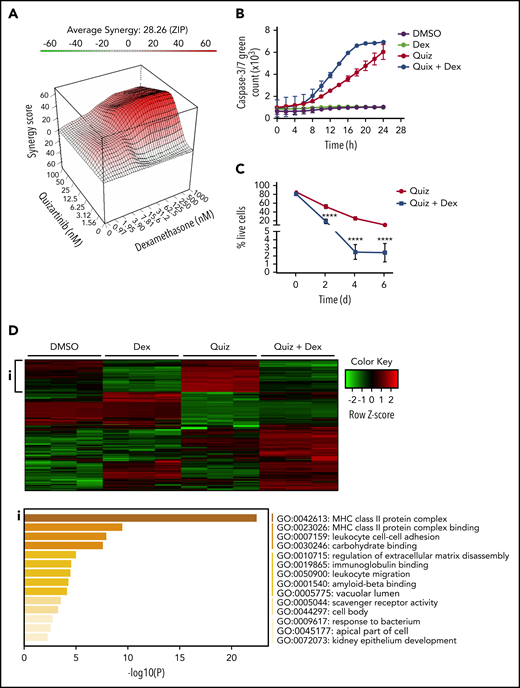
Dexamethasone synergizes with quizartinib in FLT3-ITD AML by reversing the inflammatory gene signature. (A) Three-dimensional graph showing the synergy score of quizartinib and dexamethasone combination in MV4-11 cells (48 hours). ZIP, 0 interaction potency. (B) IncuCyte live tracking of activated caspase-3/7 (total green fluorescence) in MV4-11 cells treated with quizartinib (100 nM) and dexamethasone (50 µM) alone or in combination. (C) Combined analysis of replicate experiments to quantify live cells (Annexin V and 7-AAD negative) using FACS analysis for the indicated time points and drug treatments (10 nM quizartinib and 100 nM dexamethasone) in MV4-11 cells. (D) A heat map of differentially expressed genes (green, downregulated; red, upregulated) in MV4-11 cells treated for 48 hours with the indicated drugs (10 nM quizartinib and 100 nM dexamethasone). Pathway analysis shows genes upregulated in quizartinib-treated cells and downregulated in cells treated with the combination of quizartinib and dexamethasone (i). RNA sequencing was conducted in 3 biological replicates. MHC, major histocompatibility complex.
Dexamethasone synergizes with quizartinib in FLT3-ITD AML by reversing the inflammatory gene signature. (A) Three-dimensional graph showing the synergy score of quizartinib and dexamethasone combination in MV4-11 cells (48 hours). ZIP, 0 interaction potency. (B) IncuCyte live tracking of activated caspase-3/7 (total green fluorescence) in MV4-11 cells treated with quizartinib (100 nM) and dexamethasone (50 µM) alone or in combination. (C) Combined analysis of replicate experiments to quantify live cells (Annexin V and 7-AAD negative) using FACS analysis for the indicated time points and drug treatments (10 nM quizartinib and 100 nM dexamethasone) in MV4-11 cells. (D) A heat map of differentially expressed genes (green, downregulated; red, upregulated) in MV4-11 cells treated for 48 hours with the indicated drugs (10 nM quizartinib and 100 nM dexamethasone). Pathway analysis shows genes upregulated in quizartinib-treated cells and downregulated in cells treated with the combination of quizartinib and dexamethasone (i). RNA sequencing was conducted in 3 biological replicates. MHC, major histocompatibility complex.
To determine whether the combination treatment caused apoptotic cell death, we tracked caspase-3/7 activation in MV4-11 cells over a 24-hour period. Quizartinib alone induced caspase-3/7 activation in a time-dependent manner, while dexamethasone alone showed similar level of caspase-3/7 activation as DMSO control. Notably, the combination of quizartinib and dexamethasone enhanced the rate of caspase-3/7 activation (Figure 3B). To address whether the addition of GCs simply accelerates cell death or recruits more cells into cell death upon prolonged exposure, MV4-11 or MOLM13 cells were treated with quizartinib alone or quizartinib plus dexamethasone and monitored for 2, 4, or 6 days. Notably, the synergy was sustained with longer treatment duration in both MV4-11 and MOLM13 cells (Figure 3C; supplemental Figure 4H) to suggest that the addition of GCs targets the unique drug-induced vulnerabilities of DTPs rather than simply accelerating the kinetics of cell death.
Consistently, RNA-sequencing analysis revealed that the inflammatory pathways upregulated by quizartinib treatment (both after 48 hours and 5 days) were dramatically reversed by the addition of dexamethasone (Figure 3D-i; supplemental Figure 5A). Furthermore, transcriptional regulators and cytokines involved in inflammatory pathways that were predicted to be activated in quizartinib-treated cells were predicted to be inhibited in cells treated with the combination of quizartinib and dexamethasone (supplemental Tables 4-7).
Collectively, these results suggest that compensatory prosurvival signaling changes induced by FLT3 inhibition can be successfully targeted with anti-inflammatory GCs in FLT3 mutant, but not wild-type, AML cells.
Dexamethasone enhances the antileukemic efficacy of quizartinib in FLT3-mutated AML patient samples ex vivo and AML mouse models in vivo
Next, we tested whether the combination treatment enhances cell death in FLT3 mutant AML patient blood or bone marrow cells ex vivo (supplemental Table 8). Similar to the results observed in cell lines, cotreatment of quizartinib and dexamethasone significantly augmented cell death in the majority of FLT3 mutant patient cells explored (5 out of 9 patients) (Figure 4A-B). In concordance with the in vitro findings, no synergy was observed when wild-type FLT3 patient samples were exposed to combination treatment (4 out of 4) (Figure 4B).
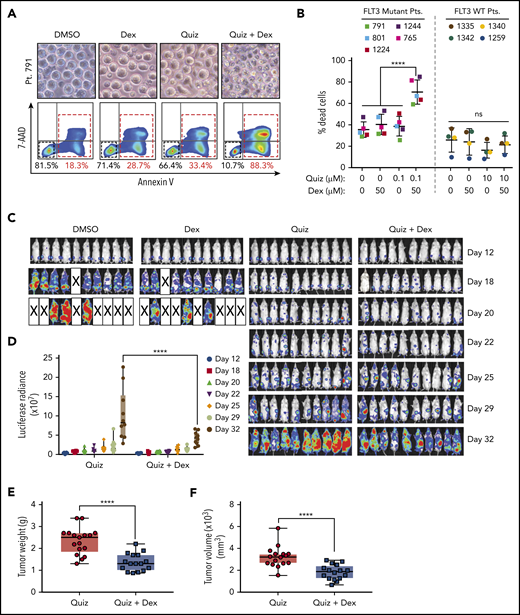
Dexamethasone enhances the antileukemic efficacy of quizartinib in FLT3-mutated AML patient samples ex vivo and AML mouse models in vivo. (A) Representative microscopy images of patient 791 cells treated with DMSO, 100 nM quizartinib, 50 µM dexamethasone, or the combination for 48 hours and corresponding FACS images of cells labeled with APC-Annexin-V and 7-AAD. (B) Quantification of FACS analysis of cell death in 5 FLT3 mutant and 4 wild-type AML patient (Pt) cells treated with the indicated drugs and concentration for 48 hours. (C) In vivo bioluminescence imaging of NSG mice orthotopically xenografted with MOLM13-Luc cells and treated with the indicated drugs or vehicle. Images were obtained at the indicated time points. (D) Bioluminescence quantification of C. Tumor weight (E) and tumor volume (F) of NSG mice subcutaneously xenografted with MOLM13 cells and treated with the indicated drugs for 20 days after 10 days of tumor engraftment.
Dexamethasone enhances the antileukemic efficacy of quizartinib in FLT3-mutated AML patient samples ex vivo and AML mouse models in vivo. (A) Representative microscopy images of patient 791 cells treated with DMSO, 100 nM quizartinib, 50 µM dexamethasone, or the combination for 48 hours and corresponding FACS images of cells labeled with APC-Annexin-V and 7-AAD. (B) Quantification of FACS analysis of cell death in 5 FLT3 mutant and 4 wild-type AML patient (Pt) cells treated with the indicated drugs and concentration for 48 hours. (C) In vivo bioluminescence imaging of NSG mice orthotopically xenografted with MOLM13-Luc cells and treated with the indicated drugs or vehicle. Images were obtained at the indicated time points. (D) Bioluminescence quantification of C. Tumor weight (E) and tumor volume (F) of NSG mice subcutaneously xenografted with MOLM13 cells and treated with the indicated drugs for 20 days after 10 days of tumor engraftment.
Moreover, the antileukemic effect of quizartinib and dexamethasone combination treatment was assessed using orthotopic and subcutaneous mouse models. Mice injected IV with MOLM13 cells exhibited a significantly lower leukemic burden with quizartinib and dexamethasone combination treatment compared with quizartinib alone, while dexamethasone alone had no benefit (Figure 4C-D; supplemental Figure 5B-C). However, we could not observe an overall survival advantage with the combination treatment, because mice receiving the combination treatment exhibited a significant drop in body weight by day 28 that is likely attributed to the toxicity of prolonged daily treatment with dexamethasone (supplemental Figure 5D).
Similarly, mice subcutaneously injected with MOLM13 cells showed a significant decrease in tumor growth, as measured by tumor weight and tumor volume, when treated with the combination compared with quizartinib alone (Figure 4E-F). Mice treated with vehicle and dexamethasone died or were euthanized by day 20 of xenograft due to disease burden in both AML mouse models.
Overall, both the ex vivo and in vivo data further support the enhanced therapeutic effects of FLT3 inhibitors and GCs against FLT3-mutated AML.
Synergistic cell death is derived by GR-dependent BIM upregulation and proteasome-dependent MCL-1 degradation
Since sensitivity to GCs is associated with increased glucocorticoid receptor (GR) expression,22,23 we hypothesized that quizartinib-treated cells would have a higher GR expression. Markedly, GR expression was increased by over twofold following FLT3 inhibition (Figure 5A-B). To test if the synergy of GCs with quizartinib is mediated through direct action of GCs on GR, we used clustered regularly interspaced short palindromic repeats (CRISPR)-Cas9 to knock out GR in MV4-11 cells (Figure 5C). We then treated wild-type and GR-knockout cells with quizartinib and dexamethasone alone and in combination. While GR-knockout cells maintained the same sensitivity to quizartinib as wild-type cells, the synergistic cell death observed with the combination treatment was completely abolished in GR-knockout cells, even with a high concentration of dexamethasone, suggesting that the observed synergy is an on-target effect (Figure 5D).
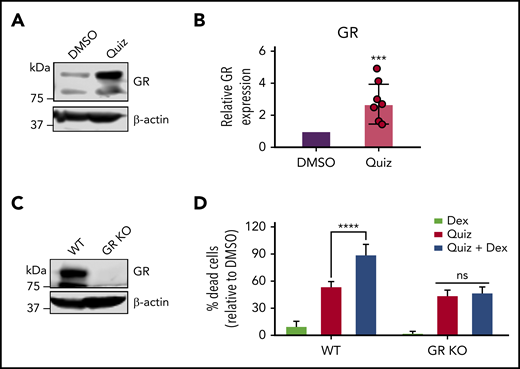
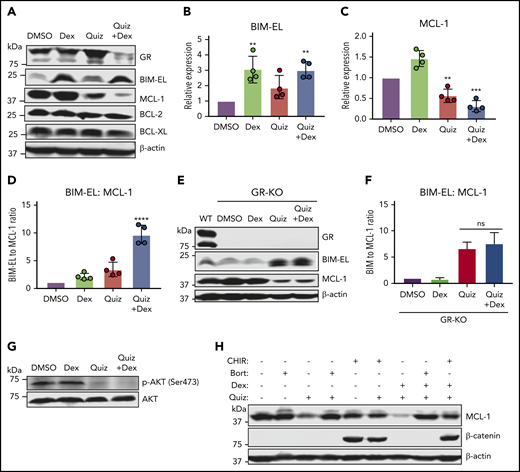
Quizartinib- and dexamethasone-induced synergistic cell death is mediated through GR. A representative immunoblot (A) and quantification of replicate experiments (B) (denoted by the individual dots) using densitometry showing GR is increased following 48-hour quizartinib (100 nM) treatment in MV4-11 cells. (C) Immunoblot showing GR-knockout (pooled single clones) in MV4-11 cells. (D) FACS quantification of dead cells (Annexin-V positive) in GR-knockout and wild-type MV4-11 cells treated with the indicated drugs (100 nM quizartinib, 50 µM dexamethasone) for 48 hours. KO, knockout.
Quizartinib- and dexamethasone-induced synergistic cell death is mediated through GR. A representative immunoblot (A) and quantification of replicate experiments (B) (denoted by the individual dots) using densitometry showing GR is increased following 48-hour quizartinib (100 nM) treatment in MV4-11 cells. (C) Immunoblot showing GR-knockout (pooled single clones) in MV4-11 cells. (D) FACS quantification of dead cells (Annexin-V positive) in GR-knockout and wild-type MV4-11 cells treated with the indicated drugs (100 nM quizartinib, 50 µM dexamethasone) for 48 hours. KO, knockout.
We next sought to elucidate the mechanism of the synergistic cell death observed. We tested the expression of the pro- and antiapoptotic BCL-2 family proteins, as they have been shown to be modulated by GCs.24,25 While the proapoptotic protein BIM-EL (here referred to as BIM) was increased by quizartinib alone, BIM expression was higher at both the protein and RNA levels in cells treated with dexamethasone alone as well as dexamethasone in combination with quizartinib (Figure 6A-B; supplemental Figure 6D). On the other hand, the antiapoptotic protein MCL-1 was most significantly decreased in combination-treated cells, although it was decreased to a lesser extent in cells treated with quizartinib alone (Figure 6A,C). The expression levels of other BCL-2 family proteins, such as BCL-2 and BCL-XL, did not change significantly following any of the treatments (Figure 6A). Importantly, the ratio of BIM to MCL-1 was the most significantly increased upon combination treatment in both MV4-11 (Figure 6D) and MOLM13 cells (supplemental Figure 6A) as well as upon combination treatment with other FLT3 inhibitors (supplemental Figure 6B). The enhanced BIM to MCL-1 ratio by the combination treatment was abolished in GR-knockout cells (Figure 6E-F). Notably, the concentration of quizartinib is the limiting factor for the observed synergy, as demonstrated by quizartinib and dexamethasone combination matrix (supplemental Figure 4A). This is supported mechanistically by the fact that the ratio of BIM to MCL-1 increases drastically only once quizartinib reaches 5 nM, whereas 100 nM dexamethasone is sufficient to induce BIM expression (supplemental Figure 6C-D) and synergistic cell death with quizartinib (supplemental Figure 4A).

Increased BIM and decreased MCL-1 expression underlies synergistic cell death in FLT3-mutant cells treated with the combination of quizartinib and dexamethasone. A representative immunoblot (A) and quantification of replicate experiments (B-D) (n = 4) showing expression of BCL-2 family proteins following treatment with the indicated drugs (100 nM quizartinib, 50 µM dexamethasone) for 48 hours. Statistical significance is based on comparison of each treatment to DMSO. A representative immunoblot (E) and quantification of replicate experiments (F) (n = 2) showing the ratio of BIM to MCL-1 in GR-knockout MV4-11 cells following treatment with the indicated drugs (100 nM quizartinib and 50 µM dexamethasone) for 48 hours. (G) Immunoblot showing abrogation of phosphorylated AKT in MV4-11 cells after treatment with the indicated drugs (100 nM quizartinib and 50 µM dexamethasone) for 48 hours. (H) A representative immunoblot (n = 2) showing rescue of quizartinib and combination treatment-induced MCL-1 degradation with either bortezomib (Bort) (10 nM) or GSK inhibitor CHIR99021 (CHIR) (10 µM) cotreatment in MV4-11 cells for 18 hours.
Increased BIM and decreased MCL-1 expression underlies synergistic cell death in FLT3-mutant cells treated with the combination of quizartinib and dexamethasone. A representative immunoblot (A) and quantification of replicate experiments (B-D) (n = 4) showing expression of BCL-2 family proteins following treatment with the indicated drugs (100 nM quizartinib, 50 µM dexamethasone) for 48 hours. Statistical significance is based on comparison of each treatment to DMSO. A representative immunoblot (E) and quantification of replicate experiments (F) (n = 2) showing the ratio of BIM to MCL-1 in GR-knockout MV4-11 cells following treatment with the indicated drugs (100 nM quizartinib and 50 µM dexamethasone) for 48 hours. (G) Immunoblot showing abrogation of phosphorylated AKT in MV4-11 cells after treatment with the indicated drugs (100 nM quizartinib and 50 µM dexamethasone) for 48 hours. (H) A representative immunoblot (n = 2) showing rescue of quizartinib and combination treatment-induced MCL-1 degradation with either bortezomib (Bort) (10 nM) or GSK inhibitor CHIR99021 (CHIR) (10 µM) cotreatment in MV4-11 cells for 18 hours.
It has previously been shown that glycogen synthase kinase-3 (GSK3), in the absence of activated AKT, phosphorylates MCL-1 at S159 and promotes its ubiquitination and subsequent degradation.26 Indeed, phosphorylation of AKT is completely blocked following both quizartinib and combination treatment (Figure 6G). The decrease in MCL-1 following exposure to quizartinib and in combination with dexamethasone was rescued by cotreatment with the proteasomal inhibitor bortezomib or the GSK inhibitor CHIR99021 (Figure 6H). β-Catenin was used as a control, as its degradation is promoted by GSK327 (Figure 6H). This suggests that the decrease in MCL-1 is regulated at the protein level and not at the transcriptional level, in agreement with the RNA-sequencing analysis (supplemental Figure 6E).
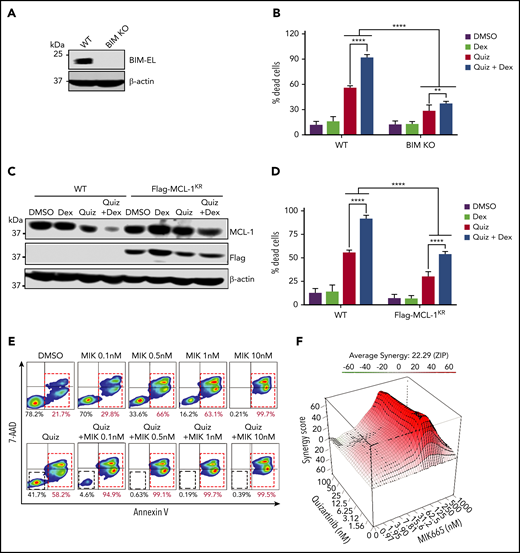
To further demonstrate that the enhanced apoptosis seen with the combination treatment is dependent on the ratio of BIM to MCL-1, we first knocked out BIM using CRISPR-Cas9 in MV4-11 cells (Figure 7A). As expected, BIM-knockout cells were significantly less sensitive to both single and combination treatments of quizartinib and dexamethasone compared with wild-type cells (Figure 7B). Similarly, cells expressing Flag-tagged MCL-1KR (where all 14 lysine residues are replaced by arginine to avoid ubiquitination-dependent, but not independent, proteasomal degradation)28 showed significantly decreased cell death following quizartinib and combination treatment (Figures 7C-D). Conversely, the MCL-1–specific inhibitor MIK665 synergistically induced apoptosis in MV4-11 cells when combined with quizartinib even at a low concentration of 0.1 nM (Figure 7E-F; supplemental Figure 7).

BIM knockout and MCL-1 overexpression rescue cell death of MV4-11 cells treated with quizartinib alone or in combination with dexamethasone. (A) Immunoblot showing BIM-knockout (pooled single clones) in MV4-11 cells. (B) Quantification of Annexin-V positive dead cells in BIM-knockout (KO) or wild-type MV4-11 cells treated with the indicated drugs (100 nM quizartinib and 50 µM dexamethasone) for 48 hours and subjected to APC-Annexin-V and 7-AAD staining and FACS analysis. (C) A representative immunoblot (n = 2) showing MCL-1 degradation in cells expressing Flag-MCL-1KR as well as wild-type cells following treatment with the indicated drugs (100 nM quizartinib and 50 µM dexamethasone) for 18 hours. (D) Quantification of Annexin-V positive dead cells in Flag-MCL-1KR–expressing cells or WT cells treated with the indicated drugs (100 nM quizartinib and 50 µM dexamethasone) for 48 hours by APC-Annexin-V and 7-AAD staining and FACS analysis. (E) Representative images of FACS analysis of APC-Annexin-V and 7-AAD stained MV4-11 cells following treatment with quizartinib (100 nM) alone or in combination with MCL-1 inhibitor MIK-665 at the indicated concentrations for 48 hours. (F) Three-dimensional graph showing the synergy score of quizartinib and MIK-665 combination after 48 hours in MV4-11 cells.
BIM knockout and MCL-1 overexpression rescue cell death of MV4-11 cells treated with quizartinib alone or in combination with dexamethasone. (A) Immunoblot showing BIM-knockout (pooled single clones) in MV4-11 cells. (B) Quantification of Annexin-V positive dead cells in BIM-knockout (KO) or wild-type MV4-11 cells treated with the indicated drugs (100 nM quizartinib and 50 µM dexamethasone) for 48 hours and subjected to APC-Annexin-V and 7-AAD staining and FACS analysis. (C) A representative immunoblot (n = 2) showing MCL-1 degradation in cells expressing Flag-MCL-1KR as well as wild-type cells following treatment with the indicated drugs (100 nM quizartinib and 50 µM dexamethasone) for 18 hours. (D) Quantification of Annexin-V positive dead cells in Flag-MCL-1KR–expressing cells or WT cells treated with the indicated drugs (100 nM quizartinib and 50 µM dexamethasone) for 48 hours by APC-Annexin-V and 7-AAD staining and FACS analysis. (E) Representative images of FACS analysis of APC-Annexin-V and 7-AAD stained MV4-11 cells following treatment with quizartinib (100 nM) alone or in combination with MCL-1 inhibitor MIK-665 at the indicated concentrations for 48 hours. (F) Three-dimensional graph showing the synergy score of quizartinib and MIK-665 combination after 48 hours in MV4-11 cells.
Collectively, our data suggest that the combinational synergy of dexamethasone with quizartinib is mediated through GR-dependent BIM upregulation together with MCL-1 degradation in FLT3-mutant AML cells.
Discussion
Resistance to FLT3-targeted therapy is an inevitable impediment to AML treatment; hence, there is a growing interest in understanding and preventing resistance. In this report, we demonstrate that treatment with FLT3 inhibitors induces a significant change in the transcriptional landscape of the surviving DTP cell population. Notably, these changes are transient and result in a window of therapeutically exploitable vulnerabilities. Using an unbiased genome-wide transcriptome analysis, we report that inflammatory pathways are the most significantly upregulated pathways in DTPs relative to untreated parental cells. Independently, our drug screen reveals that DTPs are significantly more sensitive to anti-inflammatory drugs, particularly GCs, than parental control cells. In line with this observation, a combination of quizartinib and GCs significantly enhances cell death in FLT3-mutant cells, which we demonstrate is occurring through increased BIM and decreased MCL-1 expression.
GCs control various key physiological functions, including metabolic homeostasis, cell proliferation, apoptosis, immune function, and inflammation.29-31 GCs have been used as potent anti-inflammatory agents for decades and are well tolerated.30 While GCs are an essential component of treatment in lymphoblastic leukemias due to their effect on cell cycle and apoptosis,25,32,33 they have demonstrated no therapeutic antileukemic role in AML except in patients with RUNX1 mutations.34,35 Indeed, we have observed that GCs as single agents do not induce cell death in the AML cell lines we studied, except for the RUNX1 mutant Kasumi-1 cell line. A recent study shows that cytarabine-resistant AML cells acquire sensitivity to GCs compared with cytarabine-sensitive cells.36 Interestingly, in that study, GC sensitivity is observed in FLT3 wild-type, but not FLT3-ITD cytarabine-resistant, AML cells. Conversely, we observe synergy between FLT3 inhibitors and GCs in FLT3-ITD, but not wild-type, cells. Similar to their finding, however, synergy is not observed when we combined cytarabine with GCs in FLT3-ITD cells. While the exact mechanism that causes differential vulnerability to GCs based on FLT3 mutation status and the use of chemo- versus targeted therapy is unknown, in both cases, increased GR expression underlies sensitivity to GCs, thereby agreeing with previous studies.37-39
Increased expression of the proapoptotic protein BIM is one of the most established mechanisms of GC-induced apoptosis.40,41 BIM is negatively regulated through MEK-ERK mediated phosphorylation on S55, S65, and S100, which prevents it from activating BAX and promotes its degradation through the proteasome pathway.40,42 Therefore, inhibition of the MEK-ERK pathway by FLT3 inhibitors may synergize with GCs to increase the expression of BIM and enhance its proapoptotic function. The importance of BIM is evidenced by the significantly decreased cell death following treatment with quizartinib and in combination with dexamethasone in BIM-knockout cells. Although treatment of FLT3-ITD AML cells with dexamethasone alone increases BIM expression, the cells remain completely viable, likely due to the concomitant increase in the expression of the antiapoptotic protein MCL-1. The ratio of BIM to MCL-1, a key predictor of apoptosis sensitivity,43 is most significantly increased in cells treated with the combination treatment, which likely underlies the enhanced apoptosis observed when compared with quizartinib and dexamethasone single-agent treatments.
MCL-1 represses apoptosis by sequestering BIM and preventing it from activating BAX and BAK to induce mitochondrial membrane permeabilization and apoptosis. MCL-1 has been shown to be a downstream target of FLT3 signaling and is implicated in mediating resistance to FLT3-targeted therapy.44 Indeed, we show a decrease in MCL-1 protein expression upon quizartinib treatment and a significant synergy between the MCl-1 selective inhibitor MIK665 and quizartinib in the killing of FLT3-ITD AML cells. Mechanistically, the decrease in MCL-1 protein levels is mediated through enhanced proteasomal degradation, which is at least in part regulated by GSK3 following the inhibition of FLT3 and downstream targets such as AKT. In agreement, a recent functional CRISPR-Cas9 screen shows that the loss of GSK3 and SPRY3 genes confers resistance to quizartinib in FLT3-ITD cells.45 It is possible that the mechanism by which the loss of GSK3 confers resistance to FLT3 inhibitors is through decreased MCL-1 degradation in addition to the reactivation of WNT signaling proposed by the authors.45 Interestingly, GSK3 has also been shown to associate with GR in the absence of GCs and dissociate from GR and interact with BIM subsequent to GC exposure.26,46 Hence, GSK3 is not only involved in MCL-1 degradation but also plays an important role in induction of BIM upon exposure to GCs, thereby making it an important link between quizartinib, GCs, and the intrinsic pathway of apoptosis.
In summary, single-agent therapies most often lack durability in AML due to drug-induced activation of survival pathways, warranting a need for rational drug combinations. Although further preclinical animal studies would be needed to optimize the dosage regimen for minimizing toxicity and therefore maximizing antileukemic effect and survival benefit, our findings suggest that the combination of FLT3 inhibitors and anti-inflammatory GCs has promising potential to reduce measurable/minimal residual disease, drug resistance, and relapse in FLT3-mutated AML patients. As we have decades of clinical use and experience with GCs, this combination therapy could be explored and translated rapidly to improve patient outcome.
Further information and requests for resources and reagents should be directed to and will be fulfilled by the corresponding author, Hong-Gang Wang (huw11@psu.edu).
The RNA sequencing data reported in this article have been deposited in the Gene Expression Omnibus database (accession number GSE116432).
The online version of this article contains a data supplement.
The publication costs of this article were defrayed in part by page charge payment. Therefore, and solely to indicate this fact, this article is hereby marked “advertisement” in accordance with 18 USC section 1734.
Acknowledgments
The authors thank Penn State Hershey Genome Science Facilities for performing the RNA-sequencing, and Sriranga Iyyanki for help with RNA-sequencing analysis. The authors also thank the Penn State College of Medicine Flow Cytometry Core and staff. The authors are grateful to the H.-G.W. laboratory members who gave insight and technical help, especially Carson Wills for help with editing.
This work was supported, in part, by National Institutes of Health, National Cancer Institute grants CA171983 and CA222349, the Hyundai Hope on Wheels Foundation, and the Lois High Berstler Research Fund and the Four Diamonds Fund of the Penn State College of Medicine. Technical support was provided by the Cancer Prevention and Research Institute of Texas (grant RP180734 to Z.Z.).
Authorship
Contribution: M.T.G., J.M.A., and H.-G.W. conceived and designed the study and interpreted the results; M.T.G. conducted the experiments and performed data analysis; Z.T., C.M.D., M.M.Y., L.C., and B.A.M. helped with experimental work and/or interpretation of results; L.Z., Z.L., P.L., Y.I.K., and Z.Z. performed biostatistics and bioinformatics analyses; C.A., A.S., and D.F.C. assisted with obtaining and processing of patient samples; M.T.G. wrote and H.-G.W. and M.M.Y. edited the manuscript; and all authors discussed the results and commented on the manuscript.
Conflict-of-interest disclosure: D.F.C. has received research support for clinical studies conducted by Daiichi Sankyo, Ambit Biosciences, Astellas Pharma, Novartis, Incyte, Cyclacel Pharmaceuticals, Celgene, MedImmune, Merck, and Gilead Sciences. The remaining authors declare no competing financial interests.
Correspondence: Hong-Gang Wang, Pennsylvania State University College of Medicine, 500 University Dr, Hershey, PA 17033; e-mail: huw11@psu.edu.