

Key Points
Canonical Wnt signaling drives the proliferation of immature SEPs.
Epo signaling in macrophages induces lipid mediators to promote differentiation of SEPs.

Abstract
Anemic stress induces stress erythropoiesis, which rapidly generates new erythrocytes to restore tissue oxygenation. Stress erythropoiesis is best understood in mice where it is extramedullary and occurs primarily in the spleen. However, both human and mouse stress erythropoiesis use signals and progenitor cells that are distinct from steady-state erythropoiesis. Immature stress erythroid progenitors (SEPs) are derived from short-term hematopoietic stem cells. Although the SEPs are capable of self-renewal, they are erythroid restricted. Inflammation and anemic stress induce the rapid proliferation of SEPs, but they do not differentiate until serum erythropoietin (Epo) levels increase. Here we show that rather than directly regulating SEPs, Epo promotes this transition from proliferation to differentiation by acting on macrophages in the splenic niche. During the proliferative stage, macrophages produce canonical Wnt ligands that promote proliferation and inhibit differentiation. Epo/Stat5-dependent signaling induces the production of bioactive lipid mediators in macrophages. Increased production of prostaglandin J2 (PGJ2) activates peroxisome proliferator-activated receptor γ (PPARγ)-dependent repression of Wnt expression, whereas increased production of prostaglandin E2 (PGE2) promotes the differentiation of SEPs.
Introduction
Bone marrow steady-state erythropoiesis produces new erythrocytes at a constant rate that matches the rate of clearance of senescent red blood cells.1,2 Blood loss, inflammation, or infection disrupts this homeostasis. When challenged by these conditions, a regenerative process termed “stress erythropoiesis” generates new erythrocytes.3 Unlike steady-state erythropoiesis, stress erythropoiesis generates a synchronous wave of new erythrocytes that maintains homeostasis until bone marrow steady-state erythropoiesis can resume. This process requires the proliferation of transient amplifying cells to generate large numbers of committed erythroid progenitors.4,5 Stress erythropoiesis uses progenitor cells and signals that are distinct from steady-state erythropoiesis.5-8 In mice, stress erythroid progenitors (SEPs) are directly derived from bone marrow short-term hematopoietic stem cells (CD34+Kit+Sca1+Lin–),4 which migrate to the spleen and are restricted to the stress erythroid lineage by signals produced by the splenic microenvironment.8 This population of progenitors (CD34+CD133+Kit+Sca1+ [CD34+CD133+KS] cells) acts as a transient amplifying population.5 Despite being erythroid restricted during this stage, the progenitors do not differentiate. The rise in serum erythropoietin (Epo) concentration drives the transition from proliferating progenitors to committed stress burst-forming units-erythroid (BFU-Es), which lose expression of CD34, CD133, and Sca1 and synchronously differentiate into erythrocytes.4,5
In addition to specialized SEPs, the splenic microenvironment regulates stress erythropoiesis.9-12 The splenic stress erythropoiesis niche is a complex and dynamic structure made up of erythroblastic islands (EBIs), which are composed of a central monocyte/macrophage surrounded by developing erythroid progenitors. Stress erythropoiesis is severely compromised when macrophages are eliminated in vitro or in vivo.5,9,11 Monocytes are recruited to the spleen during stress erythropoiesis where they mature in concert with immature SEPs in EBIs.10 The generation of new erythrocytes therefore requires the interplay between the development and expansion of the niche, which must occur in conjunction with the proliferation and development of SEPs.
EBI macrophages express the Epo receptor.13,14 Our previous work showed that Epo was the signal that promoted the transition from proliferating immature SEPs to committed erythroid progenitors, which suggests that Epo signaling in macrophages could promote this transition.5 Here we show that Epo-dependent activation of Stat5 in splenic macrophages leads to a change in signals from canonical Wnt signaling to prostaglandins. Wnt2b and Wnt8a promote the proliferation of the immature SEPs and inhibit their differentiation. Epo antagonizes Wnt expression by increasing the production of prostaglandin J2 (PGJ2), which activates peroxisome proliferator-activated receptor γ (PPARγ)-dependent repression of Wnt expression. Simultaneously, Epo increases the production of prostaglandin E2 (PGE2), which independently promotes the differentiation of SEPs. These data establish a role for Epo signaling in macrophages in regulating stress erythropoiesis.
Methods
Mice
C57BL/6 mice, C57BL/6-Tg (UBC-GFP) 30Scha/J mice, B6.SJL-PtprcaPepcb/BoyJ, B6.129-Ctnnb1tm2Kem/KnwJ mice, and B6;129-Gt (ROSA)26Sortm1(cre/ERT)Nat/J mice (Rosa26-CreERT mice) were purchased from The Jackson Laboratory. All strains were back crossed onto C57BL/6 background. C57BL/6 mice with a floxed allele of Stat5a and Stat5b (referred to as Stat5fx/fx mice) were obtained from Lothar Hennighausen.15 All animal procedures were approved by Institutional Animal Care and Use Committee of The Pennsylvania State University.
Cell culture
In vitro murine and human stress erythropoiesis cultures were performed as previously described. Details of the culture system are provided in the supplemental Data (available on the Blood Web site).
Stress BFU-E colony assay
Isolated spleen cells or in vitro cultured bone marrow cells were plated in methylcellulose media (M3334, STEMCELL Technologies). Stress BFU-Es were scored after 5 days incubation. Stress BFU-E culture conditions and stress BFU-E colony enumeration procedures have been previously described.16
Statistics
Quantitative data were represented as means ± standard error of the mean (SEM). Statistical analysis is described in the figure legends. The significance level was set as α = .05.
Results
Epo/Stat5 signaling is required for macrophage-regulated SEP development
The most immature CD34+CD133+KS SEPs rapidly proliferate in the spleen during the initial stage of recovery from bone marrow transplantation (BMT). This expansion occurs before increased production of Epo in the kidney.4,5 The expansion of this population is recapitulated in vitro when bone marrow cells are cultured in stress erythropoiesis expansion media (SEEM) that lacks Epo.5 Although Epo induces the immature SEPs to commit to differentiation, the cells express very low amounts of Epo receptor (EpoR) messenger RNA (mRNA) (Figure 1A), which is consistent with previous work showing that these progenitors were unable to generate stress BFU-E colonies when plated in methylcellulose media containing Epo.5 These findings suggest that the target of Epo is not the immature SEPs. In contrast, primary F4/80+ macrophages isolated from the spleen and bone marrow-derived macrophages (BMDMs) cultured in vitro expressed significant levels of EpoR mRNA (Figure 1A). The expression levels were not as high as those in the more mature SEPs (CD34–CD133–Kit+Sca1+ [CD34–CD133–KS] SEPs) that are able to differentiate. However, this observation is consistent with recent work showing that EpoR expression marks the EBI macrophages.13,14 Treatment of BMDMs with Epo induces Stat5 phosphorylation as measured by flow cytometry and immunofluorescence (Figure 1B). Primary spleen F4/80+ macrophages treated with Epo induced Stat5 phosphorylation, and that signal was lost in Stat5Δ/Δ macrophages (Figure 1C). To demonstrate a role for EpoR/Stat5 signaling in macrophages in regulating the transition to committed erythroid progenitors, we cultured wild-type CD34+CD133+KS cells on control Stat5fx/fx or mutant Stat5Δ/Δ macrophages for 5 days and then added Epo to the cultures. The CD34+CD133+KS SEPs grown on control macrophages matured into CD34–CD133–KS cells, whereas the CD34+CD133+KS cells grown on mutant BMDMs failed to transition (Figure 1D). This failure to mature was also evident when the cells were plated for stress BFU-Es. Cells grown on Stat5Δ/Δ macrophages were unable to generate BFU-E colonies when cultured in Epo alone. They also produced significantly fewer colonies when plated in media containing Epo+SCF+BMP4 at 2% O2, which maximizes the SEP potential of generating stress BFU-Es (Figure 1E). However, the SEPs generated with the mutant macrophages were not defective because transplantation of purified SEPs generated with control or Stat5Δ/Δ BMDMs were equally able to provide short-term radioprotection (supplemental Figure 1A).
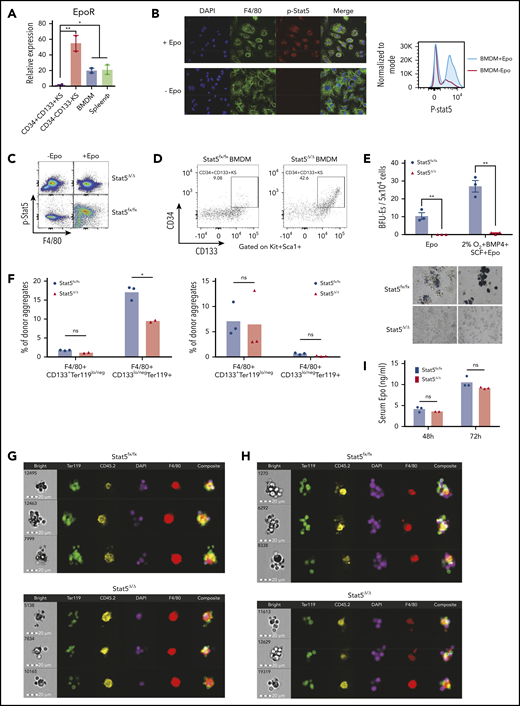
Differentiation of SEPs requires activation of macrophages through Epo-dependent Stat5 activation. (A) mRNA expression of EpoR in sorted SEPs (CD34+CD133+KS and CD34–CD133–KS), BMDMs, and sorted primary F4/80+ spleen macrophages (spleen ϕ). (B) Immunocytochemistry analysis of colocalization of phosphorylated Stat5, F4/80, and 4′,6-diamidino-2-phenylindole (DAPI) in BMDMs (left). Flow cytometry analysis of phosphorylated Stat5 in BMDMs with or without Epo (right). (C) Flow cytometry analysis of Stat5 phosphorylation in F4/80+ spleen macrophages isolated from Stat5fx/fx or Stat5Δ/Δ mice with or without Epo. (D) Flow cytometry analysis of CD34+CD133+KS SEPs cocultured with Stat5fx/fx BMDMs or Stat5Δ/Δ BMDMs. CD34 and CD133 expression is shown on cells gated on Kit+Sca1+. (E) Stress BFU-E colony number (top) and representative BFU-E morphology (bottom) of SEPs cocultured with Stat5fx/fx BMDMs or Stat5Δ/Δ BMDMs. (F) Quantification of flow cytometry analysis of early-stage F4/80+CD133+Ter119lo/neg EBIs and late-stage F4/80+CD133lo/negTer119+ EBIs after 48 hours of phenylhydrazine (PHZ) treatment (left) and 72 hours of PHZ treatment (right). F4/80, CD133, and Ter119 expressions are shown on aggregates gated on CD45.2+ (donor). (G-H) Representative FlowSight analysis of EBIs after (G) 48 hours of PHZ treatment and (H) 72 hours of PHZ treatment (n = 2-3 mice per group). (I) Serum Epo level measurement by enzyme-linked immunosorbent assay (ELISA) after PHZ treatment. Student t test (2-tailed). Data represent means ± standard error of the mean (SEM). ns, not significant. *P < .05; **P < .01.
Differentiation of SEPs requires activation of macrophages through Epo-dependent Stat5 activation. (A) mRNA expression of EpoR in sorted SEPs (CD34+CD133+KS and CD34–CD133–KS), BMDMs, and sorted primary F4/80+ spleen macrophages (spleen ϕ). (B) Immunocytochemistry analysis of colocalization of phosphorylated Stat5, F4/80, and 4′,6-diamidino-2-phenylindole (DAPI) in BMDMs (left). Flow cytometry analysis of phosphorylated Stat5 in BMDMs with or without Epo (right). (C) Flow cytometry analysis of Stat5 phosphorylation in F4/80+ spleen macrophages isolated from Stat5fx/fx or Stat5Δ/Δ mice with or without Epo. (D) Flow cytometry analysis of CD34+CD133+KS SEPs cocultured with Stat5fx/fx BMDMs or Stat5Δ/Δ BMDMs. CD34 and CD133 expression is shown on cells gated on Kit+Sca1+. (E) Stress BFU-E colony number (top) and representative BFU-E morphology (bottom) of SEPs cocultured with Stat5fx/fx BMDMs or Stat5Δ/Δ BMDMs. (F) Quantification of flow cytometry analysis of early-stage F4/80+CD133+Ter119lo/neg EBIs and late-stage F4/80+CD133lo/negTer119+ EBIs after 48 hours of phenylhydrazine (PHZ) treatment (left) and 72 hours of PHZ treatment (right). F4/80, CD133, and Ter119 expressions are shown on aggregates gated on CD45.2+ (donor). (G-H) Representative FlowSight analysis of EBIs after (G) 48 hours of PHZ treatment and (H) 72 hours of PHZ treatment (n = 2-3 mice per group). (I) Serum Epo level measurement by enzyme-linked immunosorbent assay (ELISA) after PHZ treatment. Student t test (2-tailed). Data represent means ± standard error of the mean (SEM). ns, not significant. *P < .05; **P < .01.
To assess the role of Epo/Stat5-dependent signaling in the splenic niche, we treated congenic CD45.1+ mice with clodronate liposomes to eliminate resident splenic macrophages. We then transferred purified Stat5fx/fx or Stat5Δ/Δ Ly6C+Ly6G–CD11b+CD45.2+ monocytes into the clodronate-treated mice.10,17 These mice were then treated with phenylhydrazine to induce anemia. At 48 hours after treatment, Stat5Δ/Δ and Stat5fx/fx contributed to similar percentages of donor-derived immature EBIs (F4/80+CD133+Ter119lo/neg), but Stat5Δ/Δ monocytes contributed to significantly fewer mature EBIs (F4/80+CD133lo/negTer119+). However, by 72 hours after treatment, the difference in mature EBIs was lost, which may reflect that the signals induced by Epo signaling in recipient-derived macrophages rescued the Stat5Δ/Δ-mutant phenotype (Figure 1F). Analysis of the EBIs by imaging flow cytometry showed that Stat5Δ/Δ EBIs had fewer associated Ter119+ cells (Figure 1G-H). These differences in EBIs occurred despite the observation that serum Epo concentrations in recipients that received mutant or control monocytes were not different at 48 or 72 hours (Figure 1I). These data were consistent with BMT experiments. During recovery from BMT, the splenic niche contains both recipient-derived and donor-derived monocytes and macrophages.10 Transplanting control unfractionated bone marrow into a Stat5Δ/Δ-recipient mouse or the reciprocal transplant of Stat5Δ/Δ donor bone marrow into control recipients both led to a defect in erythroid short-term radioprotection. However, the most severe phenotype was observed when Stat5Δ/Δ donor cells were transplanted into Stat5Δ/Δ recipients. These mice failed to reach normal hematocrit levels by 24 days after transplantation (supplemental Figure 1B). These data suggest that loss of Epo/Stat5-dependent signaling in recipient- and donor-derived monocytes and macrophages compromises stress erythropoiesis.
Macrophage-derived Wnt/β-catenin signaling promotes SEP proliferation
These observations support a role for Epo signaling in macrophages in promoting the transition from proliferating SEPs to differentiating SEPs. During liver regeneration, macrophages express canonical Wnt signals, which influence neighboring hepatic progenitor cells by promoting their proliferation and determining their developmental fate.18 We tested whether Wnt signaling plays a similar role in stress erythropoiesis. First, we examined the mRNA expression of canonical and noncanonical Wnt’s in both in vitro cultured BMDMs in response to Epo stimulation and in primary F4/80+ spleen macrophages isolated at different days after BMT. Noncanonical Wnt’s did not exhibit significant changes in expression (supplemental Figure 2A). In contrast, the expression of most canonical Wnt’s exhibited significant fluctuations in response to Epo in vitro and in vivo. Wnt2b, Wnt7, Wnt8a, and Wnt9b exhibited the most significant changes in expression (supplemental Figure 2A-B). To further characterize the role of Wnt signaling in stress erythropoiesis in more detail, we focused on 2 canonical Wnt’s, Wnt2b and Wnt8a, which showed a sensitive response to Epo in vitro and in vivo. Analysis of Wnt2b and Wnt8a mRNA expression in the spleen after BMT showed that the 2 Wnt ligands peaked at day 4 after transplantation and rapidly decreased by day 6. The decrease in expression of Wnt2b and Wnt8a corresponded to the increase in serum Epo concentration that peaked at day 6. In addition, the expression of Wnt2b and Wnt8a remained repressed whereas Epo levels were elevated during the recovery (Figure 2A). Furthermore, isolated murine F4/80+ spleen macrophages treated with Epo rapidly decreased the expression of Wnt2b and Wnt8a (Figure 2B, left). However, splenic macrophages isolated from Stat5Δ/Δ mice were unable to decrease Wnt2b and Wnt8a expression in response to Epo stimulation (supplemental Figure 3). We extended these observations to human stress erythropoiesis. Unfractionated human bone marrow cells cultured in SEEM expressed Wnt2b and Wnt8a mRNA, whereas these expression levels were significantly decreased within 24 hours after Epo treatment (Figure 2B, right). These observations demonstrate that Epo negatively regulates the expression of Wnt2b and Wnt8a.

Wnt signaling promotes early SEP proliferation, and the expression of canonical Wnts is inhibited by Epo signaling. (A) ELISA analysis of serum Epo (right y-axis) and Wnt2b and Wnt8a mRNA expression (left y-axis) in spleen cells on indicated days after BMT. For each time point, n = 3 mice per group. (B) Wnt2b and Wnt8a mRNA expression in sorted murine spleen F4/80+ macrophages with or without Epo for 24 hours (left). mRNA expression of WNT2b and WNT8a in unfractionated human bone marrow cells cultured in SEEM for 5 days and then treated with or without Epo for 24 hours (right). (C) Representative flow cytometry analysis of CD34 and CD133 expression on Kit+Sca1+ SEPs from murine bone marrow cells cultured in SEEM with or without 1 μM BIO and with or without Epo. (D) Stress BFU-E colony assay of in vitro cultured SEPs treated with or without Epo and with or without BIO, as shown in panel C. (E) Stress BFU-E colony assay of SEPs expanded in SEEM with or without BIO. The SEPs were then switched into SEDM without BIO, and stress BFU-Es were assayed after 3 days. (F) Stress BFU-E colony assay of SEPs expanded in SEEM with or without Epo, with or without 100 ng/mL WIF1, or treated with Epo with or without WIF1. Student t test (2-tailed). Data represent means ± SEM. *P < .05; **P < .01; ****P < .0001.
Wnt signaling promotes early SEP proliferation, and the expression of canonical Wnts is inhibited by Epo signaling. (A) ELISA analysis of serum Epo (right y-axis) and Wnt2b and Wnt8a mRNA expression (left y-axis) in spleen cells on indicated days after BMT. For each time point, n = 3 mice per group. (B) Wnt2b and Wnt8a mRNA expression in sorted murine spleen F4/80+ macrophages with or without Epo for 24 hours (left). mRNA expression of WNT2b and WNT8a in unfractionated human bone marrow cells cultured in SEEM for 5 days and then treated with or without Epo for 24 hours (right). (C) Representative flow cytometry analysis of CD34 and CD133 expression on Kit+Sca1+ SEPs from murine bone marrow cells cultured in SEEM with or without 1 μM BIO and with or without Epo. (D) Stress BFU-E colony assay of in vitro cultured SEPs treated with or without Epo and with or without BIO, as shown in panel C. (E) Stress BFU-E colony assay of SEPs expanded in SEEM with or without BIO. The SEPs were then switched into SEDM without BIO, and stress BFU-Es were assayed after 3 days. (F) Stress BFU-E colony assay of SEPs expanded in SEEM with or without Epo, with or without 100 ng/mL WIF1, or treated with Epo with or without WIF1. Student t test (2-tailed). Data represent means ± SEM. *P < .05; **P < .01; ****P < .0001.
Our observation that Wnt2b and Wnt8a expression occurs before the Epo-induced transition to differentiation suggested that Wnt signaling may play a role in the expansion of immature SEP populations. To investigate this possibility, we performed in vitro stress erythropoiesis expansion cultures and manipulated canonical Wnt signaling. Murine bone marrow cells cultured in SEEM were treated with and without BIO, a GSK3 inhibitor that activates canonical Wnt signaling.19 Addition of BIO to the cultures resulted in an expansion of the CD34+CD133+KS population of early SEPs and maintained this population even when Epo was added to the culture (Figure 2C). BIO also blocked the Epo-dependent development of stress BFU-Es in these cultures (Figure 2D). However, this blocking of differentiation was reversible. When immature CD34+CD133+KS SEPs expanded in SEEM plus BIO, cultures were switched to SEEM plus Epo media lacking BIO; these cultures responded to Epo and induced differentiation into stress BFU-Es. Treatment with BIO resulted in an increased frequency of stress BFU-Es when compared with cultures that were not expanded in BIO (Figure 2E). In contrast, when we inhibited Wnt signaling with WIF1, which binds to Wnt proteins and inhibits their activity,20 we observed a significant increase in the frequency of stress BFU-Es in the absence of Epo. When WIF1 was added to SEEM plus Epo cultures, we observed an increase in stress BFU-E frequency over the addition of Epo alone (Figure 2F).
β-catenin–dependent transcription is a hallmark of canonical Wnt signaling.21,22 We analyzed the effects of blocking Wnt signaling by using a conditional allele of β-catenin that could be deleted in culture by using a tamoxifen-inducible Cre (β-cateninfx/fx;Rosa-CreERT).23,24 Previously, we showed that labeling bone marrow cells cultured in SEEM with the fluorescent membrane dye PKH26 allowed us to identify a faster dividing PKH26low and a slower dividing PKH26high population of SEPs. PKH26low cells are more mature SEPs (CD34–CD133–KS), whereas PKH26high cells corresponded primarily to CD34+CD133+KS SEPs.25 We analyzed cell proliferation by labeling β-cateninΔ/Δ and control cells with PKH26 and cultured the cells for 5 days. We observed a substantially lower proliferation rate in β-cateninΔ/Δ SEPs. When we analyzed specific SEP subpopulations, all populations exhibited significant decreases in cell proliferation with the greatest effect on the more mature, faster dividing populations (Figure 3A). Gene set enrichment analysis showed that PKH26low cells were positively correlated with Wnt signaling and target genes increased by β-catenin26 (Figure 3B). To control for loss of Wnt signaling in the stroma, we plated equal numbers of green fluorescent protein (GFP+) control and β-cateninfx/fx;Rosa-CreERT bone marrow cells in a coculture system. The cells were expanded in SEEM for 2 days followed by 4-hydroxytamoxifen (4-OHT) treatment for 24 hours. Cells were then washed and cultured in SEEM for 2 additional days. We compared the proliferation of GFP+ control cells with the β-cateninΔ/Δ (GFP–) cells. Before treatment with 4-OHT, nearly equal proportions of GFP+ and GFP– cells were observed in the culture. However, after deletion of β-catenin, the proportion of GFP–;β-cateninΔ/Δ cells was significantly lower than GFP+ control cells (Figure 3C; supplemental Figure 4). Analysis of the SEP populations showed that the GFP–;β-cateninΔ/Δ cells contained a similar percentage of CD34+CD133+KS cells, but the percentages of more mature progenitors (CD34–CD133–KS cells) were decreased in a manner similar to what we observed in Figure 3A (Figure 3D). Furthermore, the total numbers of these populations were all severely decreased (Figure 3D). Switching the cultures to Epo-containing stress erythropoiesis differentiation media (SEDM) led to significantly fewer stress BFU-Es in the GFP–β-cateninΔ/Δ cells when compared with the GFP+ control cells (Figure 3E). These data demonstrate that mutating β-catenin leads to defects in the proliferation of immature SEPs and severely impacts the ability of committed progenitors to generate erythrocytes.


Macrophage-derived Wnt signaling regulates SEP proliferation through β-catenin–dependent signaling pathway. (A) Analysis of SEP proliferation using loss of PKH26 fluorescent intensity in control β-cateninfx/fx and β-cateninΔ/Δ bone marrow cells cultured in SEEM. Cells were labeled with PKH26 after isolation and cultured in SEEM for 5 days before analysis. Representative PKH26 fluorescence is shown for all cell populations (left), CD34+CD133+KS (second), CD34–CD133+KS (third), and CD34–CD133–KS (right). (B) Analysis of microarray data by gene set enrichment analysis (GSEA). Expression data from our previous microarray analysis comparing PKH26loCD133–Kit+Sca1+ (PKH26low) and PKH26hiCD133+Kit+Sca1+ (PKH26high) SEPs (National Center for Biotechnology Information Gene Expression Omnibus accession number, GSE122390). Normalized data sets were processed by using GSEA to determine statistically differentially expressed gene sets in the 2 groups of SEPs. Hallmark gene sets were accessed from the Molecular Signatures Database. Targets upregulated by β-catenin (top) and reactome signaling by Wnt (bottom). (C) β-cateninfx/fx;Rosa26-CreERT bone marrow cells were cocultured with GFP+ control bone marrow cells (1:1 ratio) for 2 days and then treated with or without 4-OHT for 24 hours. The cells were then washed and plated in fresh SEEM without 4-OHT for 2 days. Proportion (left) and total cell number (right) of GFP+ population (control cells) vs GFP– population (β-cateninΔ/Δ cells) in coculture. (D) Flow cytometry analysis of 4-OHT treated cocultures as described in panel C. Proportion (left) and total cell number (right) of CD34+CD133+KS population (GFP+ or GFP–) and CD34–CD133–KS population (GFP+ or GFP–). (E) Production of stress BFU-Es by β-cateninΔ/Δ SEPs. Cocultures (as described in panel C) were switched into SEDM and cultured for 3 days, after which GFP+ cells and GFP– SEPs were isolated by fluorescence-activated cell sorting and plated for stress BFU-Es. (F-J) Analysis of erythroid short-term radioprotection after BMT with β-cateninΔ/Δ or control unfractionated donor bone marrow cells. In all, 500 000 bone marrow cells isolated from β-cateninfx/fx;Rosa-CreERT or β-cateninfx/fx control mice were treated with 4-OHT for 24 hours before being transplanted to lethally irradiated C57BL/6 recipient mice. (F) Analysis of spleen weight (left) and total spleen cell number (right). (G) Analysis of hematocrit during the recovery time. (H) Analysis of red blood cell (RBC) count. (I) Analysis of hemoglobin (HB) level. (J) Analysis of stress BFU-Es in the spleen on the indicated days after transplantation. For each time point, n = 3 mice per group. (K-M) Analysis of erythroid short-term radioprotection after BMT by sorted β-cateninΔ/Δ and control SEPs. In all, 50 000 GFP cells and 50 000 sorted CD133+KS cells isolated from β-cateninfx/fx or β-cateninΔ/Δ mice were transplanted to lethally irradiated CD45.1 C57BL/6 recipient mice. (K) Survival of recipients that received β-cateninfx/fx or β-cateninΔ/Δ CD133+KS cells (n = 9 mice per group). (L) Flow cytometry analysis of donor-derived GFP– SEPs in the spleen on day 8 after BMT. (M) Serum Epo level measurement by ELISA on day 8 after BMT. Student t test (2-tailed). Data represent means ± SEM. *P < .05; **P < .01; ***P < .001; ****P < .0001.
Macrophage-derived Wnt signaling regulates SEP proliferation through β-catenin–dependent signaling pathway. (A) Analysis of SEP proliferation using loss of PKH26 fluorescent intensity in control β-cateninfx/fx and β-cateninΔ/Δ bone marrow cells cultured in SEEM. Cells were labeled with PKH26 after isolation and cultured in SEEM for 5 days before analysis. Representative PKH26 fluorescence is shown for all cell populations (left), CD34+CD133+KS (second), CD34–CD133+KS (third), and CD34–CD133–KS (right). (B) Analysis of microarray data by gene set enrichment analysis (GSEA). Expression data from our previous microarray analysis comparing PKH26loCD133–Kit+Sca1+ (PKH26low) and PKH26hiCD133+Kit+Sca1+ (PKH26high) SEPs (National Center for Biotechnology Information Gene Expression Omnibus accession number, GSE122390). Normalized data sets were processed by using GSEA to determine statistically differentially expressed gene sets in the 2 groups of SEPs. Hallmark gene sets were accessed from the Molecular Signatures Database. Targets upregulated by β-catenin (top) and reactome signaling by Wnt (bottom). (C) β-cateninfx/fx;Rosa26-CreERT bone marrow cells were cocultured with GFP+ control bone marrow cells (1:1 ratio) for 2 days and then treated with or without 4-OHT for 24 hours. The cells were then washed and plated in fresh SEEM without 4-OHT for 2 days. Proportion (left) and total cell number (right) of GFP+ population (control cells) vs GFP– population (β-cateninΔ/Δ cells) in coculture. (D) Flow cytometry analysis of 4-OHT treated cocultures as described in panel C. Proportion (left) and total cell number (right) of CD34+CD133+KS population (GFP+ or GFP–) and CD34–CD133–KS population (GFP+ or GFP–). (E) Production of stress BFU-Es by β-cateninΔ/Δ SEPs. Cocultures (as described in panel C) were switched into SEDM and cultured for 3 days, after which GFP+ cells and GFP– SEPs were isolated by fluorescence-activated cell sorting and plated for stress BFU-Es. (F-J) Analysis of erythroid short-term radioprotection after BMT with β-cateninΔ/Δ or control unfractionated donor bone marrow cells. In all, 500 000 bone marrow cells isolated from β-cateninfx/fx;Rosa-CreERT or β-cateninfx/fx control mice were treated with 4-OHT for 24 hours before being transplanted to lethally irradiated C57BL/6 recipient mice. (F) Analysis of spleen weight (left) and total spleen cell number (right). (G) Analysis of hematocrit during the recovery time. (H) Analysis of red blood cell (RBC) count. (I) Analysis of hemoglobin (HB) level. (J) Analysis of stress BFU-Es in the spleen on the indicated days after transplantation. For each time point, n = 3 mice per group. (K-M) Analysis of erythroid short-term radioprotection after BMT by sorted β-cateninΔ/Δ and control SEPs. In all, 50 000 GFP cells and 50 000 sorted CD133+KS cells isolated from β-cateninfx/fx or β-cateninΔ/Δ mice were transplanted to lethally irradiated CD45.1 C57BL/6 recipient mice. (K) Survival of recipients that received β-cateninfx/fx or β-cateninΔ/Δ CD133+KS cells (n = 9 mice per group). (L) Flow cytometry analysis of donor-derived GFP– SEPs in the spleen on day 8 after BMT. (M) Serum Epo level measurement by ELISA on day 8 after BMT. Student t test (2-tailed). Data represent means ± SEM. *P < .05; **P < .01; ***P < .001; ****P < .0001.
We next extended this in vitro analysis to an in vivo stress erythropoiesis model, erythroid short-term radioprotection after BMT. Donor cells rapidly proliferate in the spleen, resulting in increased spleen weights after transplantation.4,5 However, mice who received a transplantation with unfractionated β-cateninΔ/Δ bone marrow cells exhibited significantly smaller spleens and had fewer donor-derived cells during the recovery period (Figure 3F). This defect manifested as a significantly delayed erythroid recovery, but the recovery of white blood cell counts was not different from that of control mice that received transplantations (Figure 3G-I; supplemental Figure 5A). The slow generation of new erythrocytes was a result of a defect in the production of stress BFU-Es in the spleen (Figure 3J). Donor bone marrow cells contribute to the microenvironment as well as to SEPs. To control for the effects of mutating β-catenin on the microenvironment, we transplanted purified immature CD133+Kit+Sca1+, β-cateninΔ/Δ, or β-cateninfx/fx SEPs with an equal number of GFP+ wild-type SEPs into irradiated recipients. Mutant and control SEPs homed to the spleen with similar efficiency at 24 hours after transplantation (supplemental Figure 5B). Mice transplanted with mutant SEPs showed decreased survival because only 50% of them survived to 8 days (Figure 3K). Expansion of CD133+Kit+Sca1+ SEPs and CD133–Kit+Sca1+ SEPs were significantly decreased in the mutant transplants (Figure 3L), which lead to decreased spleen weight, hematocrit, and hemoglobin concentration (supplemental Figure 5C-G). In addition, red blood cell counts were lower but not significantly decreased, whereas white blood cell counts were similar. The extent of the anemia induced a higher level of serum Epo concentration in the mutant transplants (Figure 3M). Taken together, these data show that mutation of β-catenin in SEPs impairs their proliferation, which compromises short-term radioprotection after BMT.
Epo induces the production of the PPARγ ligand Δ12-PGJ2 to inhibit macrophage Wnt expression
Epo signaling in macrophages resolves inflammation27,28 and promotes the clearance of dead cells by increasing the expression of PPARγ expression.29 In addition, PPARγ has been shown to antagonize Wnt signaling.30,31 We tested whether Epo treatment of BMDMs could induce PPARγ expression. Treatment over a 72-hour time course led to a 10-fold increase in PPARγ expression. PPARγ is a nuclear hormone receptor that responds to known endogenous and synthetic ligands. Hematopoietic prostaglandin D synthase (HPGDS) is an enzyme downstream of cyclooxygenases that generates prostaglandin D2, which is non-enzymatically converted to Δ12-prostaglandin J2 (Δ12-PGJ2) and its metabolite 15-deoxy-Δ12,14-prostaglandin J2 (15d-PGJ2) by dehydration.32 Δ12-PGJ2 and 15d-PGJ2 are endogenous PPARγ ligands.33,34 BMDMs treated with Epo also showed a threefold increase in HPGDS expression, which correlated with increased levels of Δ12-PGJ2 in the media (Figure 4A). Stat5Δ/Δ mice fail to produce Δ12-PGJ2 in response to Epo, which further demonstrates that Epo induces the production of these PPARγ ligands (supplemental Figure 6). The observed increase in PPARγ expression requires the production of Δ12-PGJ2 because blocking HPGDS activity with the inhibitor HQL-7935 abrogated the Epo-dependent increase in PPARγ expression (Figure 4B). Treatment of cultures with the synthetic PPARγ ligand pioglitazone36 was as effective as treatment with Epo in repressing the expression of Wnt2b and Wnt8a. In contrast, the PPARγ antagonist GW966237 blocked the ability of Epo to decrease Wnt expression as did inhibiting Δ12-PGJ2 production with HQL-79 (Figure 4C). We extended this analysis to human BMDMs and showed that Epo increased the production of Δ12-PGJ2 at both 48 hours and 72 hours in each of 4 distinct human bone marrow samples. Similarly, pioglitazone was as effective as Epo treatment in repressing Wnt2b, and the effect of Epo was blocked by GW9662 and HQL-79 in the human BMDMs (Figure 4D). Unlike human stress erythropoiesis cultures (Figure 2B, right panel), Wnt8a expression was not detectable in human BMDM cultures. These data demonstrate that Epo signaling promotes the production of Δ12-PGJ2, which in turn leads to the PPARγ-dependent repression of Wnt2b and Wnt8a expression.

Epo-dependent PPARγ signaling represses Wnt signaling. (A) mRNA expression of HPGDS and PPARγ (right y-axis) and liquid chromatography–tandem mass spectrometry (LC-MS/MS) analysis of extracellular Δ12-PGJ2 (left y-axis) of mouse BMDMs at indicated time points after Epo treatment. One-way analysis of variance (ANOVA) followed by Dunnett’s multiple comparisons. (*) Indicates P values for comparisons between indicated time points and 0 time point; (red *), HPGDS; (blue *), PPARγ; (black*), Δ12-PGJ2 (n = 3 per time point). (B) mRNA expression of PPARγ in mouse BMDMs treated with or without Epo or Epo plus 25 μM HQL-79 (HPGDS antagonist). (C) mRNA expression of Wnt2b (left) and Wnt8a (right) in mouse BMDMs treated with Epo, 1 μM pioglitazone (Pio; PPARγ agonist), 1 μM GW9662 (GW; PPARγ antagonist), or HQL-79, as indicated. (D) LC-MS/MS analysis of extracellular Δ12-PGJ2 of human BMDMs at the indicated time points before and after Epo treatment. Each set of points represents BMDMs derived from an independent donor (left). mRNA expression of Wnt2b in human BMDMs treated with Epo, Pio, GW, or HQL-79 as indicated (right). Student t test (2-tailed). Data represent means ± SEM. *P < .05; **P < .01; ***P < .001; ****P < .0001.
Epo-dependent PPARγ signaling represses Wnt signaling. (A) mRNA expression of HPGDS and PPARγ (right y-axis) and liquid chromatography–tandem mass spectrometry (LC-MS/MS) analysis of extracellular Δ12-PGJ2 (left y-axis) of mouse BMDMs at indicated time points after Epo treatment. One-way analysis of variance (ANOVA) followed by Dunnett’s multiple comparisons. (*) Indicates P values for comparisons between indicated time points and 0 time point; (red *), HPGDS; (blue *), PPARγ; (black*), Δ12-PGJ2 (n = 3 per time point). (B) mRNA expression of PPARγ in mouse BMDMs treated with or without Epo or Epo plus 25 μM HQL-79 (HPGDS antagonist). (C) mRNA expression of Wnt2b (left) and Wnt8a (right) in mouse BMDMs treated with Epo, 1 μM pioglitazone (Pio; PPARγ agonist), 1 μM GW9662 (GW; PPARγ antagonist), or HQL-79, as indicated. (D) LC-MS/MS analysis of extracellular Δ12-PGJ2 of human BMDMs at the indicated time points before and after Epo treatment. Each set of points represents BMDMs derived from an independent donor (left). mRNA expression of Wnt2b in human BMDMs treated with Epo, Pio, GW, or HQL-79 as indicated (right). Student t test (2-tailed). Data represent means ± SEM. *P < .05; **P < .01; ***P < .001; ****P < .0001.
We next tested whether altering PPARγ activity affected the expansion and transition to differentiation in in vitro stress erythropoiesis cultures. Culturing SEPs in SEEM in the presence of pioglitazone resulted in decreased percentages of the most immature CD34+CD133+KS SEPs coupled with an increase in more mature CD34–CD133–Kit+Sca1– (CD34–CD133–K+S–) SEPs (Figure 5A). Furthermore, when SEPs were switched to SEDM, addition of GW9662 blocked the transition and led to an increased percentage of immature CD34+CD133+KS SEPs (Figure 5B). When we assayed stress BFU-E formation, pioglitazone increased the frequency of stress BFU-Es in the absence of Epo, whereas GW9662 or HQL-79 blocked the Epo-dependent increase in stress BFU-Es (Figure 5C). These data show that PPARγ acts downstream of Epo to promote the SEP transition to differentiation by antagonizing Wnt signaling during stress erythropoiesis.

Epo-dependent PPARγ signaling promotes SEP differentiation. Analysis of the effects of manipulating PPARγ signaling in in vitro stress erythropoiesis cultures. Unfractionated bone marrow cells were cultured in SEEM or SEDM with indicated treatments.(A) Flow cytometry analysis of in vitro cultured SEPs in SEEM with or without 1 μM Pio. Percentage of CD34+CD133+KS SEPs and CD34–CD133–K+S– SEPs in total cell population (left). Total cell numbers after culture (right). (B) Flow cytometry analysis of in vitro cultured SEPs in SEDM with or without 1 μM GW. Percentage of CD34+CD133+KS SEPs in total cell population (left). Total cell numbers after culture (right). (C) Stress BFU-E colony assay of in vitro cultured SEPs expanded in SEEM and then treated with Epo, Pio, GW, or HQL-79 as indicated. Student t test (2-tailed). Data represent means ± SEM. *P < .05; **P < .01.
Epo-dependent PPARγ signaling promotes SEP differentiation. Analysis of the effects of manipulating PPARγ signaling in in vitro stress erythropoiesis cultures. Unfractionated bone marrow cells were cultured in SEEM or SEDM with indicated treatments.(A) Flow cytometry analysis of in vitro cultured SEPs in SEEM with or without 1 μM Pio. Percentage of CD34+CD133+KS SEPs and CD34–CD133–K+S– SEPs in total cell population (left). Total cell numbers after culture (right). (B) Flow cytometry analysis of in vitro cultured SEPs in SEDM with or without 1 μM GW. Percentage of CD34+CD133+KS SEPs in total cell population (left). Total cell numbers after culture (right). (C) Stress BFU-E colony assay of in vitro cultured SEPs expanded in SEEM and then treated with Epo, Pio, GW, or HQL-79 as indicated. Student t test (2-tailed). Data represent means ± SEM. *P < .05; **P < .01.
Epo-dependent production of PGE2 promotes differentiation of SEPs
In addition to PGJ2, other bioactive eicosanoids are generated by synthases acting downstream of cyclooxygenases 1 and 2 (COX-1 and COX-2).38 We observed that Epo treatment of murine BMDMs increased the expression of prostaglandin E synthase (PTGES or mPGES-1). PGE2 is known to promote the generation of erythroid and multilineage progenitor cells, which suggests that PGE2 may play a role in regulating differentiation of SEPs.39-42 We examined PGE2 production in murine BMDMs after treatment with Epo and observed a significant increase in PGE2 production at 48 hours and 72 hours after Epo treatment, which was synchronized with the increased mRNA expression of PTGES (Figure 6A). These data show that PGE2 and Δ12-PGJ2 were produced simultaneously from macrophages, implying that Epo regulates both prostaglandins in parallel. In vivo, during recovery from BMT, PGE2 production in the spleen follows the increase in serum Epo levels (Figure 6B). Furthermore, human BMDMs derived form 4 distinct donors each showed increased extracellular PGE2 after treatment with Epo (Figure 6C). Although Epo seems to increase both PGJ2 and PGE2 simultaneously, PGE2 had no effect on the expression of Wnt2b and Wnt8a (supplemental Figure 7A). Similarly, PPARγ-dependent repression of Wnt signaling does not affect the increase in PGE2 production. When we examined PTGES expression in cells cultured with the PPARγ antagonist GW9662 or the Wnt pathway activator BIO, PTGES was consistently increased in SEDM, regardless of whether the cells were treated with GW9662 or BIO. The data demonstrate that PGE2 production is directly regulated by Epo and is not a consequence of increased Δ12-PGJ2 (supplemental Figure 7B). To define the function of PGE2 in regulating development of SEPs, we analyzed the effects of PGE2 treatment on SEPs in vitro. Addition of 16,16-dimethyl-PGE2 (dmPGE2) to bone marrow cells cultured in SEEM decreased the percentage of the most immature SEPs (CD34+CD133+KS cells) (Figure 6D). In contrast, when we inhibited PTGES with CAY10526 in cells grown in SEDM, we observed a significant decrease in total cell numbers accompanied by a moderately increased percentage of immature SEPs. This observation shows that there was an inhibition of differentiation when PGE2 production was suppressed (Figure 6E). Analysis of stress BFU-E production showed that in the absence of Epo, exogenously added dmPGE2 could induce a significant increase in stress BFU-Es and when dmPGE2 was added with Epo, we observed a significant increase in stress BFU-Es over Epo alone. Conversely, if we inhibited PTGES with CAY10526, the number of stress BFU-Es induced by Epo was significantly decreased (Figure 6F). These data support a role for PGE2 in promoting the differentiation of stress BFU-Es that is independent of Δ12-PGJ2 and PPARγ-dependent suppression of Wnt expression. These 2 signals work together. Addition of Wif1 to inhibit Wnt signaling and dmPGE2 to promote differentiation to SEPs cultured in SEEM induces a significant increase in stress BFU-E in the absence of Epo (Figure 6G).
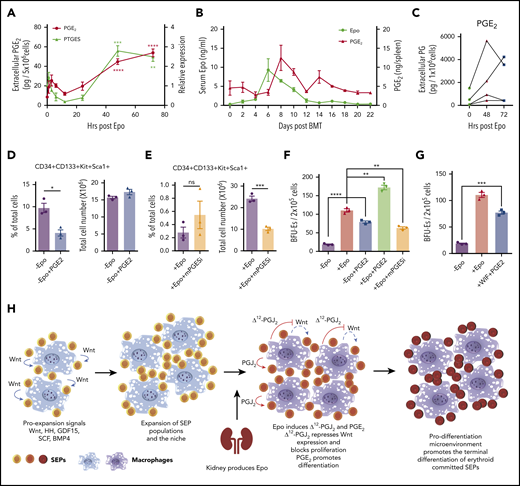
Epo-dependent macrophage-derived PGE2 signaling enhances SEP differentiation. (A) LC-MS/MS analysis of extracellular PGE2 (left y-axis) and mRNA expression of PTGES (right y-axis) in mouse BMDMs at the indicated time points before and after Epo treatment. One-way ANOVA followed by Dunnett’s multiple comparisons. (*) Represents P values for comparisons between indicated time points and 0 time point; (red *), PTGES; (black *), PGE2 (n = 3 per time point). (B) ELISA analysis of serum Epo and spleen PGE2 on indicated days after BMT. In all, 500 000 unfractionated bone marrow cells were transplanted to C57BL/6 recipients. For each time point, n = 3 mice per group. (C) LC-MS/MS analysis of extracellular PGE2 of human BMDMs at the indicated time points before and after Epo treatment. (D-E) Analysis of manipulating PGE2 signaling in in vitro SEP cultures. (D) SEPs cultured in SEEM were treated with or without 50 nM 16,16-dimethyl PGE2. Flow cytometry analysis of in vitro cultured SEPs. Percentage of CD34+CD133+KS SEPs in total cell population (left); total cell numbers after culture (right). (E) SEPs were cultured in SEDM with or without 10 μM CAY10526 (mPGESi, the PTGES inhibitor). Flow cytometry analysis of in vitro cultured SEPs. Percentage of CD34+CD133+KS SEPs in total cell population (left); total cell numbers after culture (right). (F-G) Bone marrow cells were expanded in SEEM and treated with Epo, PGE2, mPGESi, or WIF1, as indicated. (H) Schematic of macrophage-SEP interactions and the changes in signaling induced by macrophage EpoR signaling. Student t test (2-tailed). Data represent means ± SEM. *P < .05; **P < .01; ***P < .001; ****P < .0001.
Epo-dependent macrophage-derived PGE2 signaling enhances SEP differentiation. (A) LC-MS/MS analysis of extracellular PGE2 (left y-axis) and mRNA expression of PTGES (right y-axis) in mouse BMDMs at the indicated time points before and after Epo treatment. One-way ANOVA followed by Dunnett’s multiple comparisons. (*) Represents P values for comparisons between indicated time points and 0 time point; (red *), PTGES; (black *), PGE2 (n = 3 per time point). (B) ELISA analysis of serum Epo and spleen PGE2 on indicated days after BMT. In all, 500 000 unfractionated bone marrow cells were transplanted to C57BL/6 recipients. For each time point, n = 3 mice per group. (C) LC-MS/MS analysis of extracellular PGE2 of human BMDMs at the indicated time points before and after Epo treatment. (D-E) Analysis of manipulating PGE2 signaling in in vitro SEP cultures. (D) SEPs cultured in SEEM were treated with or without 50 nM 16,16-dimethyl PGE2. Flow cytometry analysis of in vitro cultured SEPs. Percentage of CD34+CD133+KS SEPs in total cell population (left); total cell numbers after culture (right). (E) SEPs were cultured in SEDM with or without 10 μM CAY10526 (mPGESi, the PTGES inhibitor). Flow cytometry analysis of in vitro cultured SEPs. Percentage of CD34+CD133+KS SEPs in total cell population (left); total cell numbers after culture (right). (F-G) Bone marrow cells were expanded in SEEM and treated with Epo, PGE2, mPGESi, or WIF1, as indicated. (H) Schematic of macrophage-SEP interactions and the changes in signaling induced by macrophage EpoR signaling. Student t test (2-tailed). Data represent means ± SEM. *P < .05; **P < .01; ***P < .001; ****P < .0001.
Discussion
In contrast to steady-state erythropoiesis, stress erythropoiesis is not a continuous process. Progenitor cells proliferate in the spleen and then synchronously differentiate to generate a wave of new erythrocytes. Furthermore, it takes 21 days before a second wave of erythrocytes can be generated.8 Precise regulation of the proliferation and differentiation of SEPs is required to generate enough erythrocytes to maintain homeostasis. Here we have identified a novel paradigm in which Epo produced by the kidney alters signals produced by the splenic niche to induce differentiation. Macrophage-derived canonical Wnt ligands increase at the early stage of stress erythropoiesis. These signals, in combination with the previously identified factors SCF, BMP4, GDF15, and Hedgehog, drive the efficient proliferation of immature SEPs. These observations fit previous data showing that BMP- and Wnt-dependent transcription factors work in concert with lineage-specific transcription factors during regeneration.43 Epo acts on the splenic niche to switch the predominant niche signal from proliferation to differentiation. Niche macrophages produce lipid messengers in response to Epo. Increased Δ12-PGJ2 production activates PPARγ activity, which inhibits the expression of canonical Wnt’s and decreases proliferation. Subsequently, increased PGE2 production promotes differentiation. The central player in this transition to differentiation is Epo signaling, which orchestrates arachidonic acid metabolism in macrophages to generate distinct bioactive eicosanoids (Figure 6H).
These data also underscore the key role of macrophages in the niche. The correlation between macrophages and erythroid progenitor cells has been intensively studied since EBIs were first reported by Marcel Bessis.44-47 Depletion of macrophages severely compromises stress erythropoiesis in vitro and in vivo.5,9,11 The splenic niche expands with the proliferation of SEPs because proinflammatory signals induce tissue-resident red pulp macrophages to recruit monocytes into the spleen. The recruited monocytes contribute to the majority of the EBIs where they mature in concert with the SEPs. Immature SEPs are present in EBIs containing a central macrophage expressing more monocyte-like markers, whereas late-stage progenitors interact with EBIs containing cells that express red-pulp macrophage markers.10,25 These data coupled with our findings suggest that there is coordinated regulation of niche development, the expansion and differentiation of SEPs, and the expression of Epo in the kidney, which ensures that the timing of niche maturation and expansion of SEP populations is optimal for generating erythrocytes to maintain homeostasis.
Recent work from Li et al13 showed that EBI niche macrophages are characterized by their expression of EpoR. Our data are consistent with those observations and suggest that Epo-dependent signaling in EBIs plays a key role in regulating proliferation and differentiation of SEPs. However, this observation also points to the potential for aberrant EpoR signaling in macrophages to contribute to the pathology of hematologic disease. Expression of the Jak2V617F protein in myeloid cells causes erythrocytosis and expansion of EBIs in the splenic niche, suggesting that enhanced EpoR signaling in macrophages contributes to the development of myeloproliferative disease.48 This role of pathological macrophage signals was further demonstrated when depletion of macrophages was shown to alleviate the erythrocytosis in a murine model of polycythemia.9,11 These defects in regulation by niche macrophages is not limited to overproduction of erythrocytes. Depletion of macrophages with clodronate liposomes ameliorates the anemia in a murine β-thalassemia model (Hbbth3/+), suggesting that the inefficient erythropoiesis in Hbbth3/+ mice results from improper macrophage-dependent regulation of differentiation.11 These data highlight the crucial role of the macrophages in the EBI niche and underscore the potential for manipulating the niche as a treatment for anemia and polycythemia.
The online version of this article contains a data supplement.
The publication costs of this article were defrayed in part by page charge payment. Therefore, and solely to indicate this fact, this article is hereby marked “advertisement” in accordance with 18 USC section 1734.
Original data can be obtained by contacting the corresponding author at rfp5@psu.edu.
The data reported in this article have been deposited in the Gene Expression Omnibus database (accession number GSE122390).
Acknowledgments
The authors thank the members of the Paulson and Prabhu labs for their insight and comments on the work, especially Chang Liao for her advice on EBI analysis by imaging flow cytometry and Lothar Hennighausen for providing the Stat5fx/fx mice.
This work was supported, in part, by grants R01 DK080040 (R.F.P) and R01 DK077152 from the National Institutes of Health, National Institute of Diabetes and Digestive and Kidney Diseases, and by the Office of Dietary Supplements (K.S.P.) and US Department of Agriculture–National Institute of Food and Agriculture Hatch project numbers PEN04581 (Accession No. 1005468) (R.F.P.) and PEN04605 (Accession No. 1010021) (K.S.P.).
Authorship
Contribution: Y.C., J.X., K.S.P., and R.F.P. designed experiments and analyzed data; Y.C., J.X., F.Q., B.T.D., B.R., and S.H. performed the experiments; Y.C. and R.F.P. wrote the manuscript; and all the authors commented on the manuscript.
Conflict-of-interest disclosure: R.F.P. serves as a consultant for Rubius Therapeutics. The remaining authors declare no competing financial interests.
The current affiliation for J.X. is the University of Michigan Kidney Epidemiology and Cost Center, Ann Arbor, MI.
The current affiliation for B.T.D. is the Department of Pharmacology and Experimental Therapeutics, College of Pharmacy and Pharmaceutical Sciences, Frederic and Mary Wolfe Center, The University of Toledo, Toledo, OH.
Correspondence: Robert F. Paulson, Department of Veterinary and Biomedical Sciences, Center for Molecular Immunology and Infectious Disease, 108B Research Building A, The Pennsylvania State University, University Park, PA 16802-3500; e-mail rfp5@psu.edu.


