Key Points
XPO1 blockade causes thrombocytopenia by inhibiting TPO signaling and blocking the differentiation of stem cells into megakaryocytes.
Selinexor-induced thrombocytopenia is reversible when TPO agonists are administered in the absence of selinexor (drug holiday).
Abstract
Selinexor is the first oral selective inhibitor of nuclear export compound tested for cancer treatment. Selinexor has demonstrated a safety therapy profile with broad antitumor activity against solid and hematological malignancies in phases 2 and 3 clinical trials (#NCT03071276, #NCT02343042, #NCT02227251, #NCT03110562, and #NCT02606461). Although selinexor shows promising efficacy, its primary adverse effect is high-grade thrombocytopenia. Therefore, we aimed to identify the mechanism of selinexor-induced thrombocytopenia to relieve it and improve its clinical management. We determined that selinexor causes thrombocytopenia by blocking thrombopoietin (TPO) signaling and therefore differentiation of stem cells into megakaryocytes. We then used both in vitro and in vivo models and patient samples to show that selinexor-induced thrombocytopenia is indeed reversible when TPO agonists are administered in the absence of selinexor (drug holiday). In sum, these data reveal (1) the mechanism of selinexor-induced thrombocytopenia, (2) an effective way to reverse the dose-limiting thrombocytopenia, and (3) a novel role for XPO1 in megakaryopoiesis. The improved selinexor dosing regimen described herein is crucial to help reduce thrombocytopenia in selinexor patients, allowing them to continue their course of chemotherapy and have the best chance of survival. This trial was registered at www.clinicaltrials.gov as #NCT01607905.
Introduction
A novel approach to the treatment of cancer is the use of therapies to preferentially target tumor suppressor gene pathways in malignant cells. Selinexor is the first oral selective inhibitor of nuclear export (SINE) compound tested for cancer treatment. SINE compounds inhibit exportin 1 (XPO1)–mediated nuclear-cytoplasmic translocation by covalently binding to cysteine 528 in the XPO1 cargo binding pocket.1-4 XPO1 is responsible for the nuclear-cytoplasmic export of several major tumor suppressor proteins (TSPs) and growth regulatory proteins, such as p53, p21, FOXO, IκB, pRB, p27, APC, BRCA1, and PP2Aα.5 Multiple types of tumors evade the lethal effect of TSPs through overexpression of XPO1, resulting in the expulsion of TSPs from their nuclear site of action (reviewed in Senapedis et al6 and Ishizawa et al7 ). Therefore, blocking XPO1 restores and enhances nuclear localization of TSPs, leading to cancer cell death with minimal effect on normal cells.6,7 Selinexor is currently in several phase 1, 2, and 3 clinical trials in patients with advanced, relapsed, or refractory cancers in both solid and hematological malignancies (#NCT03071276, #NCT02343042, #NCT02227251, #NCT03110562, and #NCT02606461; www.clinicaltrials.gov).8 In addition, a recent paper demonstrated that selinexor inhibits KRAS activity both in vitro and in vivo.9 KRAS proteins are implicated in many of the most lethal human cancers; these data indicate that selinexor may be a promising therapeutic strategy for patients with KRAS-driven cancers, including non–small cell lung cancer.9
Although selinexor shows promising efficacy in the treatment of several types of hard-to-treat cancers, its primary adverse effect, high-grade thrombocytopenia (low platelet count), is a significant concern. In a recent report of a selinexor phase 1 clinical trial, Razak et al detail selinexor adverse effects in 189 patients; overall 37% of patients developed thrombocytopenia in doses below 40 mg/m2 (68 mg flat dose) vs 59% in higher selinexor doses.8 Drug-induced thrombocytopenia can be triggered by a wide range of medications and can be life threatening.10 Medications are capable of causing clinically significant thrombocytopenia by one or a combination of the following mechanisms: inhibition of megakaryocyte (MK) development, inhibition of platelet biogenesis, and premature destruction or clearance of platelets. In addition, certain drugs, particularly those used for cancer therapy and immune regulation, tend to suppress hematopoiesis and produce thrombocytopenia.11
In this study, we aimed to determine the mechanism by which selinexor treatment reduces platelet counts in patients. Resolving this question is essential to optimize drug dosing to achieve maximal efficacy of tumor inhibition, while minimizing the nondesired thrombocytopenia adverse effect. Determining the mechanism of selinexor-induced thrombocytopenia is expected to (1) help design appropriate treatment strategies for recovering platelet counts in affected patients, (2) elucidate the mechanistic role of XPO1 in megakaryopoiesis, and (3) provide insights into what may be causing drug-induced thrombocytopenia in other SINE and related compounds. To achieve this, we initiated our studies by testing whether selinexor interferes with hematopoietic stem cell (HSC) differentiation into MKs, MK maturation, platelet production, and platelet activation.
Materials and methods
Reagents
Selinexor was provided by Karyopharm Therapeutics (Newton, MA). Antibodies were purchased as follows: P-selectin (BD, Franklin Lakes, NJ), annexin V (Life Technologies, Carlsbad, CA), CD41/61 (Emfret Analytics, Eibelstadt, Germany), and total STAT3, phosphorylated STAT3 (pSTAT3), actin, glyceraldehyde-3-phosphate dehydrogenase (GAPDH), and histone H3 (Cell Signaling, Danvers, MA). Recombinant human and murine thrombopoietin (TPO) was purchased from PeproTech (Rocky Hill, NJ). Gapdh, Klf4, and Oct4 primer and probe sets were purchased from Thermo Fisher Scientific (Waltham, MA).
Platelet counts in patients in the selinexor solid cancer phase 1 clinical trial
Platelet counts were determined from whole blood collected from patients with solid tumors enrolled in a phase 1 study of selinexor (#NCT01607905). The study was approved by the independent ethics committee for each site, and was conducted in accordance with the Declaration of Helsinki. All patients provided informed written consent. The study was sponsored by Karyopharm Therapeutics and registered at www.clinicaltrials.gov (#NCT01607905).8
Selinexor treatment in mice
TPO knockout mice were the generous gift of Ann Mullally and Genentech. Mice were orally gavaged with 15 or 20 mg/kg of selinexor every other day, for 3 doses per week for 1 to 3 weeks, as indicated, and recombinant murine TPO was intravenously dosed at 0.3 mg/kg once a week.
Statistical analyses
χ2 tests were used to assess correlations between dose level and frequency of thrombocytopenia. Data were considered significant at P ≤ .05. Statistical significance of differences between groups was determined using a 2-tailed Student t test. For paired analyses, statistical significance was determined using multiple t tests comparing each treatment group with the vehicle control, followed by the Holm-Sidak method, with α = 5.000%, as previously described.12,13 Each row was analyzed individually, without assuming a consistent standard deviation (SD). All data are presented as mean ± SD. Significance was set at P ≤ .05.
Please see supplemental Data for additional methods (available on the Blood Web site).
Results
Selinexor treatment leads to thrombocytopenia in patients
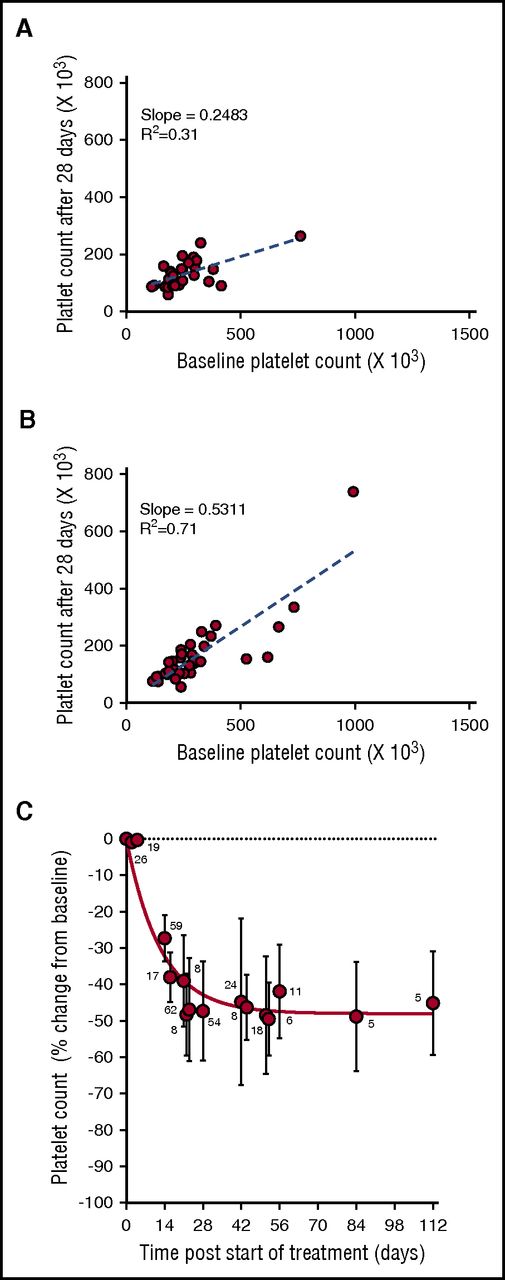
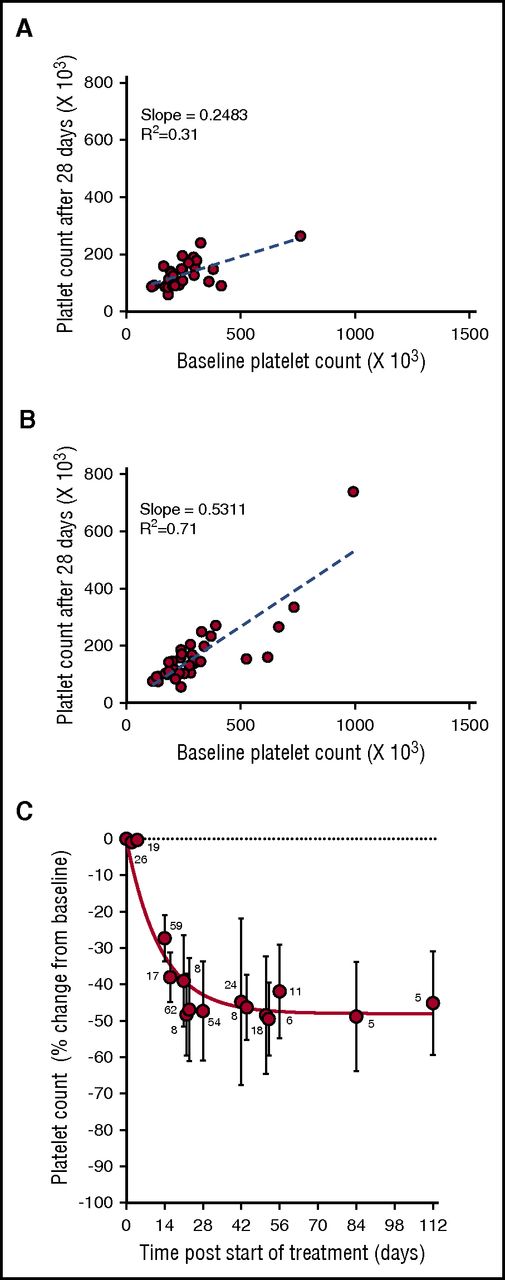
During the phase 1 clinical study of selinexor, in patients with advanced solid tumors (#NCT01607905), 8 treatment schedules were investigated.8 Selinexor in doses between 3 and 85 mg/m2 (∼5-145 mg fixed doses) was administrated, 1 to 3 times a week, in 21 or 28 days per treatment cycle. Thrombocytopenia was one of the most common treatment-related adverse events in the 189 patients in this trial.8 Analysis of the change in platelet counts on day 29 (cycle 2, day 1) compared with baseline was done in 64 patients. This analysis showed higher reductions in platelet counts in the 28 patients who received selinexor at doses of ≥100 mg twice weekly (Figure 1A) compared with the 36 patients who received selinexor at 50 to 70 mg (Figure 1B). Induced platelet loss reached its maximum by 29 days without additional loss for at least up to 112 days, despite continued selinexor dosing (Figure 1C).
Selinexor affects the platelet counts of patients with solid tumors in a dose-dependent manner. (A) Absolute platelet count as a function of platelet count at baseline for patients treated with 7 to 8 high doses of selinexor (>100 mg) in the first 28-day cycle (N = 28). (B) Absolute platelet count as a function of platelet count at baseline for patients treated with 7 to 8 low doses of selinexor (50-70 mg) in the first 28-day cycle (N = 36). Each point represents the platelet count of an individual patient. The regression lines were derived from the average platelet count loss from baseline (slope values 0.24 and 0.53, R2 = 0.31 and R2 = 0.71, respectively). (C) Average (±SD) change in platelet count as function of time for patients treated with 7 to 8 doses of selinexor (30-145 mg) per 28-day cycle. The number of patients for each time point is listed on the graph.
Selinexor affects the platelet counts of patients with solid tumors in a dose-dependent manner. (A) Absolute platelet count as a function of platelet count at baseline for patients treated with 7 to 8 high doses of selinexor (>100 mg) in the first 28-day cycle (N = 28). (B) Absolute platelet count as a function of platelet count at baseline for patients treated with 7 to 8 low doses of selinexor (50-70 mg) in the first 28-day cycle (N = 36). Each point represents the platelet count of an individual patient. The regression lines were derived from the average platelet count loss from baseline (slope values 0.24 and 0.53, R2 = 0.31 and R2 = 0.71, respectively). (C) Average (±SD) change in platelet count as function of time for patients treated with 7 to 8 doses of selinexor (30-145 mg) per 28-day cycle. The number of patients for each time point is listed on the graph.
Selinexor does not affect mature MKs or platelets
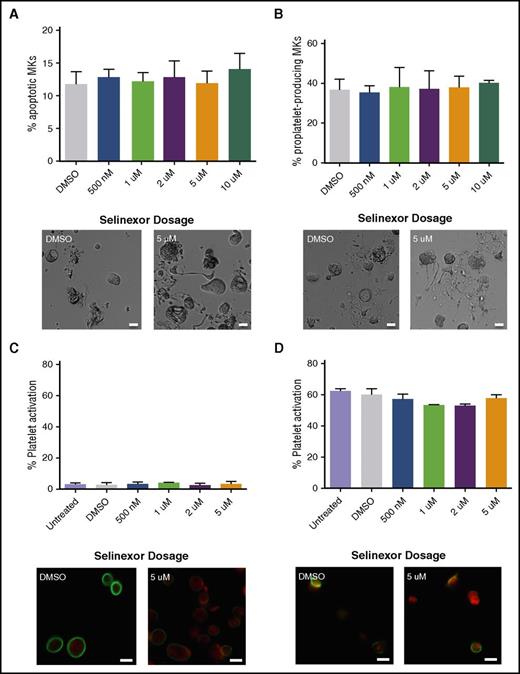
Because selinexor induced thrombocytopenia in approximately half of the treated patients, we were interested in determining the cause of this reduction in platelet count.8 First, we hypothesized that selinexor may be preventing platelet formation by either killing mature MKs in the bone marrow or preventing them from forming proplatelets. We first tested the effects of selinexor on mature murine fetal liver–derived MKs on day 4 (D4) of development, immediately preceding proplatelet formation. Selinexor did not affect MK viability (Figure 2A) or proplatelet formation (Figure 2B).12-14 These data suggest that selinexor does not affect mature MKs once they have developed in the bone marrow. Next, using human platelets from healthy donors, we examined whether selinexor directly impacted mature platelets. Because selinexor inhibits XPO1, which exclusively regulates nuclear export of its target proteins, we did not expect it to alter platelet biology, as platelets are anucleate. As anticipated, selinexor did not alter platelet activation status; exposure of platelets to selinexor alone did not induce their activation (Figure 2C), nor did selinexor treatment inhibit thrombin-induced platelet activation (Figure 2D).
Selinexor does not affect MK apoptosis, proplatelet formation, or platelet activation. (A-B) Mature, round mouse MKs derived from murine fetal livers were treated with increasing doses of selinexor. Six hours later, viability of the MKs and the number of proplatelet-producing MKs were quantified. Bars represent 20 μm; n = 3. Mature donor human platelets were treated with increased concentrations of selinexor in the absence (C) or the presence (D) of thrombin, and platelet surface P-selectin was analyzed by fluorescence-activated cell sorter (FACS). Representative images of resting (C) and activated (D) platelets stained with actin (phalloidin, red) and anti-β1-tubulin antibody (green). Bars represent 2 μm; n = 3. DMSO, dimethyl sulfoxide.
Selinexor does not affect MK apoptosis, proplatelet formation, or platelet activation. (A-B) Mature, round mouse MKs derived from murine fetal livers were treated with increasing doses of selinexor. Six hours later, viability of the MKs and the number of proplatelet-producing MKs were quantified. Bars represent 20 μm; n = 3. Mature donor human platelets were treated with increased concentrations of selinexor in the absence (C) or the presence (D) of thrombin, and platelet surface P-selectin was analyzed by fluorescence-activated cell sorter (FACS). Representative images of resting (C) and activated (D) platelets stained with actin (phalloidin, red) and anti-β1-tubulin antibody (green). Bars represent 2 μm; n = 3. DMSO, dimethyl sulfoxide.
Selinexor inhibits maturation of MK from progenitor cells
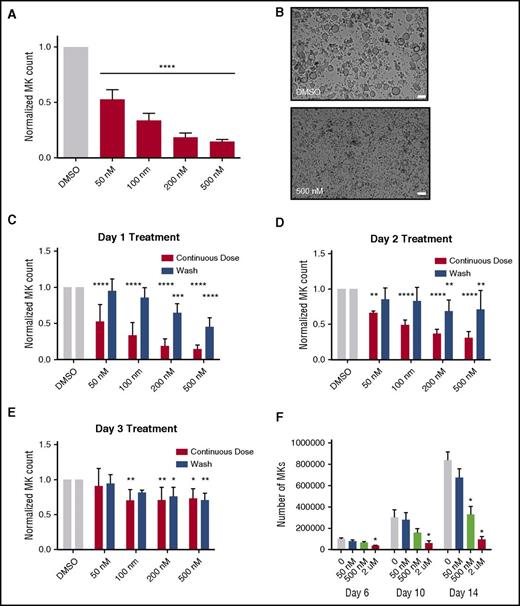
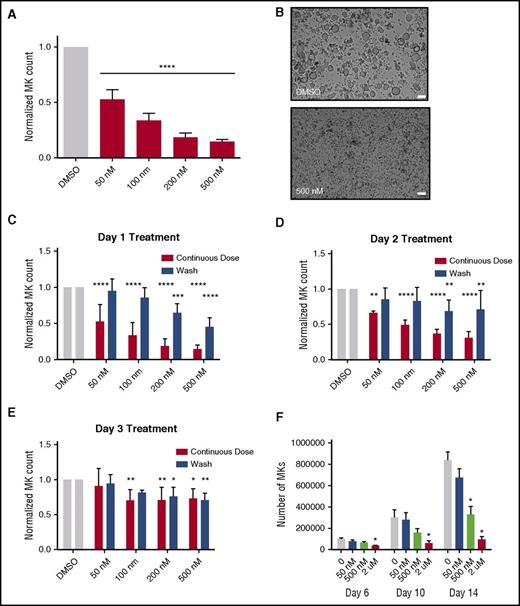
Because selinexor did not significantly impact mature MK viability, proplatelet formation, or platelet activation status, we next examined whether it affected earlier stages of MK maturation. In our culture system, murine MK progenitor cells derived from fetal livers (HSCs) take 4 days to mature. We therefore treated the HSCs with increasing doses of selinexor on D1 of maturation and measured the number of MKs that developed from the harvested HSCs on D4. MK development was significantly inhibited in a dose-dependent fashion; treatment with 200 and 500 nM selinexor induced an 81% and 85% reduction in the total number of MKs, respectively (P < .0001; Figure 3A-B). These results suggest that selinexor significantly inhibited the development of D1 HSCs into MKs.
Selinexor treatment of murine fetal liver cells inhibits mature MK formation. Murine fetal liver cells were treated with selinexor at indicated doses on D1 of maturation, and the MK population was quantified with FACS (A) and visualized under the microscope on D4 (B). ****P < .0001 vs DMSO control. Bars represent 50 μm; n = 4. (C-E) Murine fetal liver cells were dosed with selinexor at D1, D2, or D3 of maturation either continuously until D4 (red bars) or selinexor was washed out after 6 hours (blue bars). On D4, the MK population was quantified with FACS. Values were normalized to DMSO control for each biological replicate, and then replicates averaged. *P < .05; **P < .01; ***P < .001; ****P < .0001 vs DMSO control; n = 3. (F) Human CD34+ peripheral blood cells were continuously treated with selinexor beginning on D3 of maturation at the indicated doses, and the number of mature MKs was quantified by FACS based on CD41/61 positivity on D6, D10, and D14. *P < .05; n = 4.
Selinexor treatment of murine fetal liver cells inhibits mature MK formation. Murine fetal liver cells were treated with selinexor at indicated doses on D1 of maturation, and the MK population was quantified with FACS (A) and visualized under the microscope on D4 (B). ****P < .0001 vs DMSO control. Bars represent 50 μm; n = 4. (C-E) Murine fetal liver cells were dosed with selinexor at D1, D2, or D3 of maturation either continuously until D4 (red bars) or selinexor was washed out after 6 hours (blue bars). On D4, the MK population was quantified with FACS. Values were normalized to DMSO control for each biological replicate, and then replicates averaged. *P < .05; **P < .01; ***P < .001; ****P < .0001 vs DMSO control; n = 3. (F) Human CD34+ peripheral blood cells were continuously treated with selinexor beginning on D3 of maturation at the indicated doses, and the number of mature MKs was quantified by FACS based on CD41/61 positivity on D6, D10, and D14. *P < .05; n = 4.
Treatment of murine MK progenitor cells on D1 significantly affected MK maturation (Figure 3A-C). Conversely, treatment of murine MKs on D4 of maturation had no effect on apoptosis, maturation, or proplatelet formation (Figure 2A-B). Therefore, we wanted to examine the impact of selinexor treatment on D2 and D3 to determine if there was a specific window in MK maturation in which selinexor’s effects were most potent. Treatment with 500 nM selinexor on D2 and D3 induced only 69% and 34% reductions, respectively (Figure 3D-E). These results reveal that MKs are less susceptible to selinexor as they mature and hint that selinexor may be targeting an early stage of differentiation and development. Importantly, these effects were substantially reversible. In human patients, selinexor demonstrates a median time to peak serum concentration (Tmax) of 2 to 4 hours and a terminal half-life (t1/2) of 6 to 7 hours with no evidence of drug accumulation.8 Specifically, at the relevant recommended phase 2 dose of 35 mg/m2 (60 mg fixed dose) twice a week, selinexor reached a maximal serum concentration of 710 nM at 4 hours and declined below 100 nM after ∼24 hours.8 Therefore, we mimicked the serum half-life in vitro by removing the drug from cell cultures after 6 hours to more precisely study the conditions cells would see in vivo after 1 selinexor dosage. The number of MKs that developed after 6-hour treatment with 500 nM selinexor on D1 was reduced by only 55%, as compared with the 85% with the continuous D1 dosing (Figure 3C); this trend was dose dependent and also true for MKs treated on D2 and D3 (Figure 3D-E). These data suggest that even after being treated with selinexor, MK precursor cells maintain the potential to differentiate into mature MKs upon removal of selinexor.
To confirm that this blockade in MK maturation was not restricted to murine MKs and their progenitors, human cord blood–derived CD34+ cells were treated with selinexor at varying doses (Figure 3F). Selinexor treatment was performed on D3, and the number of MKs (CD41+ cells) was quantified by FACS on D6, D10, and D14 of maturation. As with the fetal liver–derived cells, there was a dose-dependent decrease in the number of mature MKs. On D14, 500 nM selinexor significantly reduced the number of MKs by ∼61% (Figure 3F), confirming that the effect of selinexor was not species specific.
Our data suggest that some MKs were able to develop in the presence of selinexor. We were interested in determining if these MKs were unique in some way that provided them resistance to selinexor treatment. First, we determined whether these MKs were developmentally different by examining MK ploidy (a measure of maturation) in selinexor-treated MKs.12 Although fewer MKs developed, the ones that completed differentiation had a ploidy distribution that was not significantly altered (Figure 4A). The exception was the highest dose, 500 nM, where the ploidy was shifted from predominantly 16N to 2N (P < .0001). However, even this difference in ploidy was reversed when selinexor was washed out after 6 hours of treatment (Figure 4B). Second, to examine the MK morphology, we performed transmission electron microscopy on MKs after selinexor treatments to view internal MK structures (Figure 4C). As visible in Figure 4C, there were no significant differences in internal MK structures, including the demarcation membrane system, nucleus, and granules, after selinexor treatment. Multiple images are shown of MKs treated with 200 nM selinexor to give adequate representative images. These data support the hypothesis that selinexor is not cytotoxic to cells. In addition, these data suggest that there is a population of MKs that are unaffected by selinexor treatment.
MKs that overcome selinexor treatment have normal ploidy and morphology. Murine fetal liver cells were dosed with selinexor at D1 of maturation either continuously until D4 (A) or selinexor was washed out after 6 hours (B). On D4, the ploidy of the resulting MK population was quantified with FACS. *P < .05 vs vehicle control (DMSO); n = 3. (C) Representative transmission electron microscopy images of MKs showing polyploid nucleus (N), demarcation membrane (DMS), and granules (*). Bars represent 2 μM.
MKs that overcome selinexor treatment have normal ploidy and morphology. Murine fetal liver cells were dosed with selinexor at D1 of maturation either continuously until D4 (A) or selinexor was washed out after 6 hours (B). On D4, the ploidy of the resulting MK population was quantified with FACS. *P < .05 vs vehicle control (DMSO); n = 3. (C) Representative transmission electron microscopy images of MKs showing polyploid nucleus (N), demarcation membrane (DMS), and granules (*). Bars represent 2 μM.
Selinexor reduces MK number in the murine bone marrow in vivo
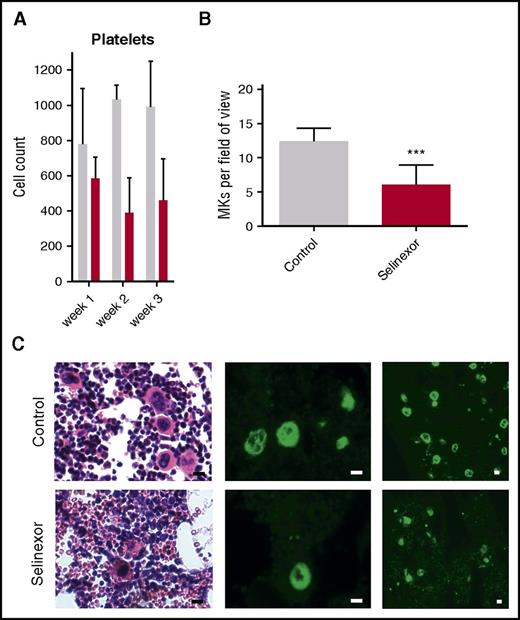
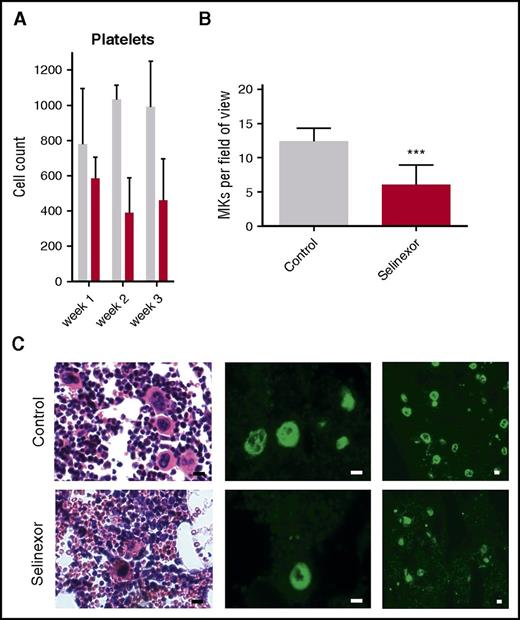
We next wanted to confirm our results in an in vivo model and therefore tested if selinexor inhibits MK development in mice. CD1 mice were orally dosed with selinexor (15 mg/kg, equivalent to ∼77 mg fixed dose in human) or vehicle 3 times a week for 3 weeks. As observed in the patients in the clinical study (Figure 1), selinexor reduced platelet counts in mice by 40% to 50% within 2 to 3 weeks (Figure 5A). Histologic examination determined there was a significant reduction in the number of bone marrow MKs in the femurs of mice treated with selinexor (Figure 5B-C). This result is consistent with both our in vitro data showing that selinexor decreased MK maturation from progenitor cells and in vivo data showing thrombocytopenia in humans and mice.
Selinexor reduced blood cell counts in mice and the number of MKs in the bone marrow. (A) CD1 mice (N = 4 per cohort) were treated with saline vehicle (gray bars) or selinexor (red bars, 20 mg/kg by mouth, every other day, three times per week) for 3 weeks. Platelet counts were done at the end of each week of treatment. (B) Quantification of MKs in femur bone marrow sections. Images spanning 1 complete longitudinal cross section of the entire femur from 2 femurs per mouse were used for quantification. Each mouse (2 femurs) was considered 1 biological replicate. N = 4 per cohort; ***P < .001. (C) Representative hematoxylin and eosin images (×20) and high (×20) and low (×10) magnification immunofluorescence staining for von Willebrand factor showing MKs in bone marrow. N = 4 mice per cohort; bars represent 10 μm.
Selinexor reduced blood cell counts in mice and the number of MKs in the bone marrow. (A) CD1 mice (N = 4 per cohort) were treated with saline vehicle (gray bars) or selinexor (red bars, 20 mg/kg by mouth, every other day, three times per week) for 3 weeks. Platelet counts were done at the end of each week of treatment. (B) Quantification of MKs in femur bone marrow sections. Images spanning 1 complete longitudinal cross section of the entire femur from 2 femurs per mouse were used for quantification. Each mouse (2 femurs) was considered 1 biological replicate. N = 4 per cohort; ***P < .001. (C) Representative hematoxylin and eosin images (×20) and high (×20) and low (×10) magnification immunofluorescence staining for von Willebrand factor showing MKs in bone marrow. N = 4 mice per cohort; bars represent 10 μm.
Selinexor blocks TPO signaling in vitro
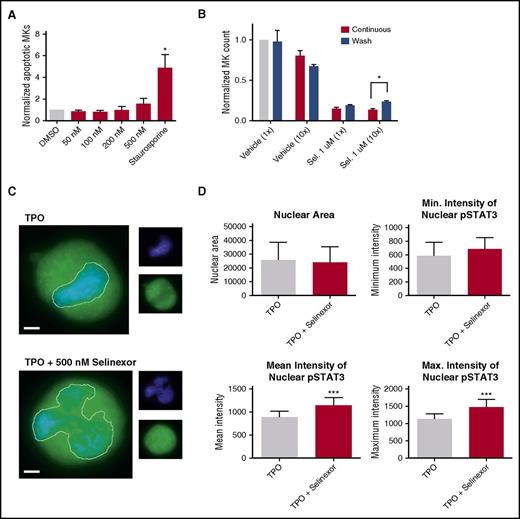
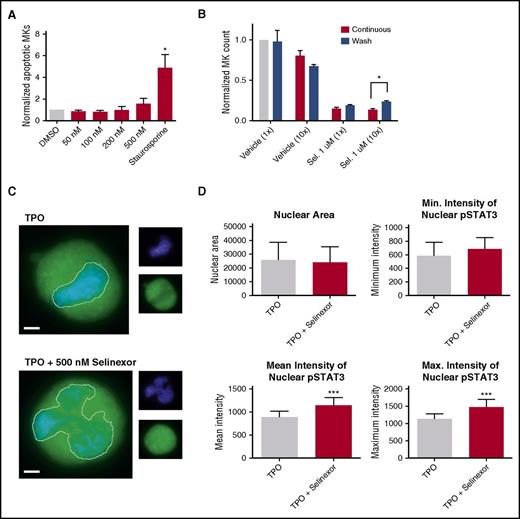
Our in vitro and in vivo data indicated that selinexor diminishes the number of MKs that developed from precursor HSCs. This may be because of a variety of reasons. One possibility is that selinexor kills precursor cells before they become MKs. We tested this by treating murine progenitor cells on D1 with selinexor at indicated doses and then measured annexin V binding on the entire cell population on D4. Unlike cells treated with staurosporine that had a more than fourfold increase in apoptosis, there was no significant increase in apoptosis in selinexor-treated cells, suggesting that selinexor does not have a cytotoxic effect on either MKs (Figure 2A) or HSCs (Figure 6A).
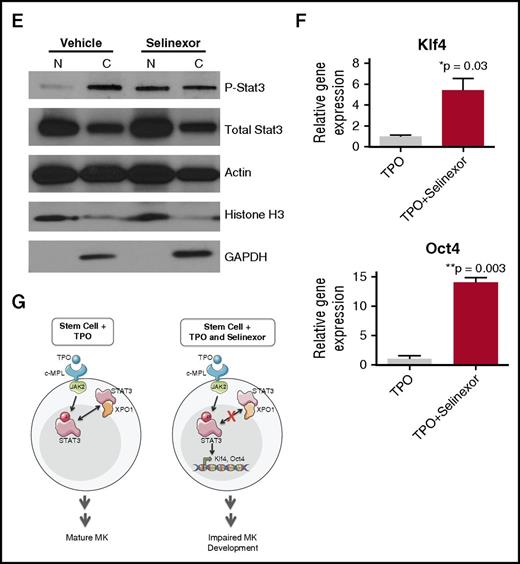
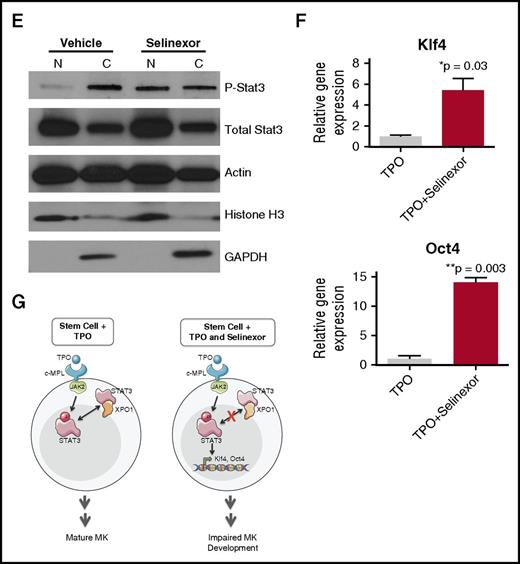
Selinexor treatment inhibits TPO signaling in vitro. D1 cells derived from murine fetal livers were incubated with selinexor at indicated doses. (A) Apoptosis was measured by annexin V positivity in all cells by FACS on D4; n = 4. (B) TPO was added at 1× (70 ng/mL) or 10× on D1. In addition, selinexor was added at indicated doses and was either washed out after 6 hours or kept in culture continuously. MK number on D4 was quantified by FACS. Values were normalized to 1× TPO control for each biological replicate, and then replicates averaged; n = 3. (C) Immunofluorescence of pSTAT3 was visualized in MKs treated with 500 nM selinexor or vehicle control. pSTAT3 is shown in green, and nuclear staining (Hoechst) is shown in blue. Bars represent 10 μm. To quantify nuclear fluorescence, the nuclear area was determined by thresholding in ImageJ (white outline), and the nuclear area and average, minimum, and maximum fluorescent intensities of pSTAT3 staining in the nucleus (as gated by Hoechst) were quantified in ImageJ (D). n = 12 cells per group; 3 biological replicates; ***P < .001. (E) MKs were serum starved in TPO-free media and treated with 500 nM selinexor or vehicle control for 6 hours. TPO was then added for 15 minutes to probe TPO signaling, and then MKs were separated into nuclear (N) and cytoplasmic (C) fractions. Fractions were probed for STAT3 and pSTAT3. The loading controls were as follows: actin (total protein), histone H3 (nuclear protein), and GAPDH (cytoplasmic protein). (F) Positive selection of CD41+ cells was performed on D1 of maturation to isolate a population of predominantly MK progenitors. After selection, the cells were treated with TPO or TPO and selinexor. On D4, quantitative polymerase chain reaction was performed as described to measure the levels of Klf4 and Oct4. (G) Schematic of proposed mechanism.
Selinexor treatment inhibits TPO signaling in vitro. D1 cells derived from murine fetal livers were incubated with selinexor at indicated doses. (A) Apoptosis was measured by annexin V positivity in all cells by FACS on D4; n = 4. (B) TPO was added at 1× (70 ng/mL) or 10× on D1. In addition, selinexor was added at indicated doses and was either washed out after 6 hours or kept in culture continuously. MK number on D4 was quantified by FACS. Values were normalized to 1× TPO control for each biological replicate, and then replicates averaged; n = 3. (C) Immunofluorescence of pSTAT3 was visualized in MKs treated with 500 nM selinexor or vehicle control. pSTAT3 is shown in green, and nuclear staining (Hoechst) is shown in blue. Bars represent 10 μm. To quantify nuclear fluorescence, the nuclear area was determined by thresholding in ImageJ (white outline), and the nuclear area and average, minimum, and maximum fluorescent intensities of pSTAT3 staining in the nucleus (as gated by Hoechst) were quantified in ImageJ (D). n = 12 cells per group; 3 biological replicates; ***P < .001. (E) MKs were serum starved in TPO-free media and treated with 500 nM selinexor or vehicle control for 6 hours. TPO was then added for 15 minutes to probe TPO signaling, and then MKs were separated into nuclear (N) and cytoplasmic (C) fractions. Fractions were probed for STAT3 and pSTAT3. The loading controls were as follows: actin (total protein), histone H3 (nuclear protein), and GAPDH (cytoplasmic protein). (F) Positive selection of CD41+ cells was performed on D1 of maturation to isolate a population of predominantly MK progenitors. After selection, the cells were treated with TPO or TPO and selinexor. On D4, quantitative polymerase chain reaction was performed as described to measure the levels of Klf4 and Oct4. (G) Schematic of proposed mechanism.
TPO is the major determinant of MK differentiation and maturation from HSCs.15 Therefore, we examined whether we could rescue selinexor’s inhibitory effects by increasing the concentration of TPO in culture, thereby enhancing TPO signaling in the HSCs. MK progenitors were treated on D1 with vehicle or 1 μM selinexor and TPO was added at 1 or 10 times the standard dose (70 ng/mL or 700 ng/mL, respectively). Selinexor was either washed out after 6 hours (to mimic the in vivo half-life of 1 dosage) or remained in culture until D4. When MKs were treated continuously with selinexor, 10× TPO did not significantly change the number of MKs that matured (Figure 6B). As such, even 10× elevated TPO could not rescue the selinexor-induced block in MK maturation. However, high TPO (700 ng/mL) was able to significantly enhance MK maturation in cells only when selinexor was removed from the culture (Figure 6B). These data indicate that TPO administered simultaneously in the presence of selinexor could not rescue MK progenitor cells; TPO was only able to enhance MK maturation when selinexor was removed from culture. This suggests that the mechanism by which selinexor impacts progenitor development is through inhibition of TPO signaling. In addition, the ability of high TPO to enhance MK maturation after selinexor is washed out is consistent with the model that once selinexor is removed, some progenitor cells maintain the ability to differentiate into MKs given an appropriate stimulus.
TPO signaling pathway is activated once the cytokine binds the c-Mpl receptor. Then, c-Mpl activates multiple pathways including the signal transducer and activator of transcription STAT3. STAT3 plays an important role in the early stages of megakaryopoiesis16 and has several nuclear export signal elements that bind to XPO1 for its nuclear export.17 In addition, XPO1 inhibition by SINE compounds represses STAT3 transactivation.18 Therefore, we hypothesized that selinexor may disrupt TPO signaling through dysregulation of STAT3. To study the TPO signaling pathway in primary MKs in the absence and presence of selinexor, D4 fetal liver–derived MKs were first TPO starved for 6 hours. Cells were then treated with either 70 ng/mL of TPO alone or 70 ng/mL TPO and 500 nM selinexor for 15 minutes. We examined both total STAT3 and pSTAT3 localization and expression in MKs by immunofluorescence (Figure 6C-D) and western blot (Figure 6E). Treatment of MKs with selinexor resulted in enhanced nuclear localization of pSTAT3, evident by the increased nuclear fluorescent intensity of pSTAT3 in treated MKs (Figure 6C-D). Representative images are shown in Figure 6C, and nuclear area and quantifications of pSTAT3 fluorescent intensity in the nucleus are shown in Figure 6D. Although there were no differences in nuclear size or minimum fluorescent intensity, there were significant increases in pSTAT3 mean and maximum fluorescent intensities after selinexor treatment. In addition, we also probed total STAT and pSTAT3 in the nuclear and cytoplasmic fractions of the MK lysates. Figure 6E reveals that although the amount of total STAT3 is unchanged in selinexor-treated cells, pSTAT3 localization is significantly altered; nuclear pSTAT3 is increased after TPO activation during selinexor treatment. These data suggest that the mechanism by which selinexor is preventing HSC development into MKs may be a result of the forced nuclear localization of pSTAT3.
Continuous STAT3 phosphorylation has been shown to maintain stem cells in an undifferentiated state through modulation of expression of downstream targets, including Klf4 and Oct3/4.19-25 Therefore, we hypothesized that selinexor treatment may block MK development by activation of Klf4 and Oct4 downstream of pSTAT3. To test this, we first performed positive selection of CD41+ cells on D1 of maturation to isolate a population of predominantly MK progenitors. After selection, the cells were treated with TPO or both TPO and selinexor. On D4, we performed quantitative polymerase chain reaction to measure the levels of Klf4 and Oct4 expression in each condition (Figure 6F). Notably, the combination of TPO and selinexor induced significant upregulation of Klf4 and Oct4 (Figure 6F). These results suggest that TPO pathway activation in the presence of selinexor induces significant expression of the pSTAT3 downstream target Klf4, leading to subsequent Oct4 induction. Enhanced Klf4 and Oct4 may then work to maintain HSCs in their “stemlike” state, thereby blocking MK differentiation and maturation (schematic shown in Figure 6G).
Selinexor blocks TPO signaling in TPO knockout mice
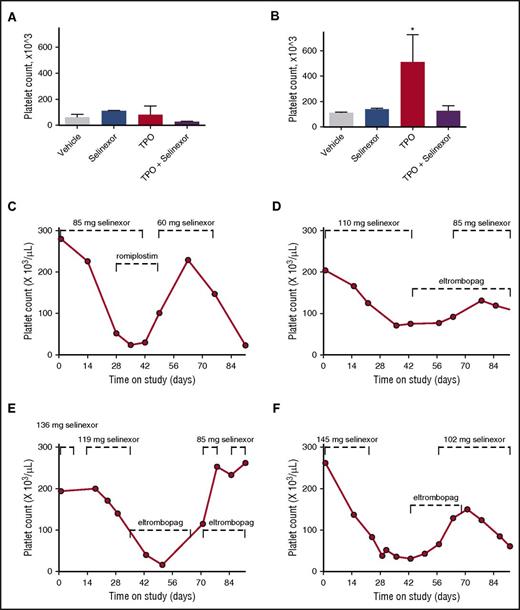
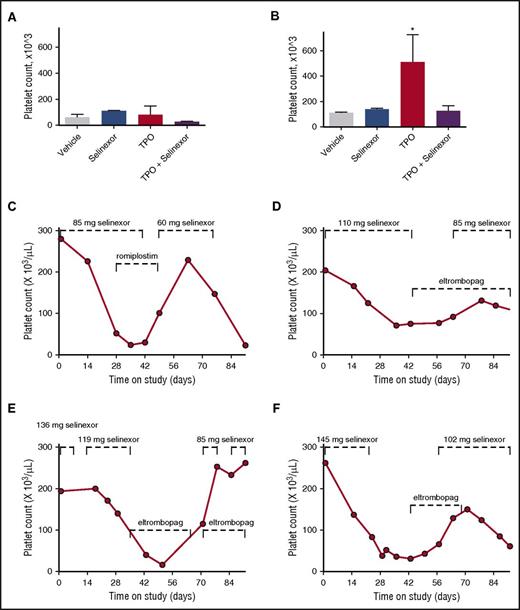
To definitively determine whether selinexor was blocking TPO signaling, we used an in vivo model with TPO knockout mice.26 The TPO knockout mice have a >80% decrease in their platelets and MKs but have normal levels of all the other hematopoietic cell types. The TPO knockout mice were treated with vehicle control, selinexor (15 mg/kg every other day, for 3 doses per week), recombinant murine TPO (300 ng/g), or selinexor and TPO together. Because these mice have no endogenous TPO, TPO signaling was solely restricted to mice given exogenous TPO. Interestingly, selinexor treatment did not further reduce the platelet counts of these mice (Figure 7A). TPO administration alone raised platelet counts into the normal range (510.0 ± 124.5, n = 3; Figure 7B). However, when selinexor was administered in conjunction with TPO, no increase in platelet count was observed. These data suggest that selinexor actively inhibited TPO signaling in vivo (Figure 7B). In addition, selinexor alone did not reduce platelet count, revealing that its inhibitory effect is mediated exclusively through TPO signaling. These results are consistent with in vitro data (Figure 6B), showing that TPO is unable to overcome selinexor blockade when they are administered simultaneously.
Coordinated dosing of TPO agonists overcomes selinexor-induced thrombocytopenia in patients. (A-B) TPO knockout mice were treated with vehicle control, selinexor (15 mg/kg every other day, for 3 doses per week), TPO (300 ng/mL, single treatment), or selinexor and TPO, and platelet counts were measured on D0 (before treatment) (A) and D6 (B). *P < .05 compared with vehicle control; n = 3 mice per group. (C-F) Representative human patient data showing the recovery effects of dosing interruption ± TPO agonists romiplostim or eltombopag on patients with selinexor-induced grade 4 thrombocytopenia. Dashed lines mark periods of selinexor and/or TPO mimetic treatment.
Coordinated dosing of TPO agonists overcomes selinexor-induced thrombocytopenia in patients. (A-B) TPO knockout mice were treated with vehicle control, selinexor (15 mg/kg every other day, for 3 doses per week), TPO (300 ng/mL, single treatment), or selinexor and TPO, and platelet counts were measured on D0 (before treatment) (A) and D6 (B). *P < .05 compared with vehicle control; n = 3 mice per group. (C-F) Representative human patient data showing the recovery effects of dosing interruption ± TPO agonists romiplostim or eltombopag on patients with selinexor-induced grade 4 thrombocytopenia. Dashed lines mark periods of selinexor and/or TPO mimetic treatment.
Dose interruption with TPO mimetics treatment help alleviate thrombocytopenia in patients
Finally, we evaluated whether dose interruption and treatment with the TPO receptor (c-Mpl), small-molecule agonist eltrombopag or the fusion protein TPO analog romiplostim would be effective to help restore platelet counts in patients. We selected 14 patients from the phase 1 clinical trial (#NCT01607905) who were taking 8 or 10 selinexor doses per cycle, suffered grade 4 thrombocytopenia, underwent dosing interruptions of 8 to 21 days involving 3 to 6 missed doses, and had sufficient platelet count data to evaluate the effects of the dosing interruptions. Analysis of platelet number from each of these patients demonstrated general improvement. Specific examples of selinexor dose interruptions with TPO mimetic treatment in 4 patients are shown in Figure 7C-F. Reversibility was also seen in patients who did not receive TPO mimetics; selinexor interruptions of 8 to 16 days showed improvement, with a trend toward somewhat greater recovery after 19 to 21 days (not shown). These data suggest that selinexor-induced thrombocytopenia is reversible in humans upon dose interruption with or without the use of TPO mimetics by relieving the progenitor cell to MK differentiation block. Importantly, these data suggest that no additional medication needs to be given to treat the selinexor-induced thrombocytopenia in this already at-risk population.
Discussion
Selinexor is a potent, covalent, slowly reversible, orally available, selective inhibitor of XPO1 from the SINE group of small molecules. XPO1 is the sole nuclear exporter of several TSPs such as p53, FOXO proteins, pRb, IκB, and p27.5-7 In many cells, the nuclear membrane provides a physical barrier to the passive diffusion of macromolecules into and from the cytoplasm. Therefore, it is hypothesized that accumulation of TSPs in the nucleus by XPO1 inhibition reactivates cell cycle inhibitor check points and induces specific cancer death.5-7
The majority of patients treated with selinexor twice weekly in a phase 1 trial for at least 1 cycle (4 weeks) demonstrated dose dependent thrombocytopenia (Figure 1). As in the clinical studies, selinexor reduced platelets in mice by 40% to 50% within 2 to 3 weeks. In studies of MKs in cell culture, selinexor did not show cytotoxicity and did not affect platelet activation (Figure 2). However, both human and murine MK progenitor cell development was significantly blocked in a dose-dependent fashion, especially when selinexor was dosed in early stages of HSC maturation (Figure 3). Importantly, these effects were substantially reversible. MK inhibition was decreased when cells were treated later in the differentiation process, and treatment of mature MKs did not decrease proplatelet formation or release, suggesting selinexor affected the early commitment and differentiation of MKs from their HSC progenitors (Figure 3).
MK development from HSCs is predominantly mediated through the TPO receptor. We found that both in vitro and in vivo, selinexor inhibited TPO-mediated MK maturation. Further studies into the mechanism of this block in the TPO signaling pathway revealed abnormal accumulation of pSTAT3 in the MK nucleus. We hypothesize that the dysregulation of pSTAT3 localization plays a central role in the mechanism that blocks TPO-mediated MK maturation. Specifically, because of the inhibition of XPO1 nuclear export, activated pSTAT3 is trapped in the nucleus and its activity it therefore increased after selinexor treatment. Multiple studies have shown that persistent STAT3 activation can act to maintain stem cells in an undifferentiated state.19-22 In fact, van Oosten et al found that activation of JAK/STAT3 alone is sufficient for enabling the induction of a naïve pluripotent state in somatic cells.22 Specifically, they found that increased pSTAT3 signaling resulted in modulation of expression of downstream targets, including Klf4, indicating that Klf4 is immediately downstream of Stat3 and that Stat3 is sufficient for Klf4 induction.22,27 Klf4, along with Oct3/4, Sox2, and c-Myc are the original 4 factors shown to reprogram somatic cells to a pluripotent state.28,29 Notably, it was found that expression of Klf4 is sufficient to maintain pluripotency while maintaining the expression of Oct3/4.23-25 Specifically, Niwa et al showed that the Jak/Stat3 pathway activates Klf4, which induces expression of Oct3/4 through Sox2 and Nanog.23 Together, these data suggest that TPO pathway activation in the presence of selinexor induces significant expression of the pSTAT3 downstream target Klf4, leading to subsequent Oct4 induction. We propose that this is attributable to constitutively active pSTAT3 because of its nuclear localization. Enhanced Klf4 and Oct4 may then work to maintain HSCs in their “stemlike” state, thereby blocking MK differentiation and maturation (schematic shown in Figure 6G).
Interestingly, some MKs were still able to develop in the presence of selinexor both in vitro (Figure 3) and in vivo (Figure 5). This may be because of the specificity of selinexor’s effects on cells earlier in maturation; fetal liver cultures treated on D1 produced very few MKs, and cultures treated on D3 were largely unaffected (Figure 3). This is consistent with previous in vivo data showing that STAT3 is not necessary for the maturation of MKs or platelet production, but rather affects development of MK progenitor cells in the early stage of megakaryopoiesis.16 Hence, in both our fetal liver cultures and in vivo models there are HSCs and MKs at all stages of maturation. Therefore, the MKs that developed in the presence of selinexor may have already reached the point in their maturation in which STAT3 is dispensable, and, as such, selinexor was largely impotent. In fact, these “resistant” MKs had normal ploidy and morphology (Figure 4), further suggesting that they were unaltered by drug treatment.
Although TPO is the main driver of MK differentiation, mice lacking either TPO or its receptor c-Mpl successfully produce both MKs and platelets, indicating a role for other regulators.30,31 Therefore, it is also possible that the MKs which developed in the presence of selinexor matured through a TPO-independent pathway. This is consistent with patient data; in the patients treated with selinexor in a phase 1 study, the majority of patients experienced induced platelet loss, with an average decrease of ∼50% after 3 weeks and no subsequent decrease for at least 4 months of uninterrupted selinexor treatment (Figure 1). The lack of complete platelet loss implies incomplete suppression of MK precursor stem cell maturation at even the highest selinexor doses, ultimately leading to a partially decreased steady state of maturation. Together, the lowered but steady-state levels of platelet production seen in both humans and mice treated with selinexor suggest the existence of a TPO-independent pathway that is active even when TPO-mediated MK differentiation is blocked. Indeed, this would explain the existence of platelets in both TPO and c-Mpl knockout mice. In humans, loss of c-Mpl functionality results in congenital amegakaryocytic thrombocytopenia, a rare inherited autosomal recessive disorder that presents with thrombocytopenia and absence of MKs. The majority of congenital amegakaryocytic thrombocytopenia patients have a mutation in the gene for c-Mpl, resulting in high levels of serum TPO.32-34 In patients with a complete loss of functional c-Mpl, the median platelet count is usually 21 × 109/L or below,34 suggesting that these patients without functional TPO signaling are also able to make a small amount of platelets. Although a TPO-independent pathway of platelet production is yet to be identified, its presence is supported by these previous studies and our animal and patient data.
There are several limitations of this study. First, we were unable to address in vitro proplatelet and platelet production in human MKs because human MKs do not effectively produce platelets in vitro. However, we confirmed that selinexor did significantly reduce the number of human CD34+-derived MKs. Therefore, it is likely that the decrease in platelet number is because of decreased MK development. Second, we did not exhaustively probe the nuclear localization of all XPO1 targets after selinexor treatment. Instead, we chose to focus on STATs because they have been shown to be important in stem cell and MK development. Therefore, impaired nuclear localization of other MK transcription factors cannot be ruled out as a contributor to the decreased MK development. Third, although we showed nuclear pSTAT3 sequestration and TPO signaling inhibition during selinexor treatment, we were unable to directly confirm the connection by reversing the sequestration and showing recue. This was not experimentally feasible. Fourth, the dosage of selinexor in patients was variable; this was because of dose escalation regimen aimed to find the recommended phase 2 dose throughout this clinical trial. However, despite the differences in dosage, all patients showed a significant recovery in platelet count during the drug holiday. Fifth, because of the restrictions and ethical guidelines of the clinical trial, we could not withhold TPO mimetics from patients to test the efficacy of treating thrombocytopenia with drug holiday alone.
The results of the present study establish that dosing interruptions alone or in combination with TPO administration may be effective at reversing the selinexor-induced platelet loss. Although TPO agonists were effective at reversing selinexor-induced thrombocytopenia, the effect was equivalent to dosing interruption, and the combination of the treatments with dosing interruptions did not provide additional benefit. Therefore, dosing interruptions alone are likely sufficient for treating selinexor-induced thrombocytopenia. This finding is noteworthy because it suggests that no additional medications need to be given to treat the selinexor-induced thrombocytopenia in this already fragile population of patients receiving treatment of cancer.
The recommended phase 2 dosing regimen of selinexor is 60 mg fixed dose given twice weekly (D1 and D3).8 This is further supported by our findings showing lower thrombocytopenia in patients treated by lower drug levels of 50 to 70 mg vs higher doses (Figure 1). In addition, based on the in vitro studies, it is suggested that thrombocytopenia could be alleviated with 7 to 10 days of dose interruptions. Treatment with a TPO agonist may be used if platelet counts are very low at the discretion of the treating physician.
Defining the pathways by which therapeutics such as selinexor affect MK differentiation may yield strategies to manage drug-induced thrombocytopenias in various sets of patients. Indeed, by uncovering the specific pathways that are being affected by drugs, we can more efficiently and humanely design ways to reverse thrombocytopenia. Specifically, we expect that this improved selinexor dosing regimen will help to reduce thrombocytopenia in selinexor patients, allowing them to continue their course of chemotherapy to achieve response and longer survival.
The online version of this article contains a data supplement.
The publication costs of this article were defrayed in part by page charge payment. Therefore, and solely to indicate this fact, this article is hereby marked “advertisement” in accordance with 18 USC section 1734.
Acknowledgments
The authors would like to thank all the patients and principle investigators on the phase 1 study, “Safety Study of KPT-330 in Patients with Advanced or Metastatic Solid Tumor Cancer” (#NCT01607905): Albiruni R. Abdul Razak and Lee-Anne Stayner, Princess Margaret Cancer Centre, Toronto, Ontario, Canada; Morten Mau-Soerensen and Ulrik Lassen, Rigshospitalet, Copenhagen, Denmark; Nashat Y. Gabrail, Gabrail Cancer Institute, Canton, Ohio; John F. Gerecitano, Memorial Sloan Kettering Cancer Center, Weill Cornell Medical College, New York, New York; Anthony F. Shields, Karmanos Cancer Institute, Wayne State University, Detroit, Michigan; and Richard Kim and Amit Mahipal, H. Lee Moffitt Cancer Center and Research Institute, Tampa, Florida. In addition, the authors would like to thank Victoria Petkova for her excellent technical assistance and Elisabeth Battinelli and Kelly Johnson for their insightful conversations and feedback.
This work was supported in part by grants from the National Heart, Lung, and Blood Institute (R01Hl68130 [J.E.I.], 5F32HL118865 [K.R.M.], and R01HL69990 [M.S.-V.]) and the National Institute of Diabetes and Digestive and Kidney Diseases (K01DK111515 [K.R.M.]), National Institutes of Health; and by the American Heart Association (16SDG29090007 [K.R.M.]). J.E.I. and K.R.M. are American Society of Hematology Scholars.
Authorship
Contribution: K.R.M. designed and carried out experiments, analyzed data, and wrote the manuscript; S.K.W., P.V., Z.-J.L., and T.S.S. designed and performed experiments and analyzed data; and T.J.U., T.K., E.S., B.K., M.C., M.S.-V., J.E.I., and Y.L. contributed to the manuscript, supervised all research, contributed to the design of experiments, analyzed data, and wrote the manuscript.
Conflict-of-interest disclosure: E.S., T.J.U., T.K., B.K., M.C., and Y.L. are Karyopharm Therapeutics employees. J.E.I. has financial interest in and is a founder of Platelet BioGenesis, a company that aims to produce donor-independent human platelets from human-induced pluripotent stem cells at scale. J.E.I. is an inventor on this patent. The interests of J.E.I. were reviewed and are managed by the Brigham and Women’s Hospital and Partners HealthCare in accordance with their conflict-of-interest policies. The remaining authors declare no competing financial interests.
Correspondence: Joseph E. Italiano Jr, Brigham and Women's Hospital, 4 Blackfan Cir, Harvard Institutes of Medicine Room 731, Boston, MA 02115; e-mail: jitaliano@partners.org.
References
Author notes
J.E.I. and Y.L. contributed equally to this study.

