Key Points
G-CSF mobilizes dormant HSCs without proliferation.
Transplantation defects of mobilized peripheral blood-derived hematopoietic stem and progenitor cells are divisional history independent.
Abstract
Granulocyte colony-stimulating factor (G-CSF) is used clinically to treat leukopenia and to enforce hematopoietic stem cell (HSC) mobilization to the peripheral blood (PB). However, G-CSF is also produced in response to infection, and excessive exposure reduces HSC repopulation capacity. Previous work has shown that dormant HSCs contain all the long-term repopulation potential in the bone marrow (BM), and that as HSCs accumulate a divisional history, they progressively lose regenerative potential. As G-CSF treatment also induces HSC proliferation, we sought to examine whether G-CSF-mediated repopulation defects are a result of increased proliferative history. To do so, we used an established H2BGFP label retaining system to track HSC divisions in response to G-CSF. Our results show that dormant HSCs are preferentially mobilized to the PB on G-CSF treatment. We find that this mobilization does not result in H2BGFP label dilution of dormant HSCs, suggesting that G-CSF does not stimulate dormant HSC proliferation. Instead, we find that proliferation within the HSC compartment is restricted to CD41-expressing cells that function with short-term, and primarily myeloid, regenerative potential. Finally, we show CD41 expression is up-regulated within the BM HSC compartment in response to G-CSF treatment. This emergent CD41Hi HSC fraction demonstrates no observable engraftment potential, but directly matures into megakaryocytes when placed in culture. Together, our results demonstrate that dormant HSCs mobilize in response to G-CSF treatment without dividing, and that G-CSF-mediated proliferation is restricted to cells with limited regenerative potential found within the HSC compartment.
Introduction
Granulocyte colony-stimulating factor (G-CSF)-mobilized peripheral blood (PB) hematopoietic stem and progenitor cells (HSPCs) have become the preferred clinical source for hematopoietic stem cell (HSC) transplantation therapies.1 Several clinical studies comparing the efficacy of PB- and bone marrow (BM)-derived cells demonstrate that, with the exception of increased risk for graft-versus-host disease, PB grafts perform just as well as BM-derived cells with regard to long-term survivability.1-3 This is attributable to a larger HSPC yield from mobilized PB, which has been demonstrated to be a predictor of graft performance in transplantation therapies.4-7 However, mouse studies have shown that on a cell-for-cell basis, mobilized PB functions with reduced regenerative potential when compared with unperturbed BM.8 This suggests either that G-CSF-mobilized HSPCs are not the “true” stem cells or that mobilization induces HSPC transplantation defects.
G-CSF regulates granulocyte production and is produced by a diversity of cells in response to inflammation and infection.9 G-CSF drives the production of granulocytes from primitive HSPCs, resulting in higher granulocyte numbers available to fight infection. Indeed, the addition of G-CSF to colony assays in culture stimulates granulocyte production.10 Primitive HSPCs, however, exist in a quiescent state. To drive mature cell production, these cells must activate, divide, and initiate differentiation cascades that lead to mature cell production. To that effect, several studies have reported that G-CSF treatment induces the HSC compartment to proliferate before their mobilization from the BM.11-13
Work on HSC divisional history revealed a rare fraction of dormant HSCs that exist in a deeply quiescent state and contains all of the long-term (LT) HSC potential in the BM.14-16 In addition, as HSCs progressively proliferate over time, they lose regenerative potential, indicating an inverse relationship between HSC function and divisional history.14 As HSPCs proliferate in response to G-CSF, we hypothesized that reduced repopulation potential of G-CSF-mobilized PB may be a consequence of increased divisional history. Contrary to our hypothesis, we demonstrate that G-CSF treatment preferentially mobilized dormant HSC fractions without proliferation, and that repopulation defects associated with mobilized PB are divisional history independent. We find that proliferation of the HSC compartment in response to G-CSF is limited to cells with extensive proliferative history and limited differentiation potential associated with CD41 expression, and that cells with the highest CD41 expression are poised to mature directly into megakaryocytes.
Materials and methods
Mice
Tg(tetO-HIST1H2BJ/GFP)47Efu/J (TetO-H2BGFP), hCD34-tTA (CD34) mice were acquired, backcrossed to C57BL/6 more than 15 generations, and maintained as previously described.14 Double transgenic CD34/H2BGFP (34/H2B) mice were derived from crossbreeding the single transgenic CD34 and TetO-H2BGFP mice, and F1 mice from this cross were used for all experiments examining or using H2BGFP label dilution. Doxycycline (dox) was administered through the drinking water at 1 mg/mL to mice beginning between 8 and 16 weeks of age, and was changed twice weekly. C57BL/6-Tg(UBC-GFP)30Scha/J (UBC-GFP) mice were obtained from the Jackson Laboratory and were used as donors for cells in reconstitution and in vitro colony-forming assays. B6.SJL-PtprcaPepcb/BoyJ (SJL) mice were used as recipients for transplantation assays. C57BL/6 (B6) mice were used for Ki67 and 4′,6-diamidino-2-phenylindole (DAPI) cell cycle analysis. Animal experiments were approved by the Institutional Animal Care and Use Committee and conducted in accordance with the Animal Welfare Act.
G-CSF treatment, sample preparation, and flow cytometry
Recombinant human G-CSF (Amgen, Thousand Oaks, CA) was diluted in a solution of phosphate-buffered saline supplemented with 1% bovine serum albumin and 1% penicillin/streptomycin and was injected subcutaneously twice daily at 6.25 μg/day for 4 consecutive days. Control mice were either untreated or injected with an equal volume of solution without G-CSF. BM cells were harvested from tibias, femurs, and pelvic bones by crushing with a mortar and pestle in PBS supplemented with 5% newborn calf serum (GIBCO). Cells were triturated to obtain a single-cell suspension, and bone debris was removed by filtering through a 70-μm cell strainer (BD). Spleens were homogenized by forcing through a 70-μm cell strainer (BD) with the plunger of a 5-mL syringe, and PB was collected via cardiac puncture. Red cells from samples were lysed with an ammonium chloride lysis buffer before staining. For staining, cells were first incubated with biotin-conjugated lineage markers anti-CD3ε, anti-B220, anti-Gr-1, anti-CD11b, and anti-Ter119, and on some occasions with biotin-conjugated anti-CD48, followed by anti-biotin superparamagnetic beads (Dynabeads, Biotin Binder, Life Technologies), and lineage marker-expressing cells were depleted via magnetic separation. The fraction enriched for Lineage−/low cells was further incubated with antibodies against CD150, CD48, c-Kit, Sca1, CD41, Flk2, IL-7Rα, CD34, FcγRIII, and fluorophore-conjugated streptavidin. Dead cells were excluded by staining with DAPI (Sigma), or propidium iodide (Sigma). Cells were analyzed on an LSRII (Becton Dickenson) flow cytometer and sorted on an Influx (Becton Dickenson).
Transplantation assays
The BM/PB chimeric transplants were performed by sorting LSKCD48− cells from the BM of 34/H2B mice (CD45.2, GFP−) treated with dox for 3 months into populations based on H2BGFP label retention. These cells were mixed together in ratios that mimic the ratios of label retention found in mobilized PB (Figure 3). Subsequently, age-matched UBC-GFP mice (CD45.2, GFP+) were treated with G-CSF for 4 days, and LSKCD48− cells were sorted from mobilized PB harvested 3 hours after the final injection. After sorting, PB-derived LSKCD48− cells were mixed at a 1:1 ratio with the BM-derived LSKCD48− cell mixture, and 100 cells from this mixture were injected retro-orbitally into lethally irradiated SJL (CD45.1) mice (2 rounds of 550 rads, 3 hours apart), together with 2 × 10⁵ cells of competitor BM (CD45.1) per mouse. Mice were bled at timed intervals posttransplantation from the retro-orbital venus plexus, red blood cells were lysed, and the contribution of donor-derived CD45.2+ cells were assessed for contribution to the B-cell (B220+), T-cell (CD4/CD8+), and myeloid (CD11b/Gr1+) lineages. Granulocytes were identified as SSCHiCD11b/Gr1+ cells. Secondary transplantations were performed 16 weeks after primary transplant. BM from each mouse was harvested and pooled, and 5 × 10⁶ nucleated cells were transplanted into secondary hosts. The BM of primary and secondary mice was analyzed for the presence of CD45.2+GFP+/− cells in the various HSPC compartments at the time of sacrifice, as described earlier. Primary and secondary recipients of PB/BM grafts were maintained on dox water for the duration of transplantation to prevent H2BGFP re-expression by the BM-derived HSPC compartment. This enabled discernment between BM- and PB-derived HSPCs in host BM at the end of primary and secondary transplants.
CD41−/+/Hi HSC transplantations were performed by transplanting 20 or 100 LSKCD48−CD150+ cells sorted based on CD41 expression from UBC-GFP mice treated for 4 days with G-CSF, together with 2 × 10⁵ cells of unmanipulated competitor BM (CD45.1), into lethally irradiated SJL mice. Mice were bled at timed intervals posttransplantation, and analyzed for donor-derived (CD45.2+ and/or GFP+) contribution to white blood cells, as earlier, as well as red blood cells (Ter119+) and platelets (CD41+).
Cell cycle analysis
Cells were stained and prepared as earlier, and then fixed for 20 minutes in 2% methanol-free paraformaldehyde diluted in PBS. Cells were then washed 3 times with PBS containing 5% newborn calf serum, permeabilized in 0.2% Triton-X 100, and then stained with anti-Ki-67 (eBioscience) and DAPI before analysis.
HSPC definitions
The various stem and progenitor populations were defined as follows: HSCs (Lin−/Sca-1+/c-Kit+/CD48−/CD150+), MPPs (Lin−/Sca-1+/c-Kit+/CD48−/CD150–), HPC-1 (Lin−/Sca-1+/c-Kit+/CD48+/CD150−), HPC-2 (Lin−/Sca-1+/c-Kit+/CD48+/CD150+), MkPs (Lin−/Sca-1−/c-Kit+/CD150+/CD41+), CMPs (Lin−/Sca-1−/c-Kit+/CD34+/FcγRIII−), GMPs (Lin−/Sca-1−/c-Kit+/CD34+/FcγRIII+), MEPs (Lin−/Sca-1−/c-Kit+/CD34−/FcγRIII−), common lymphoid progenitors (CLPs) (Lin−/Sca-1mid/c-Kitmid/Flk2+/IL-7Rα+). Label retention was defined by gating above the background GFP levels found in heterozygous single transgenic TetO-H2BGFP HSCs.
In vitro analysis of megakaryocyte potential
Single LSKCD48−CD150+ cells were sorted, according to CD41 expression, into U-shaped 96-well plates in 100 μL StemSpan SFEM (StemCell Technologies), supplemented with 10% fetal bovine serum (HyClone), 1% β-mercaptoethanol (0.1 mM; Sigma-Aldrich), 1% penicillin/streptomycin (Gibco), and cytokines mIL-3 (20 ng/mL; R&D Systems), mIL-6 (20 ng/mL; R&D Systems), mSCF (50 ng/mL; R&D Systems), hTpo (50 ng/mL; R&D Systems), and Epo (2 U/mL; Amgen). After 14 days of culture, colonies were collected for cytospin preparation and hematoxylin and eosin staining to determine the presence of megakaryocytes and other myeloid cells.
Microscopy
Cytospin slides were imaged using a Leica DM6000 slide microscope. Single cells sorted into a 96-well plate were imaged on a Leica DMI6000 daily for 14 days of culture. Cell numbers were measured by counting the number of GFP+ cells up to 100 cells. Cell size data were collected using the Leica LAS AF software by measuring the distance across the shortest diameter of the cell. For live cell staining, CD41-APC (1:100 dilution) and Hoechst dye (1 μg/mL) were added directly to the well, and cells were allowed to incubate at 37°C for 20 minutes before imaging.
Results
G-CSF does not induce dormant HSC proliferation
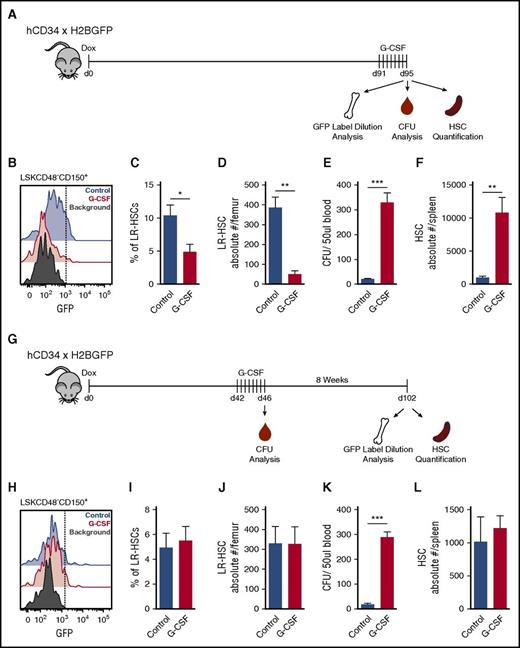
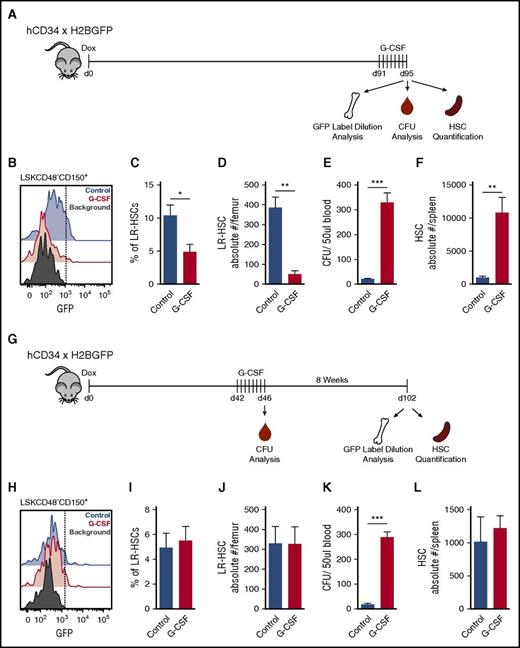
Dormant LR-HSCs contain all the LT-HSC potential in the BM.14-17 Thus, we set out to demonstrate the proliferative effects of G-CSF on LR-HSCs. We placed 34/H2B mice on dox for 12 to 16 weeks to turn off H2BGFP expression and elucidate the LR-HSC population. Mice were then treated with G-CSF for 4 days before analyzing the BM for GFP label dilution (Figure 1A). As expected, G-CSF treatment resulted in the reduction of GFPHi HSCs (Lin−Sca-1+cKit+CD48−CD150+) from the BM (Figure 1B-D). To verify that G-CSF treatment successfully mobilized HSCs to the periphery, we analyzed colony-forming (CFU-C) potential of PB and quantified HSC numbers in the spleen. G-CSF treatment successfully mobilized HSCs, as indicated by the increased CFU-C potential of PB (Figure 1E) and the increased number of phenotypic HSCs in the spleen (Figure 1F). However, as G-CSF treatment resulted in increased HSC numbers in the periphery, we were unable to conclude whether the reduction in LR-HSCs after G-CSF treatment resulted from the dilution of GFP because of proliferation or mobilization of LR-HSCs.
G-CSF does not induce proliferation of dormant HSCs. (A) Experimental schematic. Mice were placed on dox for 12 to 16 weeks to turn off expression of H2BGFP. Four days before analysis, mice were serially treated with G-CSF, and then BM, PB, and spleen were harvested to assay GFP label dilution, CFU, and HSC (LSKCD48−CD150+) quantification. (B) Histogram of HSC GFP label dilution. (C) Quantification of LR-HSC in panel B. (D) Absolute number of LR-HSCs in the BM. (E) CFU analysis from PB. (F) HSC quantification in the spleen. (G) Updated experimental schematic. Mice were placed on dox for 7 weeks, treated with G-CSF, and then chased for an additional 8 weeks to allow homeostasis to reestablish and all HSCs to return to the bone marrow before analysis. (H) Histogram of HSC GFP label dilution. (I) Quantification of LR-HSC in panel H. (J) Absolute number of LR-HSCs in the BM. (K) CFU analysis from PB immediately after the final G-CSF treatment. (L) HSC quantification in spleen. Data are represented as mean ± SEM of 6 and 7 mice for control and G-CSF treatments, respectively. *P < .05, **P < .01, ***P < .001 by Welch’s t test.
G-CSF does not induce proliferation of dormant HSCs. (A) Experimental schematic. Mice were placed on dox for 12 to 16 weeks to turn off expression of H2BGFP. Four days before analysis, mice were serially treated with G-CSF, and then BM, PB, and spleen were harvested to assay GFP label dilution, CFU, and HSC (LSKCD48−CD150+) quantification. (B) Histogram of HSC GFP label dilution. (C) Quantification of LR-HSC in panel B. (D) Absolute number of LR-HSCs in the BM. (E) CFU analysis from PB. (F) HSC quantification in the spleen. (G) Updated experimental schematic. Mice were placed on dox for 7 weeks, treated with G-CSF, and then chased for an additional 8 weeks to allow homeostasis to reestablish and all HSCs to return to the bone marrow before analysis. (H) Histogram of HSC GFP label dilution. (I) Quantification of LR-HSC in panel H. (J) Absolute number of LR-HSCs in the BM. (K) CFU analysis from PB immediately after the final G-CSF treatment. (L) HSC quantification in spleen. Data are represented as mean ± SEM of 6 and 7 mice for control and G-CSF treatments, respectively. *P < .05, **P < .01, ***P < .001 by Welch’s t test.
To clarify this, we altered our experimental protocol. We treated mice with G-CSF during the middle of the dox chase and then allowed 2 months for the BM microenvironment to return to homeostasis and HSCs to return to the BM before label dilution analysis (Figure 1G). Unexpectedly, 2 months after G-CSF treatment, we found no difference in LR-HSC frequency or number between G-CSF- and PBS-treated mice (Figure 1H-J). We verified the efficacy of G-CSF treatment by assessing CFU-C potential of PB after the final G-CSF injection and found that G-CSF successfully mobilized HSPCs, indicating our results are not due to ineffective treatment (Figure 1K). In addition, HSC numbers in the spleen had returned to normal levels, indicating that all HSCs had returned to the BM and that we were assessing the proliferative history of the total HSC population, and not just a nonmobilized subset (Figure 1L). Together, these results indicated that G-CSF treatment does not result in dormant HSC proliferation.
G-CSF preferentially mobilizes dormant HSCs to the peripheral blood
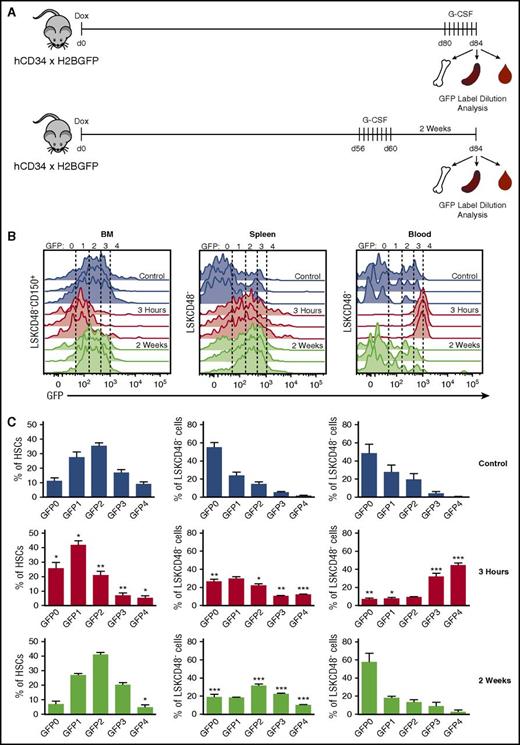
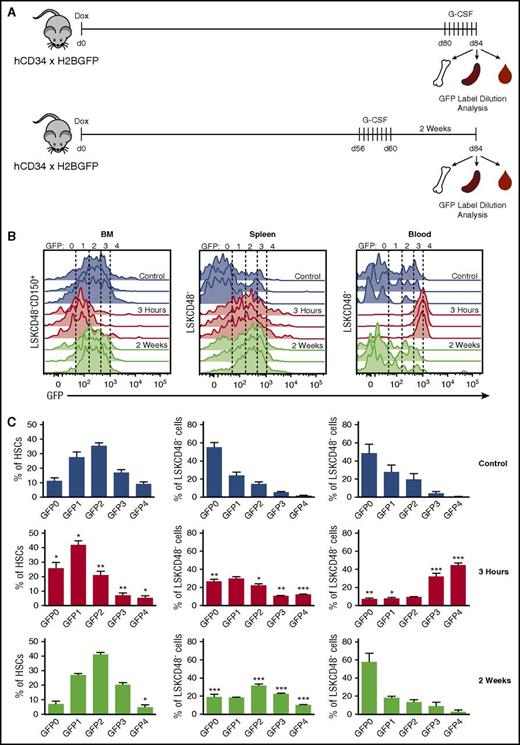
Analysis of GFP label dilution in the BM HSC compartment immediately after G-CSF treatment demonstrated a loss of LR-HSCs that was not a result of proliferation. To assess the kinetics of LR-HSC migration to different hematopoietic sites after G-CSF treatment, we analyzed the GFP profile of HSPCs in the BM, spleen, and PB before, during the peak of, and 2 weeks after G-CSF mobilization (Figure 2A). Consistent with our previous results, we found a reduction in LR-HSCs (GFP4) in the BM during the peak of mobilization, but also found that this reduction was sustained for at least 2 weeks after G-CSF treatment (Figure 2B-C). In conjunction with LR-HSC loss from the BM, we found an increased representation of LR-HSCs in the spleen after HSC mobilization that persisted for at least 2 weeks (Figure 2B-C). Strikingly, during the peak of mobilization the vast majority of HSPCs mobilized to the PB had a minimal divisional history, with 44.4% ± 5.7% and 32.0% ± 9.5% (mean ± SD) of PB LSKCD48− cells falling into the GFP4 and GFP3 gates, respectively (Figure 2B-C). These are the only cells with transplantable HSC potential within the LSKCD48− cell compartment.14 However, this divisional history distribution in the PB is transient and returns to normal levels within 2 weeks after G-CSF administration. Together, these data indicate that dormant HSCs are preferentially mobilized to the PB in response to G-CSF; they then filter into the spleen, where they reside for at least 2 weeks before returning to the BM.
G-CSF preferentially mobilizes dormant HSCs. (A) Experimental schematic. Mice were placed on dox for 12 weeks and were treated with G-CSF either 4 days or 2 weeks before analysis. BM, spleen, and PB HSPCs were analyzed for GFP label distribution. (B) Histograms of GFP distribution across HSC (BM) and HSPC (spleen and PB) compartments without, 3 hours after, and 2 weeks after G-CSF treatment. (C) Quantification of HSPCs found across GFP gates. Data are represented as mean ± SEM of 6, 7, and 4 mice for control, 3-hour, and 2-week treatments, respectively. Statistical significance was determined by comparing control with 3-hour and 2-week data. *P < .05, **P < .01, ***P < .001 by Welch’s t test.
G-CSF preferentially mobilizes dormant HSCs. (A) Experimental schematic. Mice were placed on dox for 12 weeks and were treated with G-CSF either 4 days or 2 weeks before analysis. BM, spleen, and PB HSPCs were analyzed for GFP label distribution. (B) Histograms of GFP distribution across HSC (BM) and HSPC (spleen and PB) compartments without, 3 hours after, and 2 weeks after G-CSF treatment. (C) Quantification of HSPCs found across GFP gates. Data are represented as mean ± SEM of 6, 7, and 4 mice for control, 3-hour, and 2-week treatments, respectively. Statistical significance was determined by comparing control with 3-hour and 2-week data. *P < .05, **P < .01, ***P < .001 by Welch’s t test.
Mobilized dormant HSCs exhibit competitive defects upon transplantation
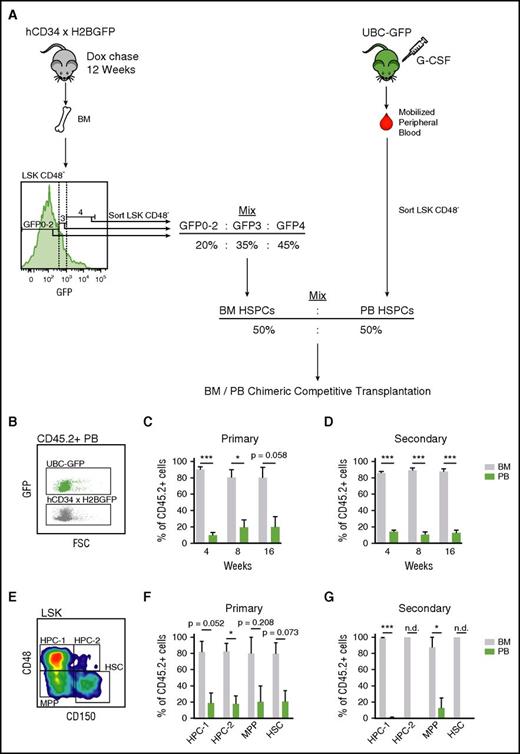
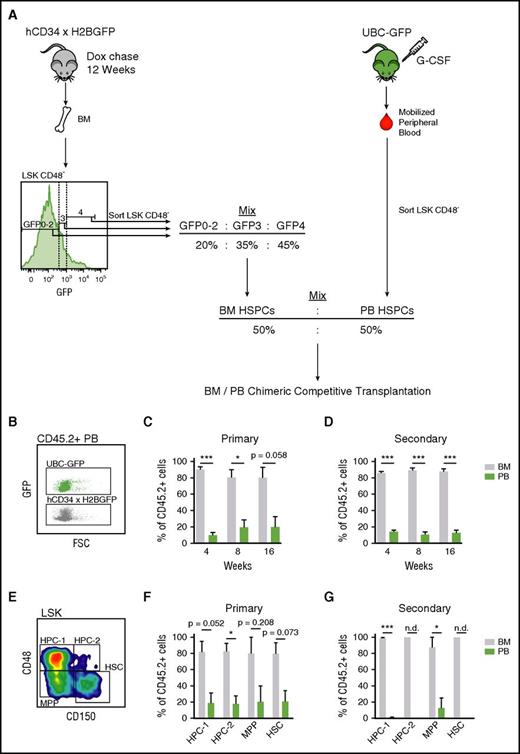
Although G-CSF is known to mobilize HSPCs, there is evidence showing that these HSPCs contain functional defects when compared with BM-derived HSPCs from untreated animals.8 Given that G-CSF primarily mobilized dormant HSPCs, we find it surprising that these cells are reported to exhibit functional defects. Thus, we tested the competitive repopulation potential of mobilized PB against steady-state BM in a manner that normalizes proliferative history. We set up chimeric transplantations with LSKCD48− cells from mobilized PB against LSKCD48− cells from BM. BM cells from 34/H2B mice were initially sorted into subpopulations, according to divisional history, and then subsequently mixed to mimic the ratios of proliferative history of LSKCD48− cells in mobilized PB (Figure 3A). By combining cells from mobilized PB and untreated BM in this manner, we eliminate proliferative history as a factor contributing to the regenerative capacity of these cells.
Mobilized LSKCD48− cells in PB (CD45.2+, GFP+) were mixed together with the divisional history normalized BM-derived LSKCD48− cells (CD45.2+, GFP−) at a 1:1 ratio, and 100 cells from this mixture were competitively transplanted along with helper BM cells (CD45.1+, GFP−) into CD45.1+ recipient mice (Figure 3A). After primary and secondary transplant, BM cells outcompeted PB cells at a ratio of 4:1 (Figure 3C-D). When assaying the regeneration of the BM HSPC compartment, BM cells out-competed PB cells at a ratio of 4:1 after primary transplant, and almost no PB-derived cells were found after secondary transplant except within the MPP compartment (Figure 3F-G). Together, these results demonstrate that defects associated with PB-derived HSPCs are not due to increased divisional history.
Mobilized HSPC transplantation defects are divisional history independent. (A) Schematic of BM/PB chimeric HSPC transplantations. LSKCD48− cells were sorted from the bone marrow of 34/H2B mice (CD45.2+) chased with dox for 12 weeks, based on label dilution. These cells were mixed together to mimic the label dilution ratios of LSKCD48− cells found in mobilized PB 3 hours after G-CSF treatment (Figure 2C). This BM HSPC mix was then further mixed at equal ratios with LSKCD48− cells sorted from mobilized PB of UBC-GFP mice (CD45.2+). This BM/PB HSPC mix was then competitively transplanted into CD45.1+ recipient mice. (B) Plot displaying GFP intensities of PB derived from UBC-GFP and 34/H2B mice. (C-D) PB- and BM-derived HSPC contribution to PB in primary (C) and secondary (D) transplantations. (E) Gating strategy for the BM HSPC compartment. (F-G) PB and BM derived contributions to the regeneration the BM HSPC compartments. In secondary transplant, regeneration in the HPC-2 and HSC compartments was exclusively confined to BM-derived cells, which prevented calculation of statistical significance between the BM- and PB-derived groups; not determined (n.d.). Data are represented as mean ± SEM of 8 and 9 mice for primary and secondary transplants, respectively. *P < .05, **P < .01, ***P < .001 by paired t test.
Mobilized HSPC transplantation defects are divisional history independent. (A) Schematic of BM/PB chimeric HSPC transplantations. LSKCD48− cells were sorted from the bone marrow of 34/H2B mice (CD45.2+) chased with dox for 12 weeks, based on label dilution. These cells were mixed together to mimic the label dilution ratios of LSKCD48− cells found in mobilized PB 3 hours after G-CSF treatment (Figure 2C). This BM HSPC mix was then further mixed at equal ratios with LSKCD48− cells sorted from mobilized PB of UBC-GFP mice (CD45.2+). This BM/PB HSPC mix was then competitively transplanted into CD45.1+ recipient mice. (B) Plot displaying GFP intensities of PB derived from UBC-GFP and 34/H2B mice. (C-D) PB- and BM-derived HSPC contribution to PB in primary (C) and secondary (D) transplantations. (E) Gating strategy for the BM HSPC compartment. (F-G) PB and BM derived contributions to the regeneration the BM HSPC compartments. In secondary transplant, regeneration in the HPC-2 and HSC compartments was exclusively confined to BM-derived cells, which prevented calculation of statistical significance between the BM- and PB-derived groups; not determined (n.d.). Data are represented as mean ± SEM of 8 and 9 mice for primary and secondary transplants, respectively. *P < .05, **P < .01, ***P < .001 by paired t test.
G-CSF induces the proliferation of restricted progenitors found within the HSC compartment, but not HSCs
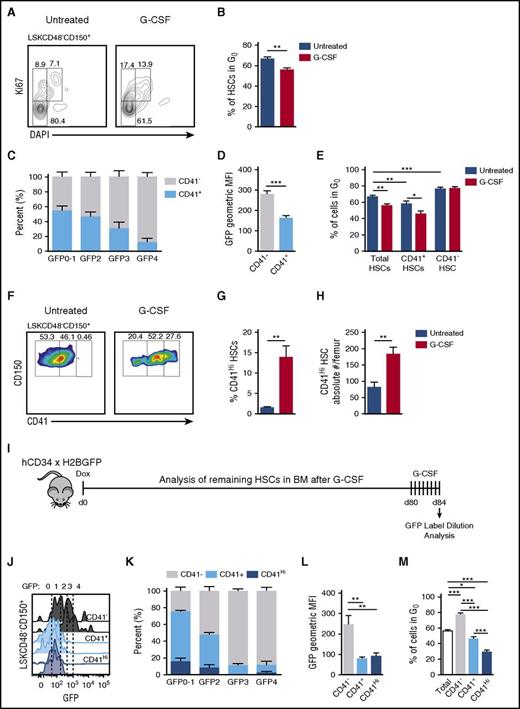
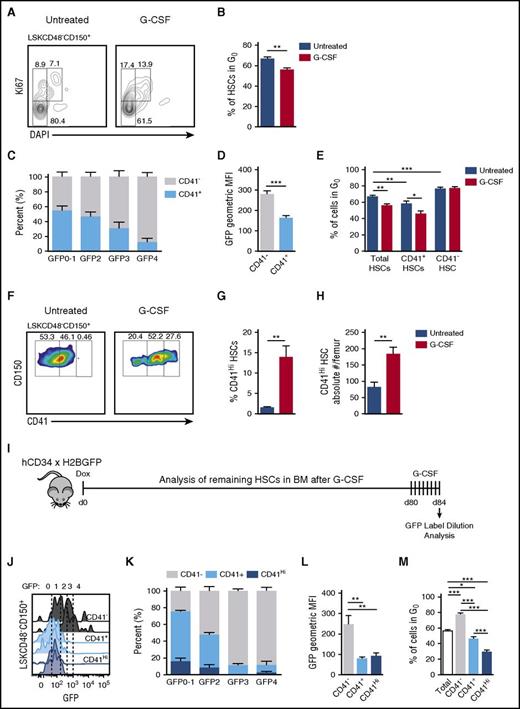
Our initial findings using label dilution to assess proliferation demonstrated that G-CSF does not induce dormant HSCs to proliferate. We were surprised by this result, given that G-CSF is well known to induce HSC proliferation. When assaying the static cell cycle profile of LSKCD48−CD150+ HSCs after G-CSF treatment, we confirmed a reduction in quiescence (Figure 4A-B), consistent with the results of the field. Recently, the heterogeneity of the phenotypically defined HSC compartment has been shown to contain not only functional HSCs but also diverse myeloid progenitors.18-20 As dormant HSCs represent all the LT-HSC potential in the HSC compartment, but only represent a small fraction of phenotypically defined HSCs, we asked whether G-CSF induces myeloid progenitors found within the HSC compartment to proliferate, rather than functional HSCs.
Proliferation in response to G-CSF is limited to CD41 expressing cells within the HSC compartment. (A) Representative plots displaying cell cycle status of the HSC compartment in response to G-CSF. (B) Quantification of G0 HSCs in panel A. (C) Distribution of CD41 expression on HSCs across GFP gates after a 12-week chase during homeostasis (no G-CSF). (D) Quantification of CD41− and CD41+ HSC GFP fluorescence intensities during homeostasis. (E) Quantification of total, CD41+, and CD41− HSCs in G0 with and without G-CSF treatment. (F) Representative plots of CD41 expression on HSCs with and without G-CSF treatment. (G) Quantification of CD41Hi cells within the HSC compartment. (H) Absolute numbers of CD41Hi HSCs in the BM. (I) Label dilution experimental set-up. (J) GFP histograms of CD41−, CD41+, and CD41Hi HSCs after G-CSF treatment. (K) Representation of CD41−, CD41+, and CD41Hi HSCs within each GFP gate after G-CSF treatment. (L) GFP fluorescence intensities after G-CSF treatment. (M) Cell cycle analysis of CD41−, CD41+, and CD41Hi HSCs after G-CSF treatment. Data are represented as mean ± SEM. n = 14 and 9 mice for control and G-CSF treatments, respectively (B, E, G, and H); n = 10 mice (C and D); n = 7 mice (K and L); n = 9 mice (M). *P < .05, **P < .01, ***P < .001 by Welch’s t test (B,E,G-H), paired t test (D), or 1-way repeated measures ANOVA with Tukey’s multiple comparison test (L-M).
Proliferation in response to G-CSF is limited to CD41 expressing cells within the HSC compartment. (A) Representative plots displaying cell cycle status of the HSC compartment in response to G-CSF. (B) Quantification of G0 HSCs in panel A. (C) Distribution of CD41 expression on HSCs across GFP gates after a 12-week chase during homeostasis (no G-CSF). (D) Quantification of CD41− and CD41+ HSC GFP fluorescence intensities during homeostasis. (E) Quantification of total, CD41+, and CD41− HSCs in G0 with and without G-CSF treatment. (F) Representative plots of CD41 expression on HSCs with and without G-CSF treatment. (G) Quantification of CD41Hi cells within the HSC compartment. (H) Absolute numbers of CD41Hi HSCs in the BM. (I) Label dilution experimental set-up. (J) GFP histograms of CD41−, CD41+, and CD41Hi HSCs after G-CSF treatment. (K) Representation of CD41−, CD41+, and CD41Hi HSCs within each GFP gate after G-CSF treatment. (L) GFP fluorescence intensities after G-CSF treatment. (M) Cell cycle analysis of CD41−, CD41+, and CD41Hi HSCs after G-CSF treatment. Data are represented as mean ± SEM. n = 14 and 9 mice for control and G-CSF treatments, respectively (B, E, G, and H); n = 10 mice (C and D); n = 7 mice (K and L); n = 9 mice (M). *P < .05, **P < .01, ***P < .001 by Welch’s t test (B,E,G-H), paired t test (D), or 1-way repeated measures ANOVA with Tukey’s multiple comparison test (L-M).
To test this, we examined CD41 within the HSC compartment. CD41 marks cells with myeloid differentiation potential and is an indicator of myeloid-biased HSCs.19-22 Given that G-CSF drives granulopoiesis, we examined the proliferative effects of G-CSF on the CD41+ portion of the HSC compartment. During steady state, CD41+ cells are enriched in the proliferative GFP0, GFP1, and GFP2 portions of the HSC compartment (Figure 4C). These populations contain robust myeloid CFU-C potential in culture, but no regenerative potential upon transplantation.14 In contrast, CD41− cells were highly enriched in the dormant GFP4 fraction (Figure 4C). Cell cycle analysis demonstrated that CD41+ cells had fewer cells in G0 than CD41− cells during homeostasis, and when treated with G-CSF, both total and CD41+ HSCs showed decreased quiescence, whereas CD41− HSCs were unaffected (Figure 4E). Together, these data indicate that CD41+, but not CD41−, cells within the BM HSC compartment cycle in response to G-CSF.
G-CSF induces supraphysiological CD41 expression within the HSC compartment
Recent work has demonstrated the activation of megakaryocyte progenitors within the HSC compartment characterized by CD41Hi expression after poly:IC-mediated inflammation.19 As G-CSF is produced in response to inflammatory signals,23 we examined CD41 expression changes within the BM HSC compartment in response to G-CSF treatment. Within the BM HSC compartment, we found CD41 was up-regulated to levels not seen during homeostatic conditions after G-CSF treatment (Figure 4F-G). CD41Hi HSC numbers within the BM also increased with G-CSF (Figure 4H). This CD41Hi HSC population is associated with proliferative GFP0-2 fractions in the BM (Figure 4J-K), which have no repopulation capacity in a transplantation setting,14 and a rapid cell cycle profile with the minority of cells in G0 (Figure 4M). These data indicate that CD41 expression positively correlates with proliferation within the HSC compartment after G-CSF treatment.
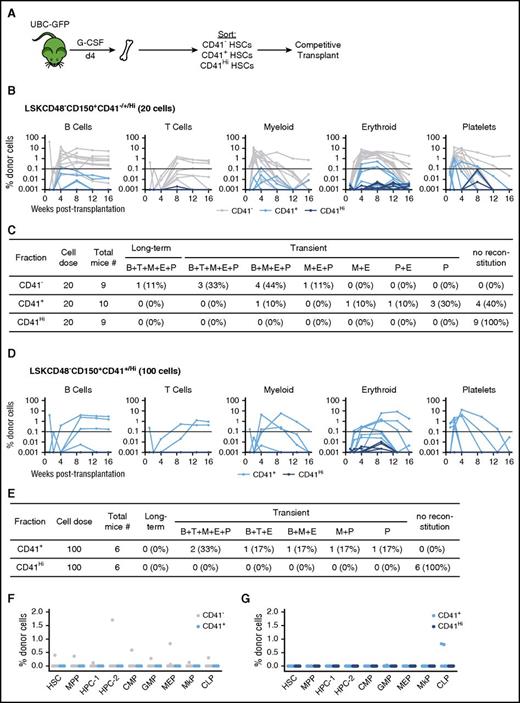
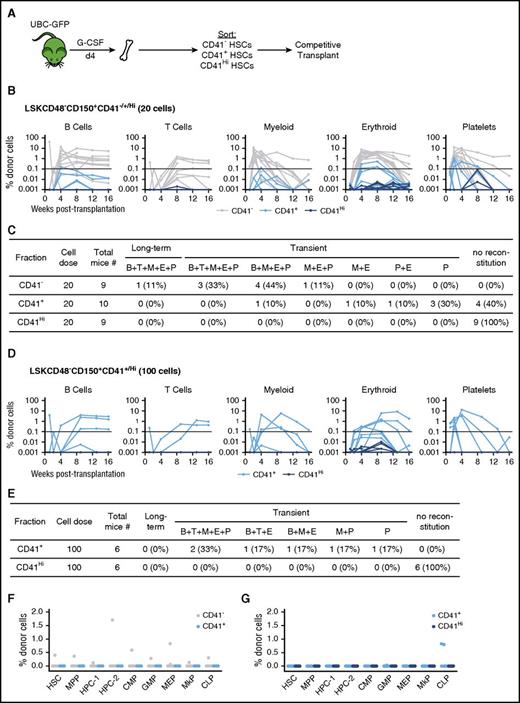
To test the function of the BM HSC compartment after G-CSF treatment, we performed transplantations of CD41−, CD41+, and CD41Hi LSKCD48−CD150+ cells found in the BM after G-CSF treatment (Figure 5A). Upon transplantation of 20 cells, we that found 9/9, 6/10, and 0/10 mice transplanted with CD41−, CD41+, and CD41Hi cells, respectively, exhibited repopulation in at least 1 lineage during at least 1 point after transplantation. CD41− cells primarily demonstrated multilineage engraftment, although 1/9 showed myeloid-erythroid-platelet engraftment (Figure 5B-C). Notably, 8/9 of these mice engrafted transiently, and only 1/9 showed sustained multilineage engraftment by 16 weeks posttransplantation (Figure 5C). Of the 6 mice repopulated with CD41+ cells, all were transiently engrafted (Figure 5B). Only 1 mouse demonstrated both myeloid and lymphoid engraftment, whereas the remaining 5 mice exhibited only myeloid regeneration (Figure 5C).
Competitive transplantation of CD41−/+/HiHSCs after G-CSF treatment. (A) Experimental schematic. UBC-GFP mice were treated with G-CSF for 4 days. Three hours after the final treatment, BM was harvested and the CD41−/+/Hi cells from within the HSC compartment were sorted and competitively transplanted. (B) Five-lineage repopulation of mice transplanted with 20 CD41−/+/Hi cells. Horizontal line represents threshold for repopulation. (C) Chart summarizing data from B. (D) Five-lineage repopulation of mice transplanted with 100 CD41+/Hi cells. (E) Chart summarizing data from D. (F) Analysis of the BM HSPC compartment 16 weeks after transplantation with 20 CD41−/+ cells. Only mice that demonstrated PB reconstitution were analyzed. (G) Analysis of the BM HSPC compartment 16 weeks after transplantation with 100 CD41+/Hi cells. All mice were analyzed, regardless of PB reconstitution.
Competitive transplantation of CD41−/+/HiHSCs after G-CSF treatment. (A) Experimental schematic. UBC-GFP mice were treated with G-CSF for 4 days. Three hours after the final treatment, BM was harvested and the CD41−/+/Hi cells from within the HSC compartment were sorted and competitively transplanted. (B) Five-lineage repopulation of mice transplanted with 20 CD41−/+/Hi cells. Horizontal line represents threshold for repopulation. (C) Chart summarizing data from B. (D) Five-lineage repopulation of mice transplanted with 100 CD41+/Hi cells. (E) Chart summarizing data from D. (F) Analysis of the BM HSPC compartment 16 weeks after transplantation with 20 CD41−/+ cells. Only mice that demonstrated PB reconstitution were analyzed. (G) Analysis of the BM HSPC compartment 16 weeks after transplantation with 100 CD41+/Hi cells. All mice were analyzed, regardless of PB reconstitution.
As CD41+ and CD41Hi HSCs exhibited little to no engraftment with 20 cells, we transplanted additional mice at a dose of 100 cells per mouse. All mice transplanted with 100 CD41+ cells engrafted, although all engraftment was short-term (Figure 5D-E). Three of 6 mice showed both myeloid and lymphoid reconstitution, including T cells, which were not seen in recipients of 20 CD41+ cells (Figure 5E). CD41Hi cells continued to exhibit no engraftment potential at a dose of 100 cells (Figure 5E). Sixteen weeks after transplantation, we analyzed the regenerated BM HSPC compartments from mice transplanted with 20 and/or 100 LSKCD48−CD150+ CD41−/+/Hi cells. In mice transplanted with 20 CD41− or CD41+ cells, only 1 CD41− cell recipient showed low-level contribution to the various BM HSPC compartments (Figure 5F). The remaining 8 CD41− mice and 6 CD41+ mice showed no engraftment (Figure 5F). In mice transplanted with 100 CD41+ or CD41Hi cells, only 2 mice transplanted with CD41+ cells showed low-level contribution to the common lymphoid progenitor population, but no engraftment across any of the other HSPC compartments (Figure 5G). Taken together, our results suggest that cells within the HSC compartment found in the BM after G-CSF treatment have limited regenerative properties when assayed by transplantation.
CD41Hi cells rapidly generate megakaryocytes in culture with minimal proliferation
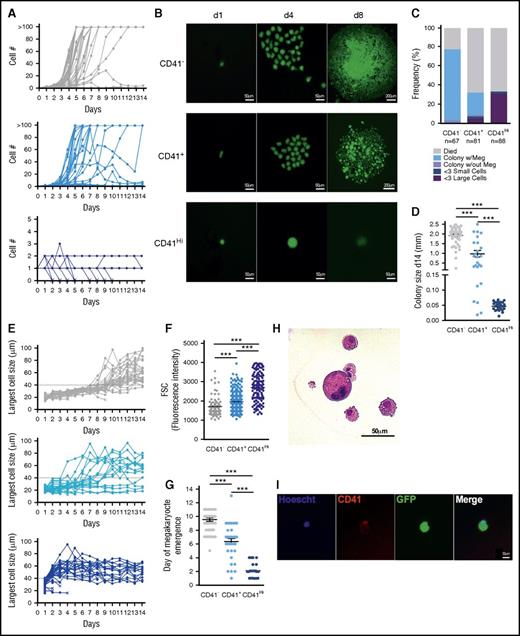
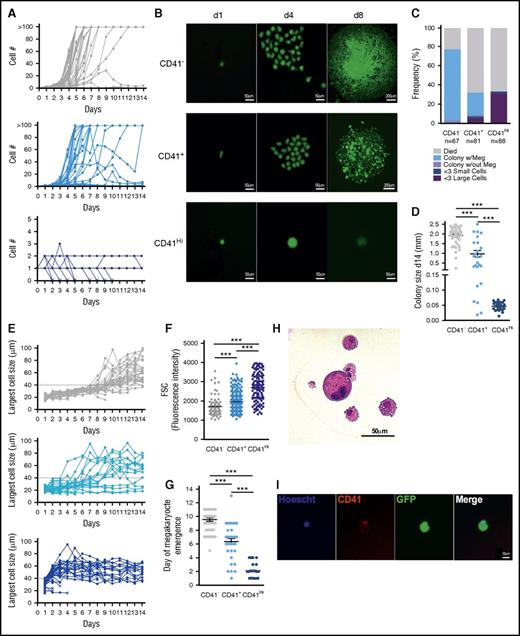
CD41Hi expression on cells within the HSC compartment after inflammatory stress identifies cells with unipotent megakaryocyte potential.19 As CD41Hi cells had no regenerative potential in transplantation, to better understand their function, we performed single-cell CFU megakaryocyte assays and tracked proliferation, cell size, and megakaryocyte emergence over time. In culture, CD41− and CD41+ cells readily proliferated to form colonies (Figure 6A-B). However, most CD41Hi cells did not proliferate through 14 days in culture, and only in a few instances did the cells divide to generate 2 or 3 cells (Figure 6A). Instead, CD41Hi cells increased in size over time in culture and matured into large round megakaryocytes. Of the CD41Hi cells that went on to generate megakaryocytes, 90.9% increased in size without proliferating within 2 to 4 days in culture, but subsequently began to die after about 1 week (Figure 6B).
CD41HiHSCs rapidly generate megakaryocytes in culture without proliferation. Single CD41−/+/Hi HSCs from UBC-GFP mice treated with G-CSF (Figure 5A) were sorted into wells of a 96-well plate and cultured in the presence of Tpo, Epo, IL-6, IL-3, and SCF. Cells were observed daily, and cell number, cell size, and megakaryocyte emergence was quantified. (A) Proliferation of single CD41−/+/Hi cells over 14 days in culture. (B) Representative images of sorted CD41−/+/Hi over time. (C) CD41−/+/Hi cell fate assayed at day 14. (D) Quantification of colony diameter at day 14. “Colony size” of CD41Hi cells was most often the diameter of remaining single cells. (E) Quantification of the largest cell diameter visible in culture over time. The dashed line at 40 μm represents the threshold above which a cell was considered “large.” (F) Size of single CD41−/+/Hi cells before culture. (G) Quantification of megakaryocyte emergence over time. (H) Hematoxylin and eosin staining of a megakaryocyte from a CD41− cell colony. Megakaryocyte is large and contains a multilobule nucleus. (I) Live imaging of representative single CD41Hi cell on day 5 of culture. Cell stains positive for megakaryocyte marker CD41 and has a multilobule nucleus. Data are representative of 2 to 3 independent experiments. ***P < .001 by 1-way ANOVA with Tukey’s multiple comparisons test.
CD41HiHSCs rapidly generate megakaryocytes in culture without proliferation. Single CD41−/+/Hi HSCs from UBC-GFP mice treated with G-CSF (Figure 5A) were sorted into wells of a 96-well plate and cultured in the presence of Tpo, Epo, IL-6, IL-3, and SCF. Cells were observed daily, and cell number, cell size, and megakaryocyte emergence was quantified. (A) Proliferation of single CD41−/+/Hi cells over 14 days in culture. (B) Representative images of sorted CD41−/+/Hi over time. (C) CD41−/+/Hi cell fate assayed at day 14. (D) Quantification of colony diameter at day 14. “Colony size” of CD41Hi cells was most often the diameter of remaining single cells. (E) Quantification of the largest cell diameter visible in culture over time. The dashed line at 40 μm represents the threshold above which a cell was considered “large.” (F) Size of single CD41−/+/Hi cells before culture. (G) Quantification of megakaryocyte emergence over time. (H) Hematoxylin and eosin staining of a megakaryocyte from a CD41− cell colony. Megakaryocyte is large and contains a multilobule nucleus. (I) Live imaging of representative single CD41Hi cell on day 5 of culture. Cell stains positive for megakaryocyte marker CD41 and has a multilobule nucleus. Data are representative of 2 to 3 independent experiments. ***P < .001 by 1-way ANOVA with Tukey’s multiple comparisons test.
After 14 days in culture, CD41− cells generated the largest colonies, with most colonies demonstrating megakaryocyte potential (Figure 6C-D,H). Of CD41+ cells, 67.9% died in culture, which partially explains their poor engraftment potential. Those that went on to form colonies generally formed smaller colonies, although 95% contained megakaryocytes (Figure 6C-D). However, 4.9% of CD41+ cells directly generated megakaryocytes without proliferation. Similar to the CD41+ cells, 67.0% of CD41Hi cells died by the end of culture. However, the vast majority of all sorted CD41Hi cells directly matured into large megakaryocyte cells, characterized by a large round morphology, multilobule nuclei, and CD41 expression before cell death (Figure 6B,E,I). To follow the emergence of megakaryocytes in culture, we quantified cell size over time (Figure 6E). Although CD41Hi cells are larger than CD41− or CD41+ cells at the time of sort (Figure 6F), the data show an inverse relationship between the amount of time required to generate large, round megakaryocytes, and CD41 expression on the initially sorted cell (Figure 6G). Together, these data suggest that CD41Hi cells found within the HSC compartment after G-CSF treatment are unipotent megakaryocyte precursors that rapidly mature into megakaryocytes in culture.
Discussion
Mobilized PB has surpassed harvested BM as a source of HSCs for clinical transplantation. Thus, understanding the process of HSC mobilization and the possible effects of mobilization on stem cell activity are crucial to improving patient outcome after transplantation. As G-CSF is known to induce HSC proliferation, and proliferative history is inversely correlated with HSC functional capacity, here we set out to understand how changes to proliferative history after G-CSF treatment informs mobilized PB HSC and residual BM HSC function. Initially, we found that immediately after G-CSF treatment, dormant HSCs are depleted from the BM. However, we show that this is a result of preferential mobilization of dormant HSCs to the PB and spleen, and not a result of dormant HSC proliferation, as previously demonstrated.16 These dormant HSCs transit the PB and accumulate in the spleen, where they remain until BM homeostasis is reestablished, at which point they return to the BM without detectable changes to proliferative history. These results are consistent with results demonstrating that mobilized HSPCs are quiescent,11 but contradict studies demonstrating that HSPCs cycle before mobilization into the PB.11,13 The use of cyclophosphamide in the mobilization regiment in these studies could account for these discrepancies. However, another recent study using a membrane-permeable dye to track HSC divisional history also demonstrated that G-CSF does not cause HSC divisions, nor does it sensitize HSCs to 5-flurouracil treatment.24
We further examined the regeneration potential of mobilized PB. Although we confirmed a competitive defect from G-CSF mobilized PB compared with untreated BM,8 we also showed that this defect is independent of divisional history. This competitive disadvantage may be partially explainable by homing defects associated with higher CD26 expression on mobilized PB than untreated BM cells,25 which is known to inhibit homing capacity upon transplantation.26 HSPCs isolated from the spleen after dual cyclophosphamide/G-CSF treatment were also less efficient at engrafting a lethally irradiated mouse.11 Mobilized PB HSPCs have lower levels of cKit,27,28 EPCR,29 and VLA-4,30-33 all of which play important roles in maintaining HSCs in the BM microenvironment, and loss of which may confer a competitive disadvantage at repopulating a lethally irradiated host.34-36 It is unclear whether LR-HSPCs in the spleen exhibit similar defects. Further experiments will be needed to discern the specific transplantation defects associated with mobilized HSPCs.
Studies examining HSC proliferation resulting from G-CSF treatment examine cell cycle profiles of the HSC compartment. However, regardless of cell surface marker phenotype, these populations are heterogeneous, and at best only enrich for LT-HSCs capable of serial engraftment potential.14,20,37 By examining proliferation via H2BGFP label dilution, we were able to demonstrate that LR-HSCs in the BM do not respond to G-CSF treatment with proliferation. However, by dissecting the heterogeneity of the HSC compartment, we revealed that the proliferation that does occur after G-CSF treatment is restricted to cells that express CD41. In transplantation assays, these cells function with reduced differentiation and self-renewal potential, and are likely already lineage-committed progenitors within the HSC compartment. It is worth noting that of all the cells examined remaining in the BM, the vast majority had no long-term regenerative potential after transplantation, as measured by sustained engraftment for 16 weeks in primary hosts. These results support work demonstrating transplantation defects of the BM HSC population after G-CSF treatment,38-40 and are consistent with our data that the majority of LT-HSCs, identifiable as label-retaining cells, have left the BM.
The G-CSF receptor has been identified on the surface of megakaryocyte progenitors and has been demonstrated to repress megakaryocyte maturation.41 However, it is thought that this suppression acts only on more mature stages of megakaryocyte differentiation, whereas G-CSF mediates the expansion of the less differentiated megakaryocyte cell types.42 G-CSF is produced as a consequence of infection in response to inflammatory signals.9,23 Thus, the emergence of a subpopulation of CD41Hi megakaryocyte progenitors is consistent with reports that find this population after inflammation induced by Poly:IC, LPS, and TNFα.19 In contrast to this previous study, we found no detectable engraftment potential from CD41Hi cells from the BM after G-CSF treatment. One possibility is that this may be a result of differences in transplantation protocols. Here we transplanted cells via retro-orbital injection, whereas the previous study transplanted their CD41Hi population intrafemorally, alleviating the need of these cells to home to the bone marrow. Alternatively, the difference could be associated with the G-CSF treatment itself. The previous study tested the function of these CD41Hi progenitors 16 hours after treatment, at which time these cells still possessed weak, but detectable, engraftment potential.19 However, our G-CSF protocol is 4 days long, and although it is likely that CD41Hi cells appear earlier, by day 4 these cells may have matured and lost engraftment potential.
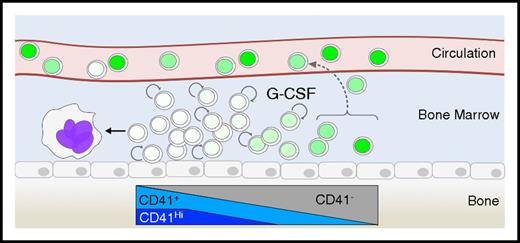
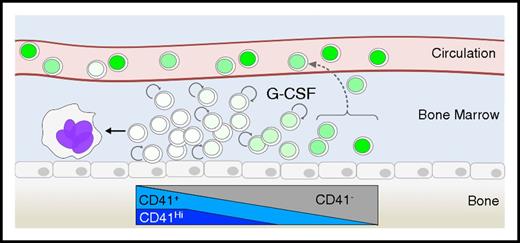
Our results suggest a model of the HSC compartment in the BM during G-CSF treatment, where cells are organized according to label retention (Figure 7). Label retention positively correlates with multilineage engraftment and self-renewal potential, and negatively correlates with CD41 expression. After G-CSF treatment, LR-HSCs are preferentially mobilized to the PB and spleen without proliferation. Once in the periphery, LR-HSCs remain in the spleen until BM homeostasis has been reestablished several weeks after the initiation of treatment. The remaining cells of the BM within the HSC compartment respond to proliferation in a CD41 expression-dependent manner. CD41Hi cells emerge in response to G-CSF, are associated with the HSC fraction with the greatest divisional history, and exhibit unipotent megakaryocyte potential. It remains unclear why LR-HSCs are preferentially mobilized in response to G-CSF, and whether this is an active or passive process. As the most potent HSCs are often within a single cell diameter of endothelial cells,37,43 increased vasculature permeabilization after G-CSF32,44 may passively allow cells most closely associated to the endothelium to enter into the blood. Future experiments are needed to dissect this mechanism. It will be of interest to test whether other mobilizing agents preferentially mobilize LR-HSCs.
Model of BM proliferative response to G-CSF treatment. In response to G-CSF, dormant HSCs are mobilized to the circulation without proliferation. These cells will accumulate in the spleen and return to the BM with time. The remaining cells in the BM after G-CSF treatment can be organized based on CD41 expression, which positively correlates with divisional history. Proliferative response to G-CSF is exclusively associated with CD41 expressing cells, and the CD41Hi population rapidly matures into megakaryocytes. Label dilution is illustrated by the various shades of green in the nuclei of the cells. Circular arrows represent cell proliferation.
Model of BM proliferative response to G-CSF treatment. In response to G-CSF, dormant HSCs are mobilized to the circulation without proliferation. These cells will accumulate in the spleen and return to the BM with time. The remaining cells in the BM after G-CSF treatment can be organized based on CD41 expression, which positively correlates with divisional history. Proliferative response to G-CSF is exclusively associated with CD41 expressing cells, and the CD41Hi population rapidly matures into megakaryocytes. Label dilution is illustrated by the various shades of green in the nuclei of the cells. Circular arrows represent cell proliferation.
The publication costs of this article were defrayed in part by page charge payment. Therefore, and solely to indicate this fact, this article is hereby marked “advertisement” in accordance with 18 USC section 1734.
Acknowledgments
The authors thank members of the Lemischka laboratory for advice and criticisms. The authors thank X. Niu and Y. Liu for mouse colony maintenance until J.M.B. took over the experiments. The authors also thank the flow cytometry and animal facility shared resources at the Icahn School of Medicine at Mount Sinai.
K.M. was supported by National Institutes of Health, National Heart, Lung, and Blood Institute grant 2R01HL58739, and J.M.B was supported by National Institutes of Health, Eunice Kennedy Shriver National Institute of Child Health and Human Development grant T32HD075735 and National Heart, Lung, and Blood Institute grant F31HL131290.
Authorship
Contribution: J.M.B. conceived and performed experiments, acquired and analyzed data, and wrote the manuscript; M.G.D. and Y.S.F. performed experiments and edited the manuscript; and K.M. conceived and performed experiments, edited the manuscript, and managed the project.
Conflict-of-interest disclosure: The authors declare no competing financial interests.
Correspondence: Kateri Moore, Icahn School of Medicine at Mount Sinai, One Gustave L. Levy Place, Box 1496, Icahn Medical Institute, 1425 Madison Ave, 13-21E, New York, NY 10029; email: kateri.moore@mssm.edu.

