Key Points
The slan marker can be used to define nonclassical and intermediate monocytes in human blood.
slan-negative intermediate monocytes are expanded in sarcoidosis, and slan-positive nonclassical monocytes are depleted in HDLS.
Abstract
Human monocytes are subdivided into classical, intermediate, and nonclassical subsets, but there is no unequivocal strategy to dissect the latter 2 cell types. We show herein that the cell surface marker 6-sulfo LacNAc (slan) can define slan-positive CD14+CD16++ nonclassical monocytes and slan-negative CD14++CD16+ intermediate monocytes. Gene expression profiling confirms that slan-negative intermediate monocytes show highest expression levels of major histocompatibility complex class II genes, whereas a differential ubiquitin signature is a novel feature of the slan approach. In unsupervised hierarchical clustering, the slan-positive nonclassical monocytes cluster with monocytes and are clearly distinct from CD1c+ dendritic cells. In clinical studies, we show a selective increase of the slan-negative intermediate monocytes to >100 cells per microliter in patients with sarcoidosis and a fivefold depletion of the slan-positive monocytes in patients with hereditary diffuse leukoencephalopathy with axonal spheroids (HDLS), which is caused by macrophage colony-stimulating factor (M-CSF) receptor mutations. These data demonstrate that the slan-based definition of CD16-positive monocyte subsets is informative in molecular studies and in clinical settings.
Introduction
The first clear evidence for monocyte heterogeneity was obtained in humans with the use of flow cytometry. These early studies described the classical monocytes and a then-novel population of CD16-positive monocytes.1 The latter cells account for about 10% of all monocytes in healthy individuals, but their number can strongly increase with mobilization from the marginal pool.2 An increase of these cells has been reported for many inflammatory conditions including sepsis,3 and anti-inflammatory therapy with glucocorticoids can deplete these cells selectively.4,5 Also, after stimulation with Toll-like receptor (TLR) ligands, the CD16-positive monocytes were shown to be superior producers of proinflammatory cytokines like tumor necrosis factor.6 On the basis of these features, these cells were termed proinflammatory monocytes.7
Using CD64 as a marker, a population of CD16+CD64+ monocytes was described, which localized between the classical monocytes and the majority of the CD16-positive monocytes.6 Clinical studies suggested that these intermediate cells can also expand in inflammatory conditions.8,9 Taking these findings into account, a nomenclature proposal suggested calling these cells intermediate monocytes (CD14++CD16+) as compared to classical monocytes (CD14++CD16−) and nonclassical monocytes (CD14+CD16++).10 Detailed studies have shown that these cells are intermediate with respect to the expression of many molecules but show selectively high levels of major histocompatibility complex (MHC) class II and CD74 and molecules involved in angiogenesis.11,12
Many publications have subsequently reported on an expansion of intermediate monocytes in various conditions.13 It remained difficult, however, to clearly separate the intermediate from the nonclassical monocytes because there was no selective marker to dissect these 2 subsets of CD16-positive monocytes. In the present article, we investigate whether the 6-sulfo LacNAc (slan) marker can be used for this purpose. slan is a carbohydrate residue that is O-linked via a 6-O-sulfotransferase to the P-selectin glycoprotein ligand on the surface of blood leukocytes.14
slan-positive cells have been reported to be CD14dimCD16bright, CCR2-negative monocytes that show high levels of cytokine production and have superior antigen-presentation capacity,15 features shared with the CD16-positive monocytes. We now show that intermediate monocytes are slan-negative and demonstrate that this marker can be used to define nonclassical monocytes as CD16-positive slan-positive cells, and intermediate monocytes as CD16-positive slan-negative cells.
When we compared the genome-wide gene expression data of nonclassical and intermediate monocytes defined either via the level of CD14 expression or based on the expression of slan, the analysis revealed an increased MHC class II and C1Q expression for both approaches. When using the dissection of CD16-positive monocytes based on slan expression, an unexpected ubiquitin signature is discovered, suggesting a biologically relevant separation of the subsets.
We tested the new slan-based approach to monocyte subset definition in patients with sarcoidosis, an inflammatory disease for which an expansion in CD16-positive monocytes had been noted.16 In these patients, our data demonstrate a selective increase in the slan-negative intermediate monocytes, but not in the slan-positive nonclassical monocytes, indicating that these 2 subsets can be regulated independently. In addition, we studied patients with hereditary diffuse leukoencephalopathy with axonal spheroids (HDLS), a neurologic disease associated with mutations in the macrophage colony-stimulating factor (M-CSF) receptor (M-CSF-R) gene.17 We show herein that there is a pronounced depletion of the slan-positive nonclassical monocytes in HDLS. These data indicate that the slan marker can be used for an informative separation of intermediate and nonclassical monocytes in humans.
Materials and methods
Blood samples
EDTA blood samples were obtained after written informed consent from healthy volunteers and patients with sarcoidosis or HDLS. The sarcoidosis patients were studied before diagnostic bronchoscopy and before any treatment with glucocorticoids. HDLS cases 693, 745, and 766 have been described in Schuberth et al,18 and case 667 was reported in Karle et al.19 The study was approved by the local ethics committee of the Ludwig-Maximilians-Universität München.
Fluorescence-activated cell sorting analysis
A total of 100 μL of blood was admixed with antibodies (see supplemental Table 1, available on the Blood Web site, for the directly conjugated monoclonal antibodies) for 20 minutes on ice in the dark. Samples were lysed in Q-Prep Workstation (Beckman Coulter) including formaldehyde fixation (0.1%). An equal volume of counting beads (C36950; Molecular Probes) was added. Samples were run on a FACSCalibur flow cytometer (Becton Dickinson) for 4-color analysis. A total of 5000 classical monocytes were acquired per sample. The instrument settings are compiled in supplemental Table 2.
Gating strategy
All monocytes and the upper right third of lymphocytes were gated in the forward scatter/side scatter plot, and these events were shown in a CD14/HLA-DR plot. The DR-positive cells were gated and shown in a CD14/CD16 dot plot. In this plot, the classical, nonclassical, and intermediate monocytes were separated by a vertical line to the left of the classical monocytes.20,21 Alternatively, slan expression on the DR-positive cells was displayed in a 1-color histogram. The slan-positive and slan-negative cells were then displayed in a CD14/CD16 histogram, and the slan-positive CD16-positive nonclassical monocytes and the slan-negative CD16-positive intermediate monocytes were determined. Absolute counts per microliter of blood were then determined with reference to counting beads.
MACS isolation of monocyte subsets and DCs
Monocyte subsets were purified using microbead-conjugated antibodies and magnetic-activated cell sorting (MACS) columns based on CD14 expression and on slan expression, and dendritic cells (DCs) were isolated using CD1c. Details are given in supplemental Materials.
Generation of MACE libraries
Massive analysis of complimentary DNA ends (MACE) is the latest advancement in tag-based gene expression analysis methods.22 MACE libraries were prepared by GenXPro (Frankfurt, Germany), as detailed in supplemental Materials. Ten barcoded samples were sequenced simultaneously in 1 lane of a HiSeq 2000 (Illumina, San Diego, CA) with 1 × 100 bp.
For quantification of messenger RNA expression, MACE reads in each monocyte subset library were polyA trimmed, and the marked quality region was removed. Mapping of reads to the human genome (hg19) was performed with NovoAlign (http://novocraft.com). Normalization and test for differential expression was performed in the statistical programming language R (www.r-project.org) with the DESeq package.23 Expression levels are given in tags per million (tpm). Gene ontology (GO)-enrichment analysis was performed using the GO-enrichment toolkit from http://genxpro.ath.cx, which is based on Fisher’s exact test among transcripts that are differentially expressed at a P value of <.05. For hierarchical clustering, a gene set consisting of the 427 transcripts with a minimum coefficient of variation of 0.25 was selected. The clustering was performed using the Multiple Experiment Viewer (version 4.9.0) based on the Pearson correlation and average linkage clustering.
Statistical analysis
Case control comparisons were done using the Mann-Whitney U test. Correlations were tested with the Spearman rank correlation analysis. Values of P < .05 were considered significant.
Results
Definition of intermediate monocytes
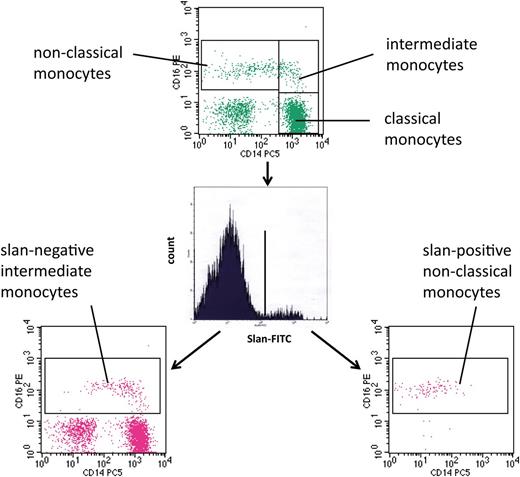
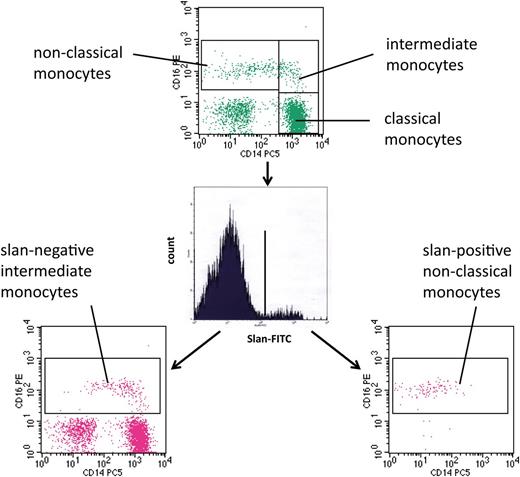
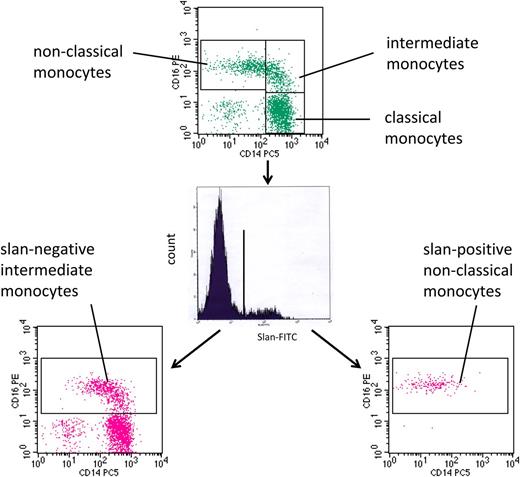
For the analysis of monocytes in human blood, we used multicolor flow cytometry with antibodies against HLA-DR, CD14, and CD16. As shown in Figure 1 (top) monocytes can be subdivided into classical, intermediate, and nonclassical cells. The intermediate cells are defined within the CD14 vs CD16 dot plot, in that they are separated from the nonclassical monocytes using a vertical line and from the classical monocytes using a horizontal line (rectangular gating strategy).21 These intermediate monocytes account for 16.8 cells per microliter in this example, whereas the nonclassical monocytes account for 39.3 cells per microliter. When we added the anti-slan antibody to the staining panel, we showed that this reagent can clearly separate slan-positive and slan-negative monocytes (Figure 1, center). When the slan-positive monocytes are shown in a CD14 vs CD16 dot plot, these cells are found in the area of the nonclassical monocytes (Figure 1, bottom right). When the slan-negative CD16-positive monocytes are shown in a CD14 vs CD16 dot plot (Figure 1, bottom left), they clearly cover the area of the intermediate monocytes as defined in the top section, but the population also extends into the area previously thought to contain only nonclassical monocytes. The slan-positive CD16-positive monocytes in this example account for 26.3 cells per microliter, whereas the slan-negative CD16-positive monocytes amount to 31.2 cells per microliter.
Use of slan for dissection of CD16-positive monocyte subsets. Whole blood from a healthy control (ID 2059) was stained with monoclonal antibodies to CD14, CD16, HLA-DR, and slan and analyzed in 4-color flow cytometry. Monocyte subsets defined in the CD14 CD16 dot plot (top) are classical (417.6 cells per microliter), intermediate (16.8 cells per microliter), and nonclassical monocytes (39.3 cells per microliter). Separation based on slan reveals slan-positive nonclassical monocytes (26.3 cells per microliter) (bottom right) and slan-negative intermediate monocytes (31.2 cells per microliter) (bottom left).
Use of slan for dissection of CD16-positive monocyte subsets. Whole blood from a healthy control (ID 2059) was stained with monoclonal antibodies to CD14, CD16, HLA-DR, and slan and analyzed in 4-color flow cytometry. Monocyte subsets defined in the CD14 CD16 dot plot (top) are classical (417.6 cells per microliter), intermediate (16.8 cells per microliter), and nonclassical monocytes (39.3 cells per microliter). Separation based on slan reveals slan-positive nonclassical monocytes (26.3 cells per microliter) (bottom right) and slan-negative intermediate monocytes (31.2 cells per microliter) (bottom left).
In 10 healthy male donors, the average number of slan-positive monocytes was 36.8 ± 23.0 cells per microliter and the average number of slan-negative CD16-positive intermediate cells was 41.7 ± 24.1 cells per microliter. When nonclassical and intermediate monocytes were defined via the density of CD14, the respective numbers were 48.1 ± 27.5 and 24.0 ± 11.2 cells per microliter (Table 1).This finding demonstrates that the definition of intermediate monocytes as slan-negative CD16-positive monocytes results in a much larger population as compared to the definition based on CD14 expression level.
We then asked whether the slan-based definition may provide an informative dissection of the CD16-positive monocytes into intermediate and nonclassical cells. For this, we studied the entire transcriptome of monocyte subsets isolated by the 2 approaches using preparations from 5 different donors. In line with the staining pattern in Figure 1, the slan-based intermediate monocytes and nonclassical monocytes extended well beyond the vertical CD14 cutoff line used for the CD14-based definition (supplemental Figure 1).
Gene expression analysis in subsets of CD16-positive monocytes
We then performed MACE of the monocyte subsets and analyzed differentially expressed genes (DEGs) after filtering, as described in “Materials and methods.” When focusing on transcripts with at least a 1.2-fold difference (supplemental Table 3), we found 676 DEGs between intermediate and nonclassical monocytes for the CD14-based separation, and 385 DEGs for the slan-based definition.
Among these, 362 DEGs were found using only the CD14-based separation, and 71 DEGs were found using only the slan-based definition of nonclassical and intermediate monocytes. In addition, 314 DEGs were found in common between the 2 approaches.
Among the 314 common genes, the top genes greater than eightfold higher in intermediate monocytes based on CD14 comparison were STAB1, FPR3, PLA2G7, RNASE6, CLEC10A, CLEC4E, LGALS2, CD1C, and MS4A6A, and those greater than fourfold in nonclassical monocytes based on CD14 comparison were LYPD2, VMO1, and SCART1 (supplemental Table 3A); the dominant GO term was “immune system process.”
The interaction analysis for these common genes revealed a strong cluster containing MHC class II genes, including CD74, CIITA, and CD1D, all of which are related to antigen presentation. In addition, there was a closely associated cluster containing genes C1QA, -B, and -C; all of these class II and complement genes show a higher expression in intermediate monocytes (Figure 2A).
Interaction analysis of the differential genes between nonclassical and intermediate monocytes. Shown are interactions at a confidence score of 0.5. (A) DEGs found for both the slan-based and the CD14-based definition of subsets. (B) DEGs found for the CD14-based definition of subsets. (C) DEGs found for the slan-based definition of subsets.
Interaction analysis of the differential genes between nonclassical and intermediate monocytes. Shown are interactions at a confidence score of 0.5. (A) DEGs found for both the slan-based and the CD14-based definition of subsets. (B) DEGs found for the CD14-based definition of subsets. (C) DEGs found for the slan-based definition of subsets.
DEGs unique for the CD14-based separation of CD16 monocytes (greater than eightfold higher in intermediate monocytes) included CATSPER1, TDRD6, ASGR2, SCD, CYP2S1, SIGLEC1, and CDC42EP1, and those greater than fourfold higher in nonclassical monocytes included CARD11, FCRL1, C12orf75, and ETS1 (supplemental Table 3B); the dominant GO term was “regulation of response to stimulus.”
An interaction analysis revealed a cluster containing many molecules involved in signal transduction (VAV1, FYN, SOCS3, PTK2B, and PLCG2); in addition, there was a ribosomal protein cluster of genes (Figure 2B).
DEGs unique to the slan-based definition of CD16 monocytes (greater than fourfold higher in intermediate monocytes) included MMP25, and those greater than fourfold higher in nonclassical monocytes included P2RY10 (supplemental Table 3C); the dominant GO term was “regulation of cytokine production.”
The interaction analysis revealed a set of 50 genes, of which all are connected to ubiquitin C (UBC), a transcript that shows a higher expression level in slan-positive nonclassical monocytes. The interacting genes include signaling molecules IRAK3 and MAP3K1 (higher in nonclassical) and genes higher in slan-defined intermediate monocytes, including NFKB2, IRF8, and MAP4K1 (Figure 2C). In addition, there is a cluster of 3 mitochondrial genes that show higher expression in nonclassical monocytes.
When analyzing the genes higher in slan-defined nonclassical monocytes separately, the dominant GO term was “MyD88-dependent TLR signaling pathway,” and this included the genes IRAK3, PELI1, UBC, and MAP3K1.
Validation of these DEGs was done by reverse-transcription polymerase chain reaction (RT-PCR) on 8 top differential genes (supplemental Table 3A,C) using the same samples that had been employed for MACE. The genes STAB1, FPR3, RNASE6, and CLEC10A gave significant differences for both the CD14- and slan-based nonclassical and intermediate monocytes, with a somewhat stronger effect seen with the CD14-based approach for these genes. The genes MMP25, CRISPLD2, DUSP2, and NPM3, however, showed no difference on RT-PCR for the CD14-defined nonclassical and intermediate monocytes, but the slan-based definition revealed clear and significant differences for these genes (supplemental Materials; supplemental Figure 2). These patterns obtained using RT-PCR match the patterns seen with MACE (supplemental Table 3).
Taken together, these data show a clearly differential gene expression pattern between nonclassical and intermediate monocytes for both the CD14- and slan-based definitions, and this included genes involved in immune processes and antigen presentation. For the CD14-based definition, more signaling molecules were detected. For the slan-based definition of intermediate and nonclassical monocytes, unique DEGs included a ubiquitin signature and genes involved in TLR signaling.
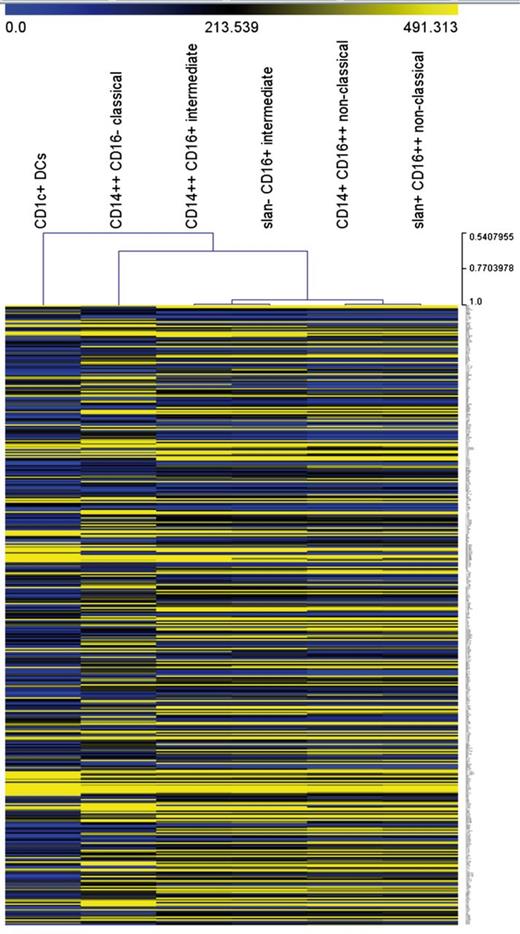
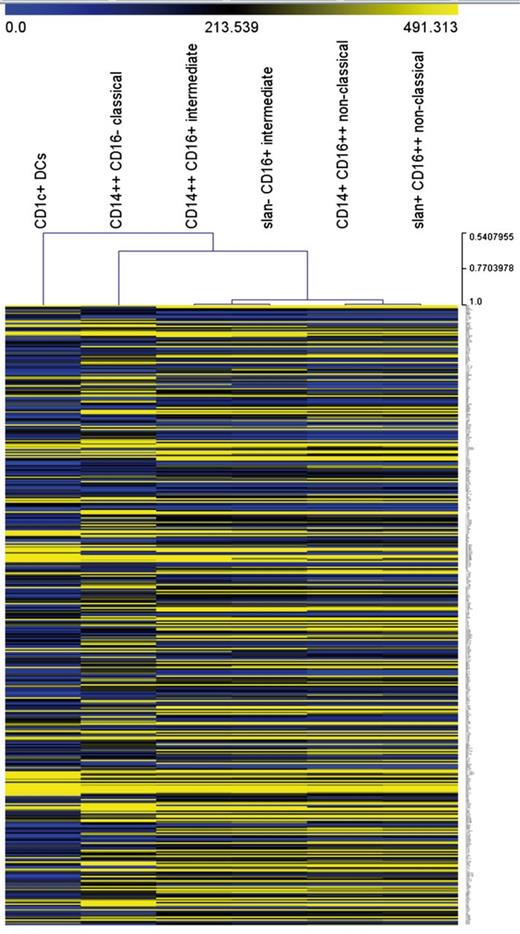
Unsupervised hierarchical clustering analysis supports the separation of nonclassical and intermediate monocytes for both approaches (Figure 3). Also, all monocyte subsets, including the slan-positive nonclassical monocytes, are clearly separated from the CD1c+ DCs, which establishes that the slan-positive nonclassical monocytes are distinct from DCs.
Unsupervised hierarchical clustering of monocyte subsets and CD1c+ DCs. The analysis is based on 427 transcripts with a minimum coefficient of variation of 0.25.
Unsupervised hierarchical clustering of monocyte subsets and CD1c+ DCs. The analysis is based on 427 transcripts with a minimum coefficient of variation of 0.25.
Increase of slan-negative CD16-positive intermediate monocytes in sarcoidosis
We then analyzed monocyte subsets based on slan and CD16 expression in sarcoidosis, a systemic granulomatous, inflammatory disease in which an increase in CD16-positive monocytes had been shown.8,16 We studied our patients before diagnostic bronchoscopy and before any immunosuppressive therapy with glucocorticoids. Only cases confirmed to have sarcoidosis based on histology showing noncaseating granulomas were included in the present analysis (Tables 1 and 2).
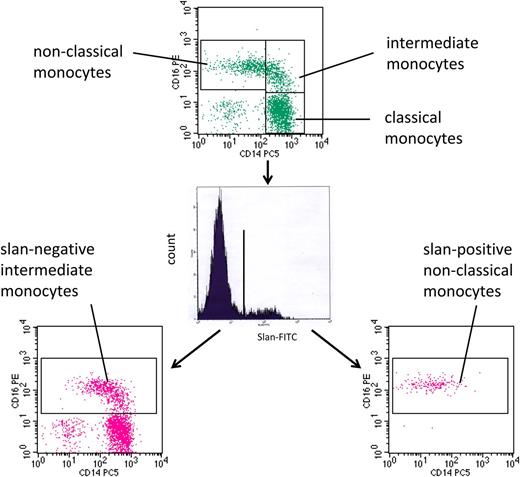
As demonstrated in Figure 4, such patients can show a strong increase in CD16-positive monocytes. In this example, the CD16-positive monocytes are increased to 224.8 cells per microliter. When subdivided on the basis of CD14 expression level, nonclassical monocytes account for 123.2 cells per microliter and intermediate monocytes for 101.6 cells per microliter. However, this subdivision appears rather arbitrary because the vertical line cuts through a homogenous population of events (Figure 4, top). When subdividing the cells based on slan expression, slan-negative CD16-positive intermediate monocytes account for 164.7 cells per microliter (Figure 4, bottom left) and slan-positive CD16-positive nonclassical monocytes for only 61.0 cells per microliter in this example (Figure 4, bottom right). Hence, with the new definition, the increase in CD16 monocytes in sarcoidosis is mainly due to the intermediate monocytes, whereas the nonclassical monocytes show only a moderate rise in number in this example.
slan-based CD16-positive monocyte subsets in sarcoidosis. Whole blood from a sarcoidosis patient (ID 2074) was stained with monoclonal antibodies to CD14, CD16, HLA-DR, and slan and analyzed in 4-color flow cytometry. Monocyte subsets defined in the CD14 CD16 dot plot (top) are classical (427.6 cells per microliter), intermediate (101.6 cells per microliter), and nonclassical monocytes (123.2 cells per microliter). Separation based on slan reveals slan-positive nonclassical monocytes (61.0 cells per microliter) (bottom right) and slan-negative intermediate monocytes (164.7 cells per microliter) (bottom left).
slan-based CD16-positive monocyte subsets in sarcoidosis. Whole blood from a sarcoidosis patient (ID 2074) was stained with monoclonal antibodies to CD14, CD16, HLA-DR, and slan and analyzed in 4-color flow cytometry. Monocyte subsets defined in the CD14 CD16 dot plot (top) are classical (427.6 cells per microliter), intermediate (101.6 cells per microliter), and nonclassical monocytes (123.2 cells per microliter). Separation based on slan reveals slan-positive nonclassical monocytes (61.0 cells per microliter) (bottom right) and slan-negative intermediate monocytes (164.7 cells per microliter) (bottom left).
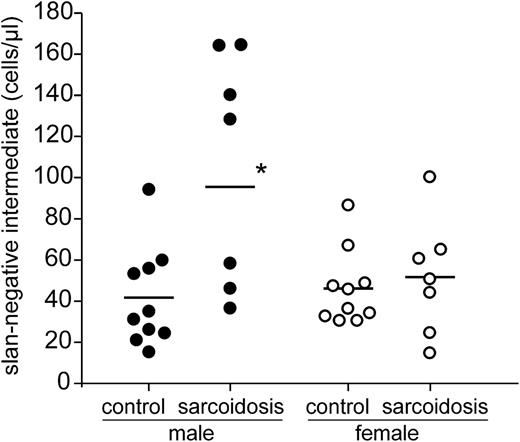
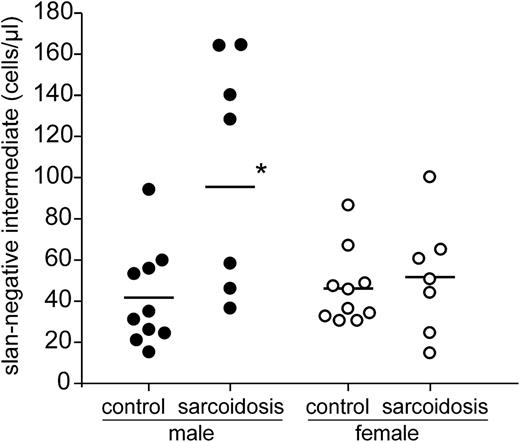
Analysis of 14 patients demonstrates increases of the slan-negative intermediate monocytes to >100 cells per microliter in 5 patients (Figure 5). Of these 5 cases, 4 were male and 1 was female. When looking at the entire group of male sarcoidosis patients (Table 1, n = 7), the intermediate monocytes defined via slan negativity gave clearly higher average values (95.7 ± 55 cells per microliter) compared to the intermediate monocytes defined on the basis of CD14 expression level (56.0 ± 32.2 cells per microliter). The male cases with high values of slan-negative intermediate monocytes (>100 cells per microliter) all had increased levels of the soluble interleukin 2 receptor (>710 U/mL), but given the small sample size, the correlation was not significant (P = .071, Spearman linear correlation test).
Absolute number of slan-based intermediate monocytes in sarcoidosis. Shown are the values for male and female control subjects and sarcoidosis patients as determined in whole blood by flow cytometry using absolute counting beads. *P < .05.
Absolute number of slan-based intermediate monocytes in sarcoidosis. Shown are the values for male and female control subjects and sarcoidosis patients as determined in whole blood by flow cytometry using absolute counting beads. *P < .05.
In looking at nonclassical monocytes, there was a trend in male sarcoidosis patients toward an increase of these cells when defined via CD14 density (a mean of 87.3 cells per microliter vs 48.1 cells per microliter in control subjects); when defined via slan-expression, the nonclassical monocytes did not show any rise (a mean of 36.8 cells per microliter vs 36.8 cells per microliter in control subjects) (Table 1).
These data show that the use of slan for subset definition in sarcoidosis reveals a selective expansion of intermediate monocytes, whereas nonclassical monocytes remain unchanged.
Impact of M-CSF-R mutation on monocyte subsets
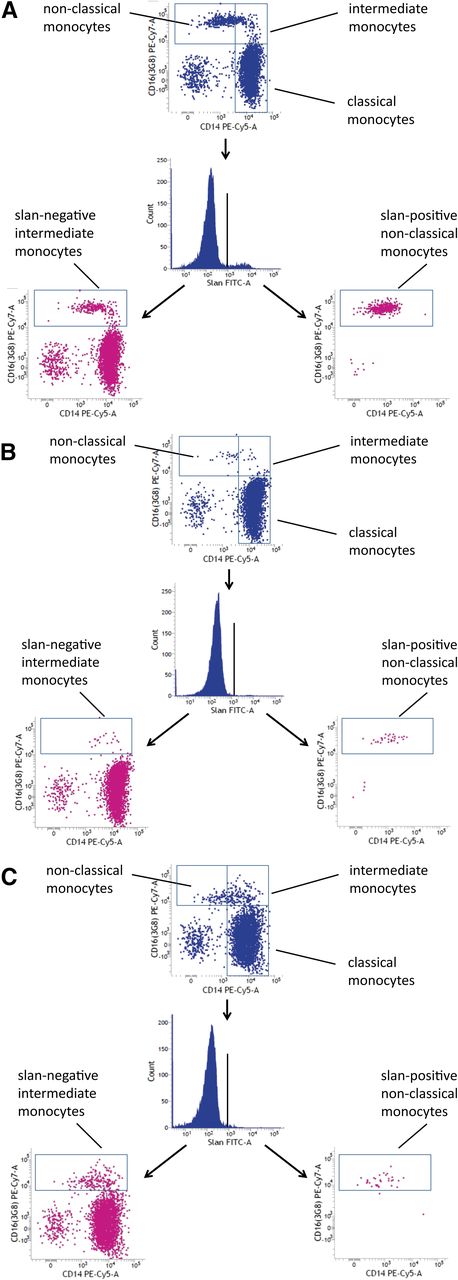
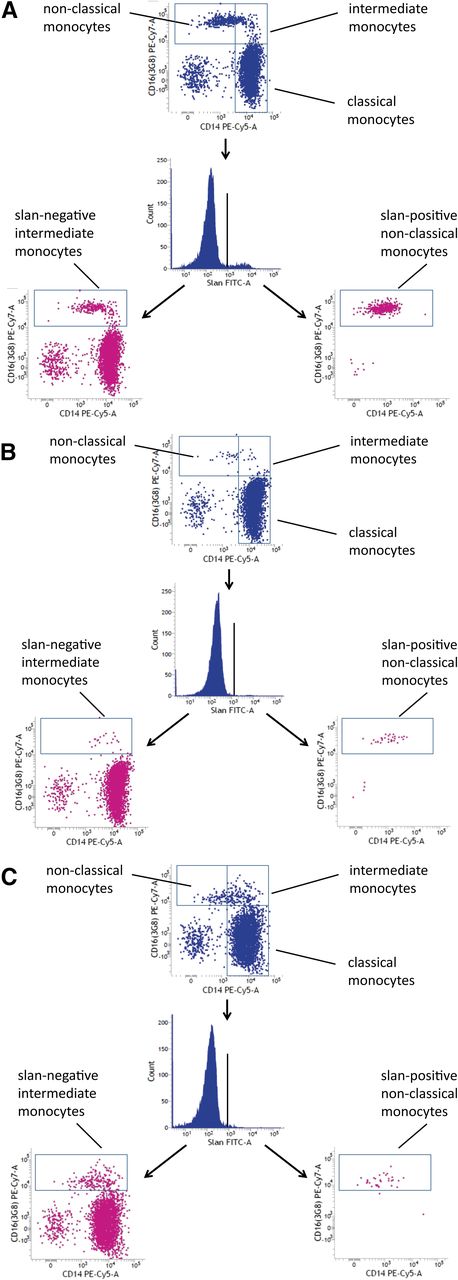
M-CSF is crucial to the development of monocytes and macrophages, as has been demonstrated in mutant mouse models that show reduced numbers and function of these cells.24 Mutations of the human M-CSF-R gene have only recently been reported in patients with the late-onset neurodegenerative disease HDLS.17 We wondered whether blood monocyte subsets might be altered in these patients. As shown in Figure 6, in case 667 with the c.2342C>T, p.A781V M-CSF-R, there is a strong reduction of both nonclassical slan-positive monocytes and intermediate slan-negative monocytes (compare case 667 in Figure 6B to control subject in Figure 6A).
CD16 monocyte subsets in HDLS. (A) Control subject 665. (B) HDLS case 667. (C) HDLS case 745. The slan-positive nonclassical monocytes are depleted in every HDLS case.
CD16 monocyte subsets in HDLS. (A) Control subject 665. (B) HDLS case 667. (C) HDLS case 745. The slan-positive nonclassical monocytes are depleted in every HDLS case.
The other carriers of M-CSF mutations also showed a strong reduction of nonclassical monocytes, but the intermediate monocytes appeared unaffected (see case 745 in Figure 6C and Table 1). As shown in Table 1, the depletion of nonclassical monocytes was less apparent when these cells were defined via CD14 rather than differential slan expression.
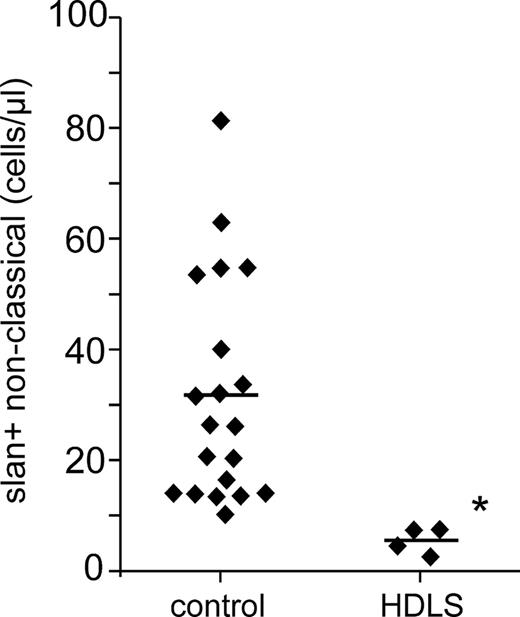
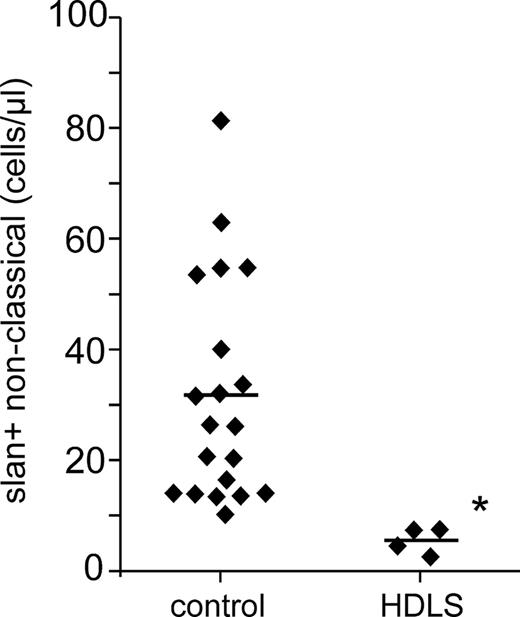
The absolute numbers for the slan-positive nonclassical monocytes in HDLS cases compared to healthy control subjects are summarized in Figure 7, which illustrates the strong depletion of these cells in HDLS. All 4 cases had different mutations in the cytoplasmic part of the M-CSF-R, which may affect the clinical presentation and the degree of monocyte subset depletion. However, the slan-positive nonclassical monocytes are the most sensitive and are decreased by all of the 4 mutations studied herein.
Absolute number of slan-positive nonclassical monocytes in HDLS. Shown are the absolute numbers for the 4 HDLS cases and controls (n = 20) as determined in whole blood by flow cytometry using absolute counting beads. *P < .05.
Absolute number of slan-positive nonclassical monocytes in HDLS. Shown are the absolute numbers for the 4 HDLS cases and controls (n = 20) as determined in whole blood by flow cytometry using absolute counting beads. *P < .05.
Discussion
The nomenclature proposal for monocyte subsets, published in 2010,10 has enabled clearer communication in the field, and with the definition of intermediate monocytes in that article, a host of publications followed with regard to the prevalence of intermediate monocytes in various disease states (see Wong et al13 for review). However, the dissection of intermediate monocytes from the nonclassical monocytes is still a matter of debate because setting a cutoff in the CD14 vs CD16 dot plot at a selected CD14 level often appears arbitrary and can vary between studies. To resolve this issue, it has been suggested to use an additional marker that would reliably separate the intermediate monocytes from the nonclassical monocytes. It had been shown earlier that the slan marker is expressed on CD16 monocytes with very low CD14,25,26 but this molecule has not been tested for its suitability as a marker for definition of nonclassical monocytes. Our data show that slan can be used for this purpose because it clearly distinguishes slan-positive and slan-negative subsets of the CD16-positive monocytes (Figure 1). Using the slan approach instead of the CD14 approach, many more cells are assigned to intermediate monocytes than to nonclassical monocytes such that the absolute number of slan-negative intermediate monocytes is higher compared to nonclassical monocytes (Table 1). Hence, with the slan approach, a monocyte subpopulation previously thought to be a minor population becomes a sizable subset.
The slan-based definition, in common with the CD14-based definition, has identified DEGs related to antigen presentation, which is in line with earlier reports that have shown a higher expression of these genes in intermediate monocytes.11,12 In addition, the slan-based definition of nonclassical and intermediate monocytes has uncovered an unique UBC signature (Figure 2C). Ubiquitination has various roles within the cell and impacts protein degradation, intracellular trafficking, and signal transduction.27 For the slan-defined nonclassical and intermediate monocytes, there were many DEGs interacting with UBC that are, in fact, involved in signal transduction. This finding indicates that the slan-marker can define subsets of CD16-positive monocytes with a distinct biological repertoire.
Analysis of monocyte subset gene expression has been done in the past using microarray and SuperSAGE (a variant of serial analysis of gene expression [SAGE]) technologies.11,12,28,29 For the present study, we have used the highly sensitive MACE approach for determination of the transcriptome.22 When comparing the present results to the previous SuperSAGE approach,11 we found a similar gene expression pattern for monocyte subsets. However, due to the higher sequencing depth in the present study, we detected additional DEGs, which included the mitochondrial genes MT-ND1 and MT-ND5 (supplemental Table 4). As expected, we also found expression of the CD16a gene in the intermediate and nonclassical monocytes at a similar level for these 2 subsets (data not shown). For CX3CR1, however, slan-positive nonclassical monocytes had a significantly higher expression level (717 tpm) than the slan-negative intermediate monocytes (560 tpm; supplemental Table 3A), whereas classical monocytes show a low level expression of this gene (255 tpm).
slan was originally described as a marker of DCs, although the slan-positive cells were shown to have monocyte morphology.30 Although some studies maintain that the slan-positive cells are DCs, it was shown early on that slan-positive cells overlap with the CD16-positive monocytes.15,25 The assignment of the slan-positive cells to monocytes rather than to DCs is also underlined by the expression of this marker on typical macrophages (ie, on alveolar macrophages harvested from the lung).25
Also, slan-positive cells were shown to have properties similar to the CD16-positive monocytes (ie, they show high levels of tumor necrosis factor production)31 and are CCR2-negative.15
It has clearly been shown previously that the CD16-positive monocytes cocluster with monocytes and not with DCs.29,32,33 Still, one could hypothesize that the slan-positive subset of the CD16-positive monocytes might have a gene expression pattern matching that of DCs. Evidence supporting the concept that slan-positive cells and DCs are distinct has been published earlier, in that TLR3, -4 and -10 transcripts did show a reciprocal expression pattern in slan-positive cells and DCs.34 In the comprehensive approach taken herein, we compared the transcriptome of monocyte subsets and CD1c+ blood DCs in unsupervised hierarchical clustering. This approach demonstrated that the slan-positive CD16-positive cells coclustered with monocytes and not with CD1c DCs (Figure 3). Hence, the slan-positive nonclassical cells appear to represent bona fide monocytes and not DCs.
Consistent with this conclusion is the expression of the M-CSF-R in these cells, in that classical monocytes had a low level of CD115 transcripts (459 tpm), intermediate monocytes had higher levels (1349 tpm), and slan-positive nonclassical monocytes had the highest levels (1513 tpm) (false discovery rate <10e-20 for all comparisons). Analysis of cell surface expression of the CD115 M-CSF-R demonstrated a mean ± SD level of specific fluorescence intensity of 706.2 ± 422.4 channels for classical monocytes, a 2.5-fold higher mean ± SD level for intermediate monocytes (1754.8 ± 848.7 channels; P > .05 compared to classical monocytes), and a threefold higher mean ± SD level for nonclassical monocytes (2106.2 ± 624.4 channels; P < .05 compared to classical monocytes, P > .05 compared to intermediate monocytes). These findings suggest that the CD16-positive monocyte subset may be more responsive to the effects of M-CSF.
Among the DEGs for nonclassical vs intermediate monocytes, we found several signaling molecules that act downstream of the M-CSF-R.35 These include the lyn and dusp5 genes, which show higher expression in nonclassical monocytes and thus may contribute to a more efficient M-CSF signal transduction.
The slan cell surface marker can be induced by M-CSF plus granulocyte monocyte colony-stimulating factor in vitro.36 The question is whether these cytokines initiate a differentiation program that includes upregulation of slan, or whether this is a direct effect of the cytokines on the regulation of the slan marker. The slan residue can be added to P-selectin glycoprotein ligand by a 6-O-sulfotransferase, specifically by carbohydrate (N-acetylglucosamine-6-O) sulfotransferase 2.37 Of note, carbohydrate (N-acetylglucosamine-6-O) sulfotransferase 2 transcripts are differentially increased in nonclassical monocytes as compared to intermediate monocytes (supplemental Table 3A, common slan CD14). Whether the induction of the slan marker by M-CSF plus granulocyte–M-CSF occurs via induction of this enzyme is currently unknown.
An increase in CD16 monocytes in sarcoidosis patients has been noted previously.8,16 With the recent further subdivision of the CD16-positive monocytes into nonclassical and intermediate monocyte populations, we asked which of these subsets is responsible for the expansion in sarcoidosis. Here, we have shown that only the slan-negative intermediate monocytes, and not the slan-positive nonclassical monocytes, are expanded in these patients. In our study, we noted 4 of 7 sarcoidosis cases with increased slan-negative intermediate monocytes among males as compared to 1 of 7 among females. Although this finding might suggest a gender effect, additional studies with higher numbers of cases are required to resolve the question of whether females show less of an expansion of slan-negative intermediate monocytes in sarcoidosis.
Sarcoidosis is a systemic inflammatory disease affecting various tissues in the body, most frequently with manifestations in the lung.38 Depending on the degree of inflammation, serum parameters like C-reactive protein and soluble interleukin 2 receptor are increased in these patients39-43 ; such increases were observed in some, but not all, of the patients herein (Table 2).
Although activated macrophages have been described in the lungs of sarcoidosis patients,39,44,45 the role of monocytes, especially of the expanded intermediate blood monocytes, remains unclear.
On the basis of intravital microscopy in a mouse model, nonclassical monocytes have been described to rapidly migrate into tissue in response to inflammatory stimuli.46 Also, recent studies in a murine model of arthritis have shown that Ly6Clow monocytes can migrate into joint tissue and drive inflammation.47 Similar studies on migration into tissue for intermediate monocytes are lacking, but we speculate that in sarcoidosis, these expanded, slan-negative intermediate monocytes with their proinflammatory repertoire will migrate into the various tissues, develop into macrophages, and contribute to the granulomatous inflammation.
The data for the M-CSF-R mutant HDLS patients show that both subsets of CD16-positive monocytes are under the control of the M-CSF signaling pathway. The slan-positive nonclassical monocyte subset was most sensitive to a disruption of this pathway because these cells were reduced in every patient, whereas the intermediate monocytes were clearly reduced in only 1 case. Of note, although slan-positive nonclassical monocytes were reduced in HDLS, the numbers for CD1c+, CD141+, and CD303+ DCs were similar to those in control subjects (data not shown). This finding further supports the contention that slan-positive nonclassical monocytes are independent of the DC lineage.
All 4 HDLS patients had a different single nucleotide mutation in the cytoplasmic part of the M-CSF-R gene (Table 3). HDLS case 667 with the strongest decrease of CD16-positive monocytes had a mutation within the tyrosine kinase domain of the receptor, but case 766, with a decrease of nonclassical monocytes only, had a mutation within the same domain. In any event, it appears that different mutations can lead to different levels of depletion of nonclassical slan-positive monocytes, and we suggest that the flow cytometric determination of this monocyte subset can be used as a measure of the degree of impairment of receptor function in vivo. Also, it remains to be determined whether the depletion of nonclassical blood monocytes, which can be seen early in life in the absence of neurologic symptoms (Table 3, case 667), plays a role in the pathophysiology and in the progression of disease manifestation in the brain.
Taken together, our results show that the dissection of the CD16-positive monocytes into a slan-negative intermediate monocyte subset and a slan-positive nonclassical monocyte subset reveals a differential gene expression pattern with an ubiquitin signal transduction signature. Using the slan approach, we show that slan-negative intermediate monocytes are increased in sarcoidosis and that slan-positive nonclassical monocytes are depleted in HDLS. It remains to be shown whether the slan-approach can define distinct roles of the 2 CD16-positive monocyte subsets in other diseases.
The online version of this article contains a data supplement.
The publication costs of this article were defrayed in part by page charge payment. Therefore, and solely to indicate this fact, this article is hereby marked “advertisement” in accordance with 18 USC section 1734.
Acknowledgment
Part of the work performed by A.M.Z. was supported by a grant from the Else Kroener-Fresenius-Stiftung.
Authorship
Contribution: T.P.H. and A.M.Z. performed the research, analyzed the data, and wrote the paper; M.F. performed the research and analyzed the data; K.S. performed the research; A.A.S., W.G., M.S., J.L., and A.D. identified appropriate patients and contributed vital research samples; B.R. performed the experiments and analyzed the data; G.H.H. designed the study and analyzed the data; and L.Z.-H. designed the study, performed the experiments, analyzed the data, and wrote the paper.
Conflict-of-interest disclosure: L.Z.-H. has received personal fees for consultancy outside this work from Five Prime Therapeutics, San Francisco, CA. The remaining authors declare no competing financial interests.
Correspondence: Loems Ziegler-Heitbrock, The EvA Study Center, Robert-Koch-Allee 1, 82131 Gauting, Germany; e-mail: lzh@monocyte.eu.

