Key Points
RNA-seq identified thousands of changes in alternative gene isoform expression changes during erythropoiesis.
MBNL1 regulates alternative splicing in terminal erythropoiesis.
Abstract
The scope and roles of regulated isoform gene expression during erythroid terminal development are poorly understood. We identified hundreds of differentiation-associated isoform changes during terminal erythropoiesis. Sequences surrounding cassette exons of skipped exon events are enriched for motifs bound by the Muscleblind-like (MBNL) family of splicing factors. Knockdown of Mbnl1 in cultured murine fetal liver erythroid progenitors resulted in a strong block in erythroid differentiation and disrupted the developmentally regulated exon skipping of Ndel1 mRNA, which is bound by MBNL1 and critical for erythroid terminal proliferation. These findings reveal an unanticipated scope of the alternative splicing program and the importance of Mbnl1 during erythroid terminal differentiation.
Introduction
Terminal erythroid differentiation is characterized by 4 to 5 terminal cell divisions accompanied by hemoglobinization, a decrease in cell size, chromatin condensation, and finally expulsion of the nucleus and other organelles. Previous studies have primarily focused on the roles of intracellular signal transduction proteins, transcription factors, and chromatin modifiers in erythropoiesis.1,2 The roles of alternative mRNA isoforms and associated regulatory factors in terminal erythroid differentiation are not well established, but an understanding of these could shed light on erythroid developmental biology.3-5
Differential joining of exons in mRNAs via alternative splicing can substantially alter the functions of the corresponding encoded proteins.6 One classical example of regulated pre-mRNA splicing during erythroid development is the splicing switch of exon 16 in the mRNA encoding the cytoskeletal protein 4.1R (band 4.1). The inclusion of exon 16 in late erythroblasts enhances the affinity of 4.1R protein for spectrin and actin, thereby stabilizing the erythroid membrane under mechanical stress.7-9 It is likely that there are other stage-specific splicing changes crucial for modifying protein functions in erythropoiesis. Previous studies used exon microarrays to identify a handful of novel splicing events and alternative choices of first exons in human erythroid cells, but the scope of analysis was limited by the availability of probes.10 Recent genome-wide analyses of alternative isoform gene expression using RNA-seq have revealed large-scale splicing differences between mammalian tissues, cell, and disease states,11-13 but similar comprehensive studies have not been performed in the context of erythroid differentiation.
The Muscleblind-like (MBNL) family of sequence-specific pre-mRNA splicing factors bind RNA through pairs of highly conserved zinc fingers, recognizing YGCY (where Y = C or U) and similar motifs.14-18 MBNL proteins are predominantly expressed in skeletal muscle, neuronal tissues, thymus, liver, and kidney and are important for terminal differentiation of myocytes and neurons.19 Mbnl1 transcripts themselves undergo extensive alternative splicing, generating a variety of protein isoforms. The inclusion of the highly conserved exon 5 during differentiation of heart and muscle tissues is important for nuclear localization and splicing activity of the MBNL1 protein.20,21 Perturbation of MBNL1 is associated with myotonic dystrophy (DM), resulting in cataract formation, abnormal muscle relaxation, heart and nerve dysfunction, and other pathologies.22,23 The function and expression of MBNL1 in the erythroid lineage is not known.
Materials and methods
Bioinformatics analysis of alternative isoforms and motif analysis
RNA-seq was performed previously.24 Splicing analysis was based on read density supporting either isoforms of an alternative splicing event from a database of alternative isoform events as previously described.11 Motif analysis was performed on alternative splicing sites against a background pentamer (5mer) distribution generating from first-order Markov model derived from nucleotide frequencies of all events with a false discovery rate (AS) <0.05 and ΔΨ > 0.1 and ΔΨ < −0.1.
Plasmids for short hairpin RNA expression and for expression of Ndel and Mbnl1 ectopic expression
The target sequences of short hairpin RNAs (shRNAs) are as follows: shMbnl1-1, TGACAGCACAATGATTGATAC; shMbnl1-2, GCCTGCTTTGATTCACTGAAA; shNdel1-1, GGACTCTGCGCGATATCAATA; shNdel1-2, GCCGTTGGTTTCACATGATTG; and shNdel1-3, GCTGTGCTGATAGGATTTAGT. The sequence for the shMbnl1 inclusive isoform is TGCCATGACTCAGTCGGCTGTCAAA. The sequence for the shMbnl1 exclusion isoform is GCAGCTGCCATGGGAATTCCTCAA The shRNA was designed and cloned as previously described.25
The two Ndel1 splicing isoforms and the Mbnl1 exclusion isoform were cloned into the murine stem cell virus vector upstream of the internal ribosome entry site followed by a gene encoding DsRed.
Retrovirus production
Six million 293T cells were plated 1 day before transfection in antibiotic-free Dulbecco's modified Eagle medium with 15% fetal bovine serum (FBS) and 2 mM l-glutamine (Invitrogen). On day 1, 10 µg plasmid and 5 µg packaging vector were transfected to 293T cells using Fugene 6 (Promega). Six hours later, Dulbecco's modified Eagle medium with 15% FBS, 2 mM l-glutamine (Invitrogen), and 1× Pen Strep (Invitrogen) replaced the medium of 293T cells. Fresh virus-containing supernatant was collected after overnight culture.
Mouse fetal liver erythroid progenitor purification, retrovirus infection, and in vitro culture
Erythroid progenitor cells in mouse embryonic (E)14.5 fetal liver cells were enriched by magnetic depletion of multiple lineage cells using the Biotin Mouse Lineage Panel (BD 559971).26 Enriched erythroid progenitors were infected by retroviruses at a density of 100 000 cells/mL, followed by 32°C spin infection for 1 hour. After spin infection, the virus solution was substituted by erythroid maintenance medium (StemSpan-SFEM; Stem Cell Technologies) with added recombinant mouse stem cell factor (100 ng/mL stem cell factor; R&D), recombinant mouse insulin-like growth factor-1 (40 ng/mL; R&D), and dexamethasone (100 nM; Sigma) and cultured overnight for recovery and expression of foreign genes.27 The next morning, the green fluorescent protein (GFP)+ cells (or the GFP and DsRed double-positive cells for rescue experiments) were sorted and cultured in Epo-only erythroid differentiation medium (Iscove modified Dulbecco's medium containing 15% FBS [Stemcell], 1% detoxified bovine serum albumin [Stemcell], 500 μg/mL holo-transferrin [Sigma-Aldrich], 0.5 U/mL Epo [Amgen], 10 μg/mL recombinant human insulin [Sigma-Aldrich], 2 mM l-glutamine [Invitrogen], and 1× Pen Strep [Invitrogen]) for 2 or 3 days before analysis.
Flow cytometry analysis and sorting
The cells were stained with propidium iodide, allophycocyanin (APC)-conjugated Ter119, phycoerythrin-conjugated CD71, and Hoechst and followed by flow cytometry analysis (BD LSR flow cytometer).25 Apoptosis assay was performed by simultaneous staining of annexin V and 7-aminoactinomycin D. If needed, sorting of GFP+ cells was performed on a BD fluorescence-activated cell sorter (FACS) Aria Cell Sorter.
May-Grünwald Giemsa staining
Approximately 20 000 GFP-sorted in vitro cultured erythroid cells were cytospinned onto a poly-lysine–coated slide. Standard May-Grünwald Giemsa staining was carried out.27
Polymerase chain reaction and western blot
In vitro cultured erythroid cells were collected and lysed using QIAzol (Qiagen). RNA including microRNA was extracted using a miRNeasy Mini kit (Qiagen). For mRNA quantitative reverse-transcriptase-polymerase chain reaction (qRT-PCR), reverse transcription was carried out using SuperScript III Reverse Transcriptase (Invitrogen). Real-time PCR was performed using SYBR Green PCR Master Mix (Applied Biosystems) on a 7500 Real-Time PCR System (Applied Biosystems). The PCR primers for erythroid important genes were published previously.25 The primers for MBNl1, Mbnl2, and other splicing isoforms are listed in supplemental Materials, available on the Blood Web site.
For western blots, in vitro cultured erythroid cells were collected and lysed in buffer containing 150 mM sodium chloride; 1.0% NP-40 or Triton X-100; 0.5% sodium deoxycholate; 0.1% sodium dodecyl sulfate; and 50 mM Tris (pH 8). MBNL1 [Santa Cruz: 3A4 or DHSB: MB1a(4A8)] antibody was used at a dilution of 1:200.
RNA immunoprecipitation
The immunoprecipitation was carried out as described previously with the following modifications. Ten million fetal liver progenitor cells at E14.5 were lysed in buffer (100 mM KCL, 5 mM MgCl2, 10 mM N-2-hydroxyethylpiperazine-N′-2-ethanesulfonic acid [pH 7.0], 0.5% NP40, 1 mM dithiothreitol, 100 U/mL RNaisin [VWR], and EDTA-free complete protease inhibitor mixture) (Roche). The lysate was frozen in liquid nitrogen. After thawing, the lysate was spun at 13 000 rpm at 4°C for 30 minutes. Fragmentation of RNA samples was done by sonication for 2 cycles at 40% amplitude for 30 seconds to a size of ∼200 to 500 bp. Ten micrograms of mouse anti-Mbnl1 antibody (3A4; Santa Cruz) or mouse IgG was conjugated to Dynabeads Protein G beads (Invitrogen). The beads were added in 0.5 mL cell lysate and incubated for 4 hours at 4°C. The beads were washed 5 times using NT2 buffer (50 mM Tris-HCl, pH 7.5, 150 mM NaCl, 0.05% NP-40, and 1 mM MgCl2). The proteins were eluted and run on the gel for detection of Mbnl1 to confirm the specificity of the immunoprecipitation. Immunoprecipitated RNAs were recovered using RNAzol RT (Molecular Research Center). RNA was then reverse transcribed with Superscript III (Invitrogen) using random hexamer primers. The resulting cDNA was then amplified using primers flanking Mbnl1-binding sites of Ndel1. A region of enriched Mbnl1 binding clusters next to the mitochondrial fission factor (Mff)-regulated exon was also identified in the cross-linking immunoprecipitation (CLIP)-seq data. However, we could not detect any Mff mRNA fragment in the MBNL1-immunoprecipitated RNA in erythroid cells (data not shown). Because our protocol does not involve cross-linking of RNA to protein, transient and weaker binding could be undetected under our experimental conditions. Alternatively, MBNL1 could bind to different pre-mRNA regions in erythroid cells and in nonhematological tissues. A comprehensive scanning of the intronic regions may allow identification of the MBNL1 binding site in Mff1 mRNA in erythroid cells.
Bichromatic reporter assay in HEK293T cells
The ATG-NLS-XbaI-AgeI-dsRed-GFP cassette was amplified from RG6 and cloned into the pCR8GWTOPO gateway donor vector (Invitrogen) to make the pCR8GWTOPO-RG6 vector. The XbaI site on the backbone of pCR8GWTOPO was removed by XbaI digestion, blunt ending, and religation, whereas the XbaI on the RG6 cassette was protected by bacterial methylation. This creates the pCR8GWTOPO∆BBX-RG6 vector, which was retransformed and reisolated from dam−/dcm−Escherichia coli (New England Biolabs). The Ndel1 minigene was cloned into the XbaI-AgeI site of the reporter cassette by a 3-way ligation of the XbaI,AgeI-digested pCR8GWTOPO∆BBX-RG6 vector, a fragment amplified from mouse genomic DNA using forward primer 5′ CCAGGAACTAGTACTTCCATAAAGGGTAAGTCCTTGAC 3′ and reverse primer 5′ AACACTCTCGAGAGCCAATCCATAAAAG 3′ and digested by SpeI, XhoI, and a fragment amplified from mouse genomic DNA using forward primer 5′ CTTTTATGGATTGGCTCTCGAGAGTGTT 3′ and reverse primer 5′ AAAAAAACCGGTCCTGCCCTGTGGGGTGACCAG 3′ digested by XhoI and AgeI. To construct the reporter construct with Mbnl1 sites in region 2 mutated, a 3-way ligation was performed on the abovementioned vector with a fragment amplified from the wild-type clone by forward primer 5′ CCAGGAACTAGTACTTCCATAAAGGGTAAGTCCTTGAC 3′ and reverse primer 5′ GAACGGATCCGACATGTGTGTGATCAAGTCATCGTGATGGTAATCAAGTCAAACAGGGTC 3′ and digested by SpeI and BamHI, and a fragment amplified from the wild-type clone forward primer 5′ CACACATGTCGGATCCGTTCTAGAACAATAGCCCATCAGGAGTTG 3′ and a reverser primer 5′ AAAAAAACCGGTCCTGCCCTGTGGGGTGACCAG 3′ and digested by BamHI,AgeI. The Mbnl1 construct with exon 5 was synthesized (Integrated DNA Technologies) with synonymous code changes to confer resistance to an shRNA targeting endogenous Mbnl1 exon 5. The Mbnl1 coding sequence was amplified and cloned into the pCR8GWTOPO gateway donor vector. Likewise, the coding sequence for firefly luciferase (the control gene) was cloned into the donor vector. The reporters were recombined onto the gateway destination expression vector PB/puro-EF1a-DEST, and the test genes (Mbnl1 or Luciferase control) were recombined onto expression vector PB/neo-EF1aDEST by LR Clonase reaction (Invitrogen). The reporter vector, test gene vector, and mPBase vector (1:1:1) were transfected into HEK293T cells with XtremeGene 9. The cells were assayed for fluorescent microscopy and FACS sorting analysis 4 days after transfection.
Subcellular fractionation of erythroid cells
Liver cells were isolated from E14.5 murine embryos and an ammonium chloride solution (Stemcell) was used to lyse mature red blood cells and reticulocytes. The remaining fetal liver cells were washed twice with phosphate-buffered saline. Ten to 20 million cells were pooled and subjected to cell fractionation. This was accomplished using the PARIS Kit from Life Technologies following the manufacturer’s protocol.
Bioinformatic analysis of the coding effects
For each event type, the exon (eg, cassette exon of skipped exon [SE] events) that can result in different coding sequences between the inclusion and exclusion isoforms was matched against a translated protein database using the AceView annotation. Then those that overlap a region of open reading frames of the translated proteins were tested for a coding fragment overlapping the whole exon (complete overlap). Those that do not completely overlap were tested for whether they contained an in-frame stop codon ≥50 bp away from the downstream exon-exon junction (a commonly used criterion for identifying subtract of nonsense-mediated decay).28 Those that were completely overlapped by open reading frames were further subjected to 2 kinds of analysis. Domain overlap analysis was performed by overlapping the exon with domain annotation in the AceView database. 3n analysis was performed to identify exons that induce a differential reading frame in the downstream exons by testing whether the exon length is a multiple of 3, the length of a codon.
Results
Global analysis of alternative isoforms during murine erythroid differentiation
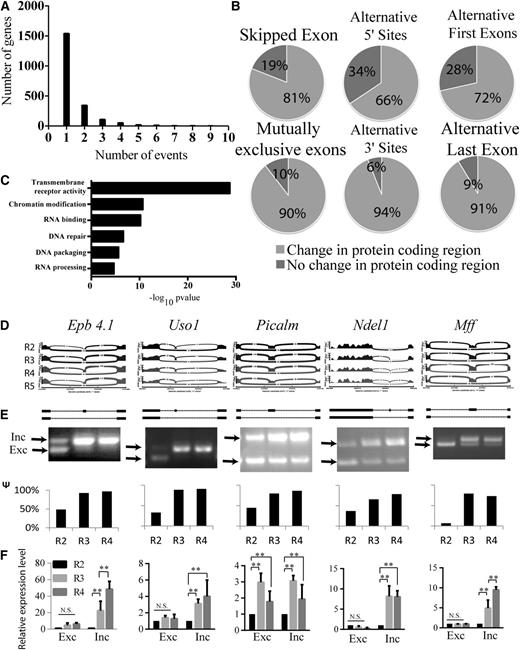
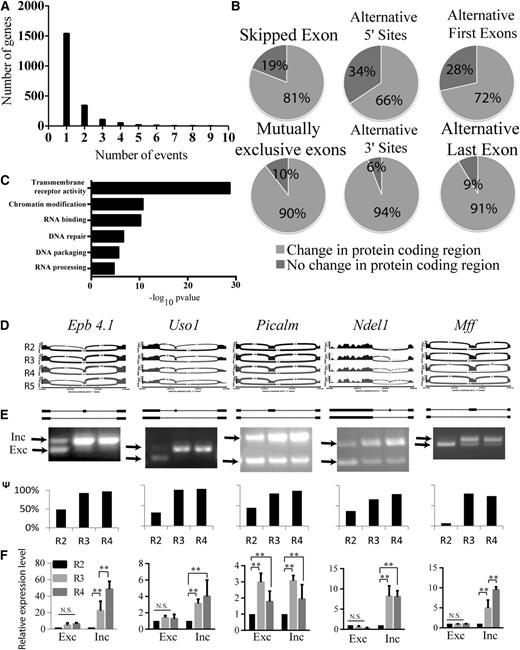
We analyzed global alternative exon use in the mouse fetal liver erythropoiesis system with 90% enrichment of erythroid cells. E14.5 fetal liver cells were sorted using CD71 (transferrin receptor protein) and TER119 (moiety of glycophorin A) markers into R1 to R5 stages, representing erythroid cells at progressive stages of terminal differentiation27 (supplemental Figure 1A). A well-characterized splicing event during erythroid differentiation is the inclusion of exon 16 in 4.1R mRNA in late erythroblasts. We performed semiquantitative RT-PCR assays to confirm that exon 16 was mostly excluded in early erythroblasts (R2 cells) and became included at the R3 stage (Figure 1D-F, column 1). It is during the R2 to R3 transition that ∼400 erythroid-important genes are strongly induced.24 This result validated the use of our sorting strategy for analysis of stage-specific splicing changes during erythropoiesis. Previously, we performed high-throughput sequencing on cDNAs generated from polyadenylated RNA isolated from the sorted cells.24 We analyzed alternative splicing events including SEs, mutually exclusive exons (MXEs), alternative 5′ and 3′ splice sites (A5SS and A3SS), and alternative last exons (ALEs), as well as alternative first exons (AFEs) that result from alternative promoter initiation (Table 1). A set of ∼53 000 events was derived from the AceView gene annotations, and the fraction of mRNAs that contained an alternative exon was quantified by the percent spliced in (PSI or Ψ) value, which was estimated by the ratio of the density of inclusion reads to the sum of the densities of inclusion and exclusion reads.29 Of the SE and MXE events where both isoforms were detected (2736), about a quarter (635) showed a change in Ψ value (ΔΨ) >10% (|ΔΨ| > 10%) from R2 to R3, R4, or R5 (Table 1). About 2500 other alternative isoform events exhibiting a Ψ value change >10% were also identified (Table 1). Alternative isoform gene expression mainly affects protein coding sequences of genes (Figure 1A) that perform diverse functions as revealed by gene ontology (GO) analysis (Figure 1C). These include transmembrane receptor activity, chromatin modification, RNA binding and processing, and DNA repair, as well as DNA packaging. Chromatin modifications have been shown to be important events during terminal erythropoiesis.24 DNA packaging is presumably required for the condensation and the ultimate removal of the nucleus in the last stage of erythropoiesis. The enrichment for RNA binding factors suggests a significant involvement of post-transcriptional gene regulation in erythropoiesis.
Alternative mRNA isoforms identified by RNA-seq analysis during the critical transition of terminal erythroid differentiation. (A) Distribution of the number of significant isoform events per genes comparing R2 with all following stages of erythropoiesis. (B) Pie chart showing the proportion of isoform changes affecting amino acid sequences in the 6 different classes of gene isoform expression events. (C) Statistically significant GO terms of genes with protein coding changes due to alternative isoforms. (D) Sashimi plots53 of the events showing exonic reads and junctional reads of the exon trios of the indicated SE events from (top to bottom) R2 to R5. The height of the wiggles in the exons depicts the log2 RPKM of reads covering those positions. Arcs connecting exon boundaries represent junctional reads that align the 2 connecting exons. The thickness of the arcs is proportional to the number of corresponding junctional reads. (E) Semiquantitative isoform RT-PCR analysis of splicing events in R2 proerythroblasts and late erythroblasts (R3 and R4) isolated from fetal livers at E14.5. Arrows mark the inclusion product (top band) relative to the exon-skipping product (bottom band). The bar graphs below the gel images show percentages of the included isoform (Ψ value) as quantified from the relative intensities of the inclusion and exclusion bands. (F) Quantitative RT-PCR determination of the absolute levels of expression of the inclusion and exclusion isoforms. **Significance (P < .01). N.S., nonsignificant.
Alternative mRNA isoforms identified by RNA-seq analysis during the critical transition of terminal erythroid differentiation. (A) Distribution of the number of significant isoform events per genes comparing R2 with all following stages of erythropoiesis. (B) Pie chart showing the proportion of isoform changes affecting amino acid sequences in the 6 different classes of gene isoform expression events. (C) Statistically significant GO terms of genes with protein coding changes due to alternative isoforms. (D) Sashimi plots53 of the events showing exonic reads and junctional reads of the exon trios of the indicated SE events from (top to bottom) R2 to R5. The height of the wiggles in the exons depicts the log2 RPKM of reads covering those positions. Arcs connecting exon boundaries represent junctional reads that align the 2 connecting exons. The thickness of the arcs is proportional to the number of corresponding junctional reads. (E) Semiquantitative isoform RT-PCR analysis of splicing events in R2 proerythroblasts and late erythroblasts (R3 and R4) isolated from fetal livers at E14.5. Arrows mark the inclusion product (top band) relative to the exon-skipping product (bottom band). The bar graphs below the gel images show percentages of the included isoform (Ψ value) as quantified from the relative intensities of the inclusion and exclusion bands. (F) Quantitative RT-PCR determination of the absolute levels of expression of the inclusion and exclusion isoforms. **Significance (P < .01). N.S., nonsignificant.
Experimental validation of computationally predicted splicing changes
To confirm the accuracy of RNA-seq analysis of alternative splicing during terminal erythroid differentiation, we randomly selected 17 SE events in abundantly expressed genes with an FDR <0.05 and |ΔΨ| > 10% for semiquantitative RT-PCR analysis using cDNA from sorted fetal liver cells at the R2, R3, and R4 stages. We observed a high correlation between the ΔΨ values inferred from the RNA-seq data and ΔΨ values deduced from RT-PCR experiments (supplemental Figure 2). Representative RT-PCR analyses of alternative exons in the Uso1, Picalm, Ndel1, and Mff genes are depicted in Figure 1E. The high validation rate observed here supports the reliability of RNA-seq–based splicing inferences.
Evidence for involvement of MBNL1 in global splicing changes
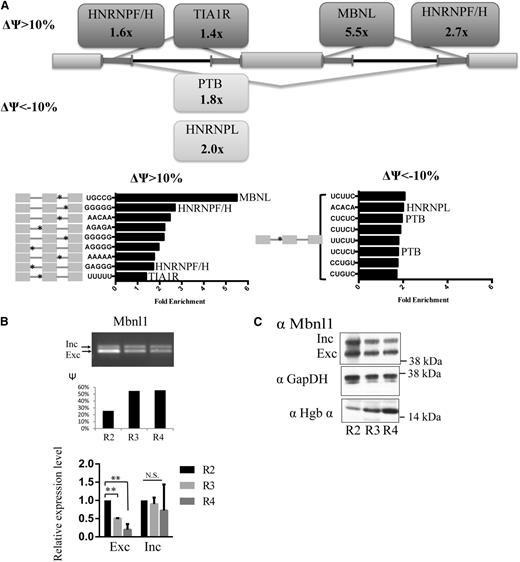
To identify candidate splicing factors involved in global splicing changes in erythropoiesis, we analyzed the occurrence of oligonucleotide motifs in exon trios that underwent regulated alternative SE events during the R2 to R3 transition. As most splicing factors are known to bind short RNA oligomers a few bases long, we focused on pentanucleotides (5mers) that were enriched in regions adjacent to the splice sites involved in the splicing of exons preferentially included or excluded during erythroid differentiation (Figure 2A). This analysis identified a few 5mers enriched in each region, relative to control (unregulated) introns, including 5mers that matched binding motifs for the MBNL family of tissue-specific splicing factors (Figure 2A). Motifs recognized by several heterogeneous nuclear ribonucleoprotein factors including polypyrimidine tract binding protein and heterogeneous nuclear ribonucleoprotein L were also identified. A recent genome-wide study revealed an enrichment of the MBNL motif and binding sites in introns both upstream and downstream of MBNL-regulated exons.30 Therefore, our observation of MBNL motif enrichment downstream of the regulated exons suggested that MBNL proteins binding to these sites regulate inclusion of the cassette exon. By overlapping the regions of alternatively skipped exons and their flanking introns with published MBNL1 CLIP-seq binding clusters,31 we observed a significant enrichment of MBNL1 binding clusters in erythropoiesis-associated SE events (P = 1.8 × 10⁻¹⁰ by the hypergeometric test). Of 497 significantly changed SE events with |ΔΨ| > 10%, 155 (31%) contained MBNL1 binding clusters compared with 3171 (19%) of the 16 285 detectable SE events.
Evidence for the potential role of Mbnl1 in regulating splicing during erythroid differentiation. (A) Pentamer motifs significantly enriched in the 4 flanking 250-nt intronic regions of regulated skipped exons. Rectangular boxes indicate the names of splicing factors with ≥1 known motif enriched at an FDR < 0.05. Bar graphs show the fold enrichment of the pentamer motifs. The asterisks on the gray exon trio on the left denote the location of the motifs. (B) Mbnl1 isoform expression levels during erythropoiesis. Mbnl1 transcript isoform expression level was measured by seminquantitative PCR, and Ψ values were quantified by relative intensities of the inclusion and exclusion bands. The lower bar graph shows qRT-PCR analysis of Mbnl1 inclusion and exclusion isoforms. **Significance (P < .01). (C) Western blot showing the expression the Mbnl1 inclusion and exclusion isoforms during terminal erythropoiesis; western blots of glyceraldehyde-3-phosphate dehydrogenase (GAPDH) and hemoglobin α are included as controls.
Evidence for the potential role of Mbnl1 in regulating splicing during erythroid differentiation. (A) Pentamer motifs significantly enriched in the 4 flanking 250-nt intronic regions of regulated skipped exons. Rectangular boxes indicate the names of splicing factors with ≥1 known motif enriched at an FDR < 0.05. Bar graphs show the fold enrichment of the pentamer motifs. The asterisks on the gray exon trio on the left denote the location of the motifs. (B) Mbnl1 isoform expression levels during erythropoiesis. Mbnl1 transcript isoform expression level was measured by seminquantitative PCR, and Ψ values were quantified by relative intensities of the inclusion and exclusion bands. The lower bar graph shows qRT-PCR analysis of Mbnl1 inclusion and exclusion isoforms. **Significance (P < .01). (C) Western blot showing the expression the Mbnl1 inclusion and exclusion isoforms during terminal erythropoiesis; western blots of glyceraldehyde-3-phosphate dehydrogenase (GAPDH) and hemoglobin α are included as controls.
The Mbnl gene family consists of 3 members: Mbnl1, Mbnl2, and Mbnl3. Mbnl1 is expressed in both fetal and adult erythropoiesis, whereas Mbnl2 is only expressed in adult erythropoiesis, and Mbnl3 was not expressed at a significant level in either fetal or adult erythropoietic cells (supplemental Figure 3A,C).32,33 Our qRT-PCR analysis showed that Mbnl1 was expressed in erythroid tissue (both Ter119-positive and Ter119-negative cells) at levels 5- to 10-fold higher than in epithelial tissues (supplemental Figure 3B). Additionally, Mbnl1 transcript isoforms were differentially expressed during terminal erythroid differentiation through regulated inclusion of exon 5 (Figure 2B-C). The inclusion of this exon was reported to enhance nuclear localization and the splicing activity of MBNL1 protein.20 Given the enrichment of MBNL binding in regulated alternative exons both by pentamer motif analysis and CLIP-seq data overlap, the expression patterns of Mbnl1 in erythroid cells, and its isoform switching during erythropoiesis, we hypothesized that MBNL1 may regulate splicing of many pre-mRNAs during erythroid differentiation.
Knockdown of Mbnl1 impairs erythroid terminal proliferation and differentiation
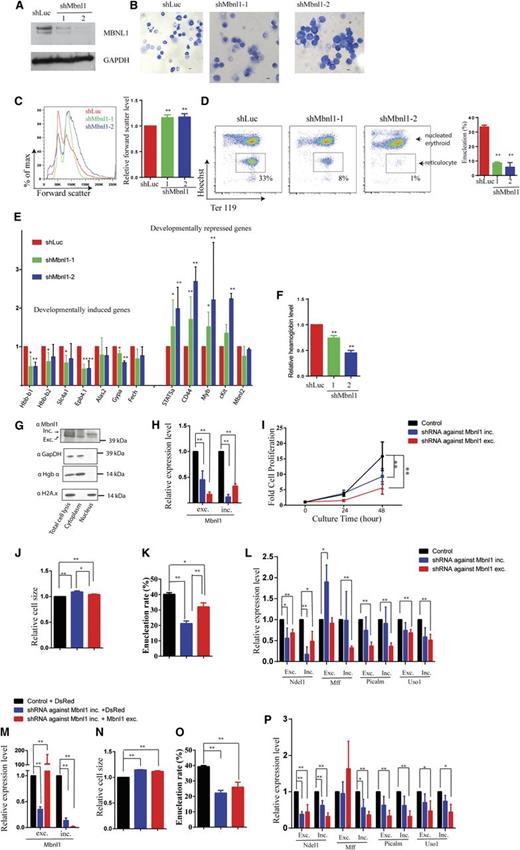
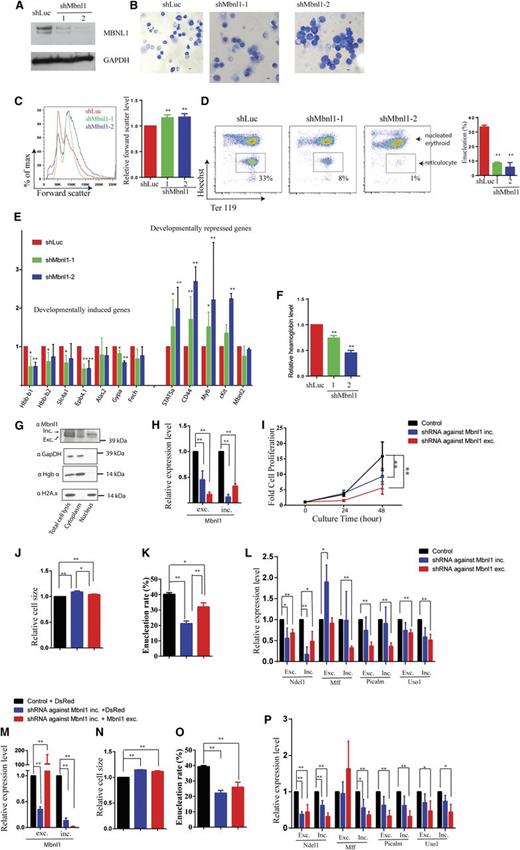
We then used retroviruses expressing GFP and either of 2 independent Mbnl1 shRNA knockdown (shMbnl1-2) constructs, as well as a control luciferase-targeting (shLuc) shRNA, to infect E14.5 mouse fetal liver erythroid progenitor cells. qRT-PCR revealed that Mbnl1 mRNA was significantly depleted in the cells 48 hours after infection with Mbnl1 shRNA viruses (supplemental Figure 2A). Decreased expression levels of both the inclusion and exclusion isoforms (∼44 and ∼42 kDa, respectively) were verified at the end of differentiation (Figure 3A).
Erythroid differentiation is blocked in Mbnl1 knockdown cells and not restored by ectopic expression of the excluded isoform. (A) Western blot analysis of MBNL1 protein from GFP-sorted day 2 cultured cells following expression of shLuc, shMbnl1-1, and shMbnl1-2. GAPDH was used as loading control. (B) May-Grunwald Giemsa staining of GFP-sorted day 2 cultured cells infected with the indicated viruses. Representative images are shown. Scale bar is 10 µm. (C) Cell size measured by forward scatter at day 2 of in vitro culture shown for cells expressing shLuc control (red), shMbnl1-1 (green), and shMbnl1-2 (blue). Bar graph shows the relative forward scatter level of cells treated with the shLuc or shMbnl1 shRNAs. Statistics from 3 experiments are shown. (D) Flow cytometry plots of day 2 in vitro cultured cells stained with Ter119-APC and Hoechst. Boxes denote enucleated cells. Statistics from 3 experiments are shown. (E) RNA expression levels of the indicated genes in GFP-sorted day 2 cultured cells following addition of shRNAs, as determined by qRT PCR. 18s rRNA was used for normalization. Error bar is standard deviation (n = 3). (F) Relative hemoglobin levels in GFP-sorted day 2 cultured cells following addition of the indicated shRNAs (n = 3). (G) Western blot analysis of Mbnl1 subcellular localization in E14.5 murine fetal liver cells. GAPDH and hemoglobin α served as markers for the cytoplasmic fraction, whereas histone 2A.x served as marker for the nuclear fraction. (H) qPCR analysis of the expression levels of the Mbnl1 inclusion and exclusion isoforms after knockdown of the Mbnl1 inclusion isoform. (I) Terminal proliferation of erythroid cells after knockdown of the Mbnl1 inclusion isoform. (J) Cell size of erythroid cells measured by forward scatter after knockdown of the Mbnl1 inclusion and exclusion isoforms. (K) Enucleation of erythroid cells after knockdown of the Mbnl1inclusion and excluded isoforms. (L) qPCR analysis of the expression levels of splicing isoforms of 4 genes after knockdown of the Mbnl1 inclusion and exclusion isoforms. (M) qPCR analysis of the expression levels of the Mbnl1 inclusion and exclusion isoforms after knockdown of the Mbnl1inclusion isoform with or without ectopic expression of the Mbnl1 exclusion isoform. (N) Cell size, (O) enucleation, and (P) qPCR analysis of the expression levels of splicing isoforms of 4 genes of erythroid cells after knockdown of the Mbnl1inclusion isoform with or without ectopic expression of the Mbnl1 exclusion isoform.
Erythroid differentiation is blocked in Mbnl1 knockdown cells and not restored by ectopic expression of the excluded isoform. (A) Western blot analysis of MBNL1 protein from GFP-sorted day 2 cultured cells following expression of shLuc, shMbnl1-1, and shMbnl1-2. GAPDH was used as loading control. (B) May-Grunwald Giemsa staining of GFP-sorted day 2 cultured cells infected with the indicated viruses. Representative images are shown. Scale bar is 10 µm. (C) Cell size measured by forward scatter at day 2 of in vitro culture shown for cells expressing shLuc control (red), shMbnl1-1 (green), and shMbnl1-2 (blue). Bar graph shows the relative forward scatter level of cells treated with the shLuc or shMbnl1 shRNAs. Statistics from 3 experiments are shown. (D) Flow cytometry plots of day 2 in vitro cultured cells stained with Ter119-APC and Hoechst. Boxes denote enucleated cells. Statistics from 3 experiments are shown. (E) RNA expression levels of the indicated genes in GFP-sorted day 2 cultured cells following addition of shRNAs, as determined by qRT PCR. 18s rRNA was used for normalization. Error bar is standard deviation (n = 3). (F) Relative hemoglobin levels in GFP-sorted day 2 cultured cells following addition of the indicated shRNAs (n = 3). (G) Western blot analysis of Mbnl1 subcellular localization in E14.5 murine fetal liver cells. GAPDH and hemoglobin α served as markers for the cytoplasmic fraction, whereas histone 2A.x served as marker for the nuclear fraction. (H) qPCR analysis of the expression levels of the Mbnl1 inclusion and exclusion isoforms after knockdown of the Mbnl1 inclusion isoform. (I) Terminal proliferation of erythroid cells after knockdown of the Mbnl1 inclusion isoform. (J) Cell size of erythroid cells measured by forward scatter after knockdown of the Mbnl1 inclusion and exclusion isoforms. (K) Enucleation of erythroid cells after knockdown of the Mbnl1inclusion and excluded isoforms. (L) qPCR analysis of the expression levels of splicing isoforms of 4 genes after knockdown of the Mbnl1 inclusion and exclusion isoforms. (M) qPCR analysis of the expression levels of the Mbnl1 inclusion and exclusion isoforms after knockdown of the Mbnl1inclusion isoform with or without ectopic expression of the Mbnl1 exclusion isoform. (N) Cell size, (O) enucleation, and (P) qPCR analysis of the expression levels of splicing isoforms of 4 genes of erythroid cells after knockdown of the Mbnl1inclusion isoform with or without ectopic expression of the Mbnl1 exclusion isoform.
May Grünwald-Giemsa staining of cultured erythroid progenitor cells at 48 hours of differentiation demonstrated that Mbnl1 knockdown cells were less enucleated and larger than control shLuc cells. The morphologies of shMbnl1-1 and shMbnl1-2 knockdown cells were reminiscent of early orthochromatic and polychromatic erythroblasts, respectively (Figure 3B). Consistent with these microscopic findings, FACS analysis showed that the Mbnl1 knockdown cells had a higher forward scatter and thus were larger than control cells (Figure 3C). FACS experiments using Hoechst (DNA dye) and Ter119 markers revealed a marked reduction of enucleation when Mbnl1 was depleted. Less than 10% of shMbnl1-1 cells and only 1% of shMbnl1-2 cells underwent enucleation (HoechstlowTer119high) compared with 33% of control shLuc cells (Figure 3D).
To quantify the levels of important erythroid transcripts, we performed qRT-PCR on mRNA isolated from transduced cells. Developmentally induced genes such as Hbb-b1, Hbb-b2, Slc4a1 (band 3, the anion antiporter), Epb4.1 (cytoskeleton band 4.1) Gypa (glycophorin A), and Fech (an enzyme in the heme biosynthesis pathway) were consistently less induced in Mbnl1 knockdown cells than in control cells (Figure 4E). Consistent with the decreased levels of mRNAs encoding globins and enzymes responsible for making heme, the Mbnl1 knockdown cells had ∼50% less hemoglobin than controls (Figure 4F). Additionally, in Mbnl1 knockdown cells, there was partial impairment in the normal down-regulation of developmentally repressed genes such as Stat5a, CD44, Myb, and c-kit, relative to the shLuc control. The differentiation block observed in these different assays was stronger in cells infected with shMbnl1-2 compared with those with shMbnl1-1, likely as a result of more potent repression of Mbnl1 by shMbnl1-2.
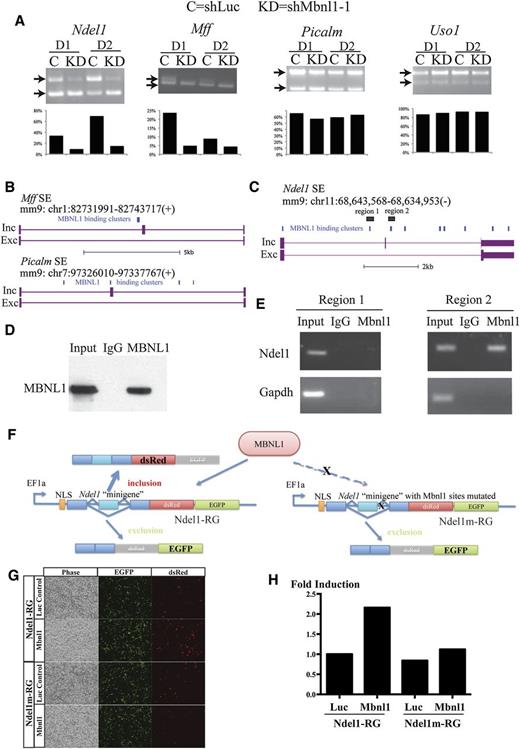
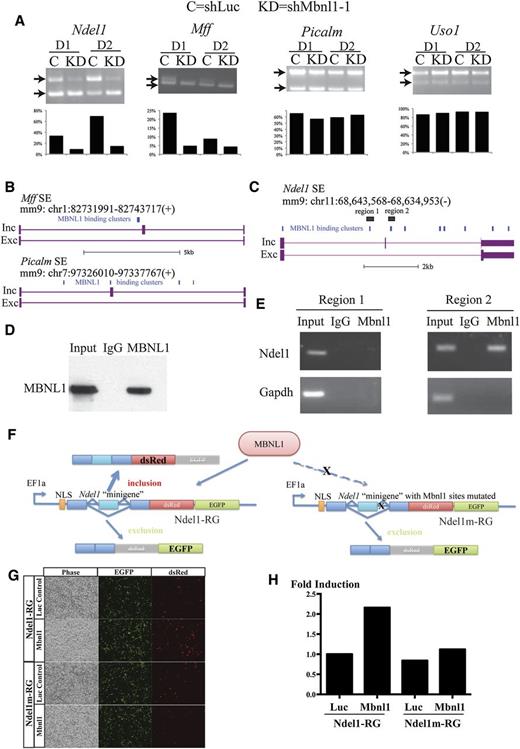
Ndel1 is a direct MBNL1 splicing target. (A) Semiquantitative RT-PCR analysis of alternative exon presence in Ndel1, Mff, Picalm, and Uso1 gene transcripts in GFP-sorted cultured day1 (D1) and day 2 (D2) cells infected with shLuc (C) or shMbnl1-1 (KD). Bar graphs show the percentage of the inclusion isoform based on quantification of inclusion and exclusion band intensities. (B) Genome tracks showing the computed positions of MBNL1 binding clusters in the introns of the Mff and Picalm transcripts relative to the alternatively skipped exon. (C) Genome track showing the computed position of the MBNL1 binding clusters on the introns of Ndel1 SE event and the regions probed by the RIP experiment. (D) Western blot of MBNL1 protein in control IgG and anti-MBNL1 immunoprecipitations of a total cell lysate. (E) PCR analysis of Ndel1 intronic regions in IgG and MBNL1 immunoprecipitated cell lysates. (F) Schematic of the bichromatic splicing reporter assay; wild-type Ndel gene depicted on the left and the form with a mutation in the predicted Mbnl1 binding site on the right. (G) Fluorescent microscopy images of MBNL1-Ndel1-minigene reporter assay. (H) Quantification of the fold induction of Ndel1-inc-dsRed reporter signal derived from FACS analysis.
Ndel1 is a direct MBNL1 splicing target. (A) Semiquantitative RT-PCR analysis of alternative exon presence in Ndel1, Mff, Picalm, and Uso1 gene transcripts in GFP-sorted cultured day1 (D1) and day 2 (D2) cells infected with shLuc (C) or shMbnl1-1 (KD). Bar graphs show the percentage of the inclusion isoform based on quantification of inclusion and exclusion band intensities. (B) Genome tracks showing the computed positions of MBNL1 binding clusters in the introns of the Mff and Picalm transcripts relative to the alternatively skipped exon. (C) Genome track showing the computed position of the MBNL1 binding clusters on the introns of Ndel1 SE event and the regions probed by the RIP experiment. (D) Western blot of MBNL1 protein in control IgG and anti-MBNL1 immunoprecipitations of a total cell lysate. (E) PCR analysis of Ndel1 intronic regions in IgG and MBNL1 immunoprecipitated cell lysates. (F) Schematic of the bichromatic splicing reporter assay; wild-type Ndel gene depicted on the left and the form with a mutation in the predicted Mbnl1 binding site on the right. (G) Fluorescent microscopy images of MBNL1-Ndel1-minigene reporter assay. (H) Quantification of the fold induction of Ndel1-inc-dsRed reporter signal derived from FACS analysis.
We observed a slight but significant decrease in cell expansion at 48 hours of culture in progenitors expressing either Mbnl1 shRNAs (supplemental Figure 2B). However, there was no significant difference in the numbers of apoptotic cells based on Annexin V and propidium iodide staining (3-5%; supplemental Figure 2C).
Taken together, our microscopic analysis, FACS analysis, and molecular profiling suggest that MBNL1 is essential for normal erythroid differentiation and proliferation.
Previous work showed that different MBNL1 isoforms have different subcellular localizations and that the inclusion but not the exclusion isoform is mainly localized in the nucleus.20,34 To determine the subcellular localization of MBNL1 isoforms in erythroid cells, we isolated nuclear and cytoplasmic fraction from E14.5 murine fetal liver cells (see “Materials and methods”). The MBNL1 exclusion isoform displayed both nuclear and cytoplasmic localizations with an enrichment in the cytoplasm, whereas the MBNL1 inclusion isoform was mainly localized in the nucleus, consistent with previous observations (Figure 3G).20,34 Based on their localization patterns, we predicted that the inclusion form played a major role in alternative RNA splicing. To this end, we designed 1 shRNA targeting the junction of exons 4 and 5 to knockdown the Mbnl1 inclusion form and another shRNA targeting the junction of exons 4 and 6 to knockdown the exclusion form. Knockdown of the inclusion form led to a significant decrease of the inclusion isoform and a moderate decrease of the exclusion isoform, whereas knockdown of the exclusion form resulted in a significant decrease of both isoforms (Figure 3H). Presumably, using an shRNA against either the excluded or included exon affects splicing of the Mbnl nuclear precursor so that neither splice isoform is generated. Thus, knockdown of either isoform individually impaired erythroid terminal differentiation, as measured by a decrease in cell proliferation, failure to decrease cell size, and reduced enucleation (Figures 3I-K), as well as splicing of MBNL1 target genes Ndel1 and Mff (Figure 3L).
We ectopically expressed the Mbnl1 exclusion isoform in erythroid cells following knockdown of the Mbnl1 inclusion isoform (Figures 3M-P). Importantly, these cells express only the exclusion but not the inclusion isoforms (Figure 3M). In the absence of the MBNL1 inclusion isoform, expression of the MBNL1 exclusion isoform did not support differentiation-associated cell size decrease (Figure 3N), enucleation (Figure 3O), or splicing of MBNL1 target pre-mRNAs (Figure 3P). These results suggest that the 2 MBNL1 isoforms have different cellular localizations and functions and that it is the nuclear MBNL1 inclusion isoform that plays an essential in regulating splicing during erythropoiesis.
Ndel1 pre-mRNA is a direct splicing target of MBNL1
To identify target genes and SE events regulated by MBNL1, we selected 4 genes (Ndel1, Mff, Picalm, and Uso1) to interrogate their dependence on MBNL1 to produce a correct developmentally regulated splicing pattern. These genes and splicing events were selected based on the presence (Ndel1, Mff, and Picalm) and absence (Uso1) of MBNL1 binding clusters in their introns from a published CLIP-seq dataset (Figure 4B-C).18 Erythroid progenitors were infected by retroviruses expressing shRNAs against Luc or Mbnl1, and we analyzed mRNA splicing patterns of these candidate genes after 1 and 2 days of culture. Alternative exon inclusion of the Ndel1 and Mff genes was greatly reduced by knockdown of Mbnl1. In contrast, regulated exon inclusion in Picalm and Uso1 mRNAs was largely unaffected (Figure 4A).
To verify that Ndel1 pre-mRNA was directly bound by MBNL1 in erythroid cells, we designed RNA-immunoprecipitation (RIP) experiments to probe for MBNL1 binding in a region upstream (region 1) and a region downstream (region 2) of the cassette exon of Ndel1 (Figure 4C) in extracts of primary fetal liver E14.5 cells. As a control, the MBNL1 protein was recovered after immunoprecipitation using the MBNL1 antibody, but not by a control mouse IgG (Figure 4D). We then tested by PCR the immunoprecipitated RNA for the presence of region 1 and region 2 fragments of Ndel1 mRNA (Figure 4E). We failed to detect enrichment of region 1 of the Ndel1 pre-mRNA by RIP. In contrast, we detected specific enrichment of region 2 of the Ndel1 pre-mRNA that was downstream of the regulated exon in the MBNL1 immunoprecipitation, but not in the immunoglobulin G pull-down (Figure 4E). Control Gapdh mRNA was not detected in either immunoprecipitates. This indicated that MBNL1 binds to region 2 of the Ndel1 intron in vivo, as predicted from sequence analysis.
To further establish that the reduced inclusion of the cassette exon of Ndel1 in Mbnl1 knockdown cells is due to the direct effect of MBNL1 depletion rather than a more general block in erythroid differentiation and to show that MBNL1 can directly bind to Ndel1 and regulate the inclusion of the cassette exon, we constructed a bichromatic splicing reporter35 containing the genomic fragments from the 5′ splice site of the upstream flanking exon to the 3′ splice site of the downstream flanking exon and tested the effect of MBNL1 on reporter activity in a heterologous cell type: HEK293T (Figure 4F-H). Inclusion of the 35nt cassette exon of Ndel1 affects the reading frame of the reporter and allows in-frame expression of the dsRed protein coding segment and thus endows cells with red fluorescence, whereas exclusion of the exon allows in-frame expression of the GFP protein coding segment and thus endows cells with green fluorescence. Cotransfection of the reporter with a control luciferase reporter produced cells with mainly green fluorescence, indicating that the default splicing pattern of the reporter minigene in HEK293T cells is mainly exon exclusion. Conversely, overexpression of MBNL1 induced red fluorescence, indicating that MBNL1 induced the inclusion of the cassette exon in the Ndel1 minigene. Following mutation of potential Mbnl1 binding sites with the motif YGCY within region 2 identified by the RIP experiment, the MBNL1 induction of red fluorescence was greatly reduced, indicating that those binding sites are important for the full splicing activity by MBNL1 direct binding on the reporter minigene.
Knockdown of Ndel1 impairs erythroid terminal proliferation and is partially rescued by the Ndel1 inclusion form
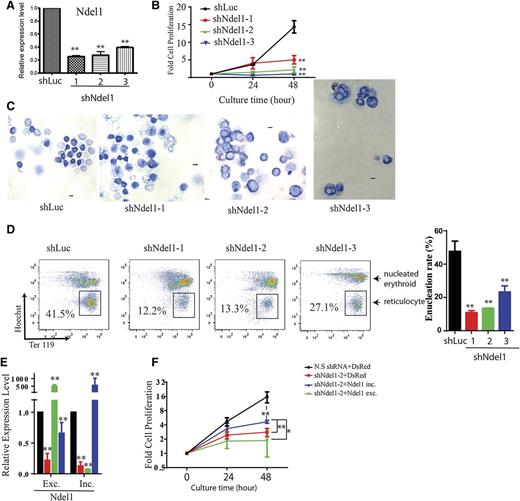
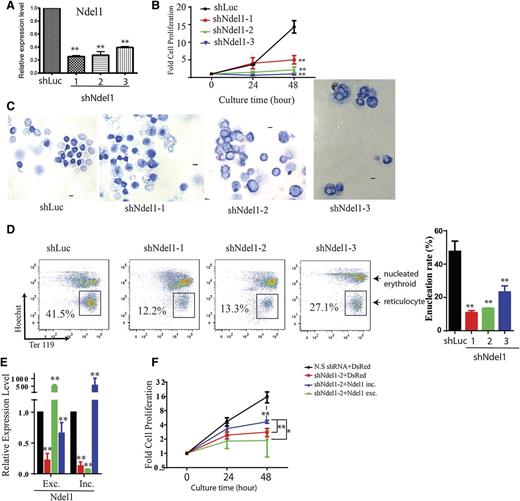
NDEL1 plays an important role in various cellular processes, including mitosis and neurogenesis.36,37 It binds to the motor protein dynein and regulates its functions and also serves as a docking platform for many signaling proteins.37 To assess the importance of Ndel1 in erythroid terminal differentiation, retroviruses generated from 3 independent Ndel1 shRNA knockdown (shNdel1-1∼3) constructs, as well as a control luciferase (shLuc) knockdown shRNA, were used to infect E14.5 mouse fetal liver erythroid progenitor cells. qRT-PCR revealed that Ndel1 mRNA was significantly depleted in the cells 48 hours after infection by all 3 Ndel1 shRNA viruses (Figure 5A). Ndel1 knockdown cells had a severe defect in erythroid terminal proliferation (Figure 5B) and after 48-hour culture were larger and less enucleated than control shLuc cells, as demonstrated by May Grünwald-Giemsa staining (Figure 5C). Staining the cells with Hoechst (DNA dye) and Ter119 revealed that Ndel1 knockdown inhibited enucleation by >50% compared with the shLuc control (Figure 5D). These results demonstrated that Ndel1 was critical for erythroid terminal proliferation, probably due to its previously described role in mitosis.38 Next we conducted experiments using Ndel1 knockdown and splice isoform-specific rescue to address the functional importance of each splice isoform of Ndel1 (Figures 5E-F). Ndel1 knockdown cells with ectopic expression of inclusion and exclusion isoforms of Ndel1 induce expression of each isoform to supraphysiological levels (Figure 5E). Overexpression of Ndel1 inclusion isoform (the isoform promoted by MBNL1) but not the exclusion isoform partially rescues the proliferation defect of Ndel1 knockdown (Figure 5F), indicating the importance of this inclusion isoform in terminal erythropoiesis.
Knockdown of Ndel1 impairs terminal erythroid proliferation and differentiation and is partially rescued by overexpression of the Ndel1 inclusive form. (A) qRT-PCR analysis of Ndel1 expression after 48 hours of differentiation of cells expressing shLuc, shNdel1-1, shNdel1-2, or shNdel1-3. (B) Graph showing terminal proliferation of erythroid cells after knockdown of control (black), shNdel1-1 (red), shNdel1-2 (green), or shNdel1-3 (blue). (C) Representative images of May-Grunwald Giemsa staining of infected erythroid cells after 48-hour culture. Scale bar is 10 µm. (D) Flow cytometry plots of infected erythroid cells after 48-hour culture stained with Ter119-APC and Hoechst. Enucleated reticulocytes are boxed. Statistics of 3 experiments are shown. (E) qRT-PCR analysis of the expression of the Ndel1 exclusion and inclusion forms in cells in which Ndel1 is knocked down and then rescued by expression of the 2 Ndel1 isoforms. Exc., excluded; Inc., included isoform. (F) Overexpression of Ndel1-inc isoform, but not the Ndel1-exc isoform, partially rescues the proliferation defect caused by knockdown of endogenous Ndel1.
Knockdown of Ndel1 impairs terminal erythroid proliferation and differentiation and is partially rescued by overexpression of the Ndel1 inclusive form. (A) qRT-PCR analysis of Ndel1 expression after 48 hours of differentiation of cells expressing shLuc, shNdel1-1, shNdel1-2, or shNdel1-3. (B) Graph showing terminal proliferation of erythroid cells after knockdown of control (black), shNdel1-1 (red), shNdel1-2 (green), or shNdel1-3 (blue). (C) Representative images of May-Grunwald Giemsa staining of infected erythroid cells after 48-hour culture. Scale bar is 10 µm. (D) Flow cytometry plots of infected erythroid cells after 48-hour culture stained with Ter119-APC and Hoechst. Enucleated reticulocytes are boxed. Statistics of 3 experiments are shown. (E) qRT-PCR analysis of the expression of the Ndel1 exclusion and inclusion forms in cells in which Ndel1 is knocked down and then rescued by expression of the 2 Ndel1 isoforms. Exc., excluded; Inc., included isoform. (F) Overexpression of Ndel1-inc isoform, but not the Ndel1-exc isoform, partially rescues the proliferation defect caused by knockdown of endogenous Ndel1.
Discussion
Our studies have uncovered a global post-transcriptional alternative isoform gene expression program and identified hundreds of proteins with changes in their protein sequence by altering the reading frame of the mRNAs in terminal erythropoiesis. GO analysis suggested these proteins were enriched in transmembrane receptor activity, chromatin modification, RNA binding, DNA repair, DNA packing, and RNA processing, all of which are important for erythroid terminal development.
By enrichment analysis of pentanucleotides surrounding splicing sites, we identified several RNA binding proteins that may regulate splicing. Among them, MBNL1 was a major splicing factor with the highest motif fold enrichment. MBNL1 regulates alternative pre-mRNA splicing in many tissues and cell types,23,35,39-42 but its function in erythroid development was unclear. Our results demonstrated that both Mbnl1 exon 5 inclusion and exclusion isoforms were expressed during terminal erythropoiesis. The subcellular localization of 2 MBNL1 isoforms was different in erythroblasts, which was consistent with previous studies in cardiocytes and skeletal muscle cells.22,34 The MBNL1 inclusion isoform was mainly located in the nucleus, whereas the MBNL1 exclusion isoform was enriched in the cytoplasm. Our work also showed that the MBNL1 inclusion isoform plays a critical role in regulation of RNA splicing in erythroid differentiation. Knockdown of either of the 2 Mbnl1 isoforms together or the inclusion isoform alone severely blocked erythroid differentiation, keeping erythroblast in an undifferentiated stage and inhibiting alternative splicing of Mbnl1 targeted genes including Ndel1 and Mff. Knockdown of Mbnl1 also caused a defect in cell proliferation. These results suggested Mbnl1 was essential for terminal erythropoiesis.
MBNL1 CLIP-seq binding clusters suggested and RIP and Ndel1 bichromatic reporter assay confirmed that Mbnl1 regulates Ndel1 mRNA splicing. NDEL1 has been established as an important regulator of cytoskeletal dynamics through association with a number of cytoskeletal regulatory proteins. An example is the LIS1/NDEL1 interaction, which is necessary to activate cytoplasmic dynein.43 Similarly, NDEL1 has also been implicated in regulating microfilament motors through activating Cdc42 by competitively inhibiting Cdc42GAP activity.44 Knockout of Ndel1 disrupts the alignment of metaphase spindles during mitosis.45 Our findings indicated that Ndel1 was essential for erythroid terminal proliferation, presumably for mitosis. The isoform of Ndel1 that exists in more differentiated states of erythroblasts includes an exon that spans 35 bases near the 3′ end of the transcript. Because this regulated exon alters the reading frame, the proteins encoded by the exon-included and exon-excluded Ndel1 mRNAs have different C-terminal sequences from residue 315 containing different short linear motifs (supplemental Figure 5), eg, motifs that interact with SH3 domains, as predicted by Scansite,46 and residue 336, which is a binding site for 14-3-3 protein.47 Overexpression of the Ndel1 inclusion form partially rescued erythroid terminal proliferation after Ndel1 knockdown, but the Ndel1 exclusion form did not. The different C-terminal sequences could thus modulate the functions of NDEL1 protein by changing its interaction with other proteins; more specifically, the differentiation-associated C-terminal domain may be integral to certain cytoskeletal dynamics during erythroid terminal proliferation.
The similarity of the results of terminal erythroid differentiation assays between the Ndel1 knockdown and the Mbnl1 knockdown suggests that Ndel1 may act downstream of Mbnl1. However, because the phenotype of the Ndel1 knockdown was less pronounced than that of Mbnl1 knockdown, other MBNL1-mediated alternative splicing events likely also are important for proper terminal erythropoiesis.
Adult mice normally generate ∼2.5% of their total erythrocytes per day to match the rate of senescent red cell loss and can increase this rate up to 10-fold to compensate for severe blood loss. To our knowledge, no anemia or erythroid defects have been reported in adult Mbnl1 knockout mice,23 although these mice have not been subjected to stresses that would normally stimulate red cell formation. Mbnl1 and Mbnl2 double knockout mice are embryonic lethal, whereas Mbnl1 knockout and Mbnl2 heterozygous knockout mice are viable.39 Importantly, at least in the tissues that have been analyzed—quadriceps muscle, heart, and brain—the expression of Mbnl2 increases in Mbnl1 knockout mice.39 This suggests that the functions of Mbnl1 and Mbnl2 are complementary to each other. In Mbnl1 knockout mice, to compensate the loss of Mbnl1, we speculate that the Mbnl2 expression level increases during fetal erythropoiesis, leading to the birth of the Mbnl1 knockout mice. Such compensatory induction of Mbnl2 should not and did not occur in our cell culture systems following Mbnl1 knockdown. Moreover, in Mbnl1 knockout mice, only exon 3 of Mbnl1 is deleted.23 Although no full-length Mbnl1 is detectable, we cannot exclude the possibility that a truncated Mbnl1 is expressed at a very low level and is able to simulate weak but sufficient fetal erythropoiesis. Although no effects on adult erythropoiesis have been reported in Mbnl1 knockout mice, the requirement of Mbnl1 in erythropoiesis under stress conditions has not been investigated. Furthermore, we speculate that Mbnl1 knockout mice present with fetal anemia similar to Stat5 knockout mice48 and E2F4 knockout mice,49-51 which as adults have near normal red cell levels but are defective in fetal erythropoiesis. Detailed analyses of Mbnl knockout mice will be the subject of future experiments.
Recent population genome-wide studies have identified mutations in RNA splicing factors in anemia and hematological malignancies.52 Our finding of crucial functions of the RNA splicing factor MBNL1 in erythropoiesis, opens a new direction for investigating pathogenesis of anemia.
The online version of this article contains a data supplement.
There is an Inside Blood Commentary on this article in this issue.
The publication costs of this article were defrayed in part by page charge payment. Therefore, and solely to indicate this fact, this article is hereby marked “advertisement” in accordance with 18 USC section 1734.
Acknowledgments
The authors thank Vijay Sankaran and Leif Si-Hun Ludwig for useful discussions. This research was supported by a predoctoral fellowship (A.W.C.) and a postdoctoral fellowship (P.W.) from the Croucher Foundation and the National Institutes of Health (H.F.L. and C.C.B.), as well as National Institutes of Health, National Heart, Lung, and Blood Institute grant P01 HL032262-25 and National Institute of Diabetes and Digestive and Kidney Diseases grant R01 DK068348-07 (to H.F.L.). The Mbnl1 antibody developed by Morris, G.E. was obtained from the Developmental Studies Hybridoma Bank, created by the NICHD of the National Institutes of Health, and maintained at Department of Biology, University of Iowa (Iowa City, IA).
Authorship
Contribution: A.W.C., J.S., P.W., C.B.B., and H.F.L. conceived and designed the experiments; A.W.C., J.S., P.W., K.L.L., P.T., and H.C. performed the experiments; A.W.C., J.S., and P.W. analyzed the data; J.S. and E.T.W. contributed reagents/materials; and A.W.C., J.S., P.W., K.L.L., C.B.B., and H.F.L. wrote the paper.
Conflict-of-interest disclosure: The authors declare no competing financial interests.
Correspondence: Christopher B. Burge, Department of Biology and Koch Institute for Integrative Cancer Research, Massachusetts Institute of Technology, 77 Massachusetts Ave, Cambridge, MA 02142; e-mail: cburge@mit.edu; and Harvey F. Lodish, Whitehead Institute for Biomedical Research, 9 Cambridge Center, Cambridge, MA 02142; e-mail: lodish@wi.mit.edu.
References
Author notes
A.W.C., J.S., and P.W. contributed equally to this work.

