Key Points
Anemia accounted for 8.8% of the total disability from all conditions in 2010. Children <5 years and women still have the highest burden.
Although iron-deficiency anemia is the most common etiology globally, other leading causes of anemia vary widely by geography, age, and sex.
Abstract
Previous studies of anemia epidemiology have been geographically limited with little detail about severity or etiology. Using publicly available data, we estimated mild, moderate, and severe anemia from 1990 to 2010 for 187 countries, both sexes, and 20 age groups. We then performed cause-specific attribution to 17 conditions using data from the Global Burden of Diseases, Injuries and Risk Factors (GBD) 2010 Study. Global anemia prevalence in 2010 was 32.9%, causing 68.36 (95% uncertainty interval [UI], 40.98 to 107.54) million years lived with disability (8.8% of total for all conditions [95% UI, 6.3% to 11.7%]). Prevalence dropped for both sexes from 1990 to 2010, although more for males. Prevalence in females was higher in most regions and age groups. South Asia and Central, West, and East sub-Saharan Africa had the highest burden, while East, Southeast, and South Asia saw the greatest reductions. Iron-deficiency anemia was the top cause globally, although 10 different conditions were among the top 3 in regional rankings. Malaria, schistosomiasis, and chronic kidney disease–related anemia were the only conditions to increase in prevalence. Hemoglobinopathies made significant contributions in most populations. Burden was highest in children under age 5, the only age groups with negative trends from 1990 to 2010.
Introduction
Anemia is characterized by a decreased quantity of red blood cells, often accompanied by diminished hemoglobin levels or altered red blood cell morphology. Anemia is pathophysiologically diverse and often multifactorial. Iron-deficiency anemia (IDA) has been found to be correlated with decreased cognitive performance in many studies.1,2 Symptoms result from impaired tissue oxygen delivery and may include weakness, fatigue, difficulty concentrating, or poor work productivity.3 Children may have issues with mental and motor development.4,5 IDA, especially when severe, is correlated with increased risk of preterm labor, low birth weight,6 and child and maternal mortality7,8 and may predispose to infection9 and heart failure.10 Although these studies have largely been of IDA, the detrimental findings have been in excess of those with nonanemic iron deficiency, supporting a primary role for anemia as a risk factor for poor outcomes.
Surveillance of anemia is challenging, requiring simultaneous understanding of the epidemiology of its underlying causes. Focusing only on total anemia invites misinterpretation of trends because changes in severity may be missed.11 Estimates in high-risk populations suggest that total anemia prevalence may be as high as 50% to 80%, with as many as 10% to 20% having moderate to severe anemia.12 Prevalence is consistently higher in people with low socioeconomic status, low body weight, and in females who have recently given birth.13 Global cause-specific analyses have tended to focus only on tracking iron deficiency14,15 or on single countries or regions.16-19 Khambalia et al20 are the only researchers who have published an international study of multiple causes, although their analysis was limited to 13 countries and focused on indigenous populations. The World Health Organization (WHO) has been providing most of the worldwide anemia surveillance for the past few decades, although most reports have focused on iron deficiency and included at most 4 age groups with little delineation by severity or cause.21
With the analysis presented here, we aimed to produce the first complete accounting of global anemia burden. By taking advantage of the data, methods, and analytical resources of the Global Burden of Diseases, Injuries and Risk Factors (GBD) Study 2010, our estimates include total and by-severity anemia prevalence and disability burden for 17 contributing causes in each of 187 countries, 20 age groups, and both sexes from 1990 to 2010.
Methods
The starting point of our strategy was calculation of an anemia envelope: a determination of mean hemoglobin as well as the sum total of anemia prevalence by severity for each country, age group, and both sexes for each year from 1980 through 2010. The envelope approach avoids double counting while capturing potentially different disease profiles within each population group. We defined a population group as a specific country, sex, age group, and year. Cause-specific attribution was performed on the anemia envelope at discrete time points (1990 and 2010) by using information on cause-specific prevalence and hemoglobin shift from the GBD 2010 Study. Figure 1 provides an overview of the process, and detailed descriptions of each step are in the supplemental Methods, available on the Blood Web site.

Flowchartof modeling process for calculating anemia burden. Illustration of the process used for first calculating the total amount of anemia present in each country, age, sex, and year (the anemia “envelope”), then apportioning it to individual causes of anemia in a hierarchical, mutually exclusive, and evidence-based approach. DHS, Demographic and Health Surveys; HgB, hemoglobin; IHME, Institute for Health Metrics and Evaluation; Lowess R.E., locally weighted scatterplot smoothing random effects regression; NOS, not otherwise specified; OLS, ordinary least squares; PfPR, Plasmodium falciparum parasite rate; VMNIS, Vitamin and Mineral Nutrition Information System.
Flowchartof modeling process for calculating anemia burden. Illustration of the process used for first calculating the total amount of anemia present in each country, age, sex, and year (the anemia “envelope”), then apportioning it to individual causes of anemia in a hierarchical, mutually exclusive, and evidence-based approach. DHS, Demographic and Health Surveys; HgB, hemoglobin; IHME, Institute for Health Metrics and Evaluation; Lowess R.E., locally weighted scatterplot smoothing random effects regression; NOS, not otherwise specified; OLS, ordinary least squares; PfPR, Plasmodium falciparum parasite rate; VMNIS, Vitamin and Mineral Nutrition Information System.
We defined anemia by using the same thresholds (listed in Table 1) as those used by GBD 2000.22 These definitions are based on hemoglobin thresholds that vary by sex, age, and pregnancy status and include 5 distinct groups: adult males, adult nonpregnant females, adult pregnant females, male children, and female children.23 We used population-based surveys of hemoglobin concentration as the primary data input for envelope calculations. These data were the most reliable and comparable measures of anemia coming from national and subnational measurement surveys, and they also spanned the most countries and time periods. A total of 409 separate data sets from 150 countries were used to inform the envelope. Supplemental Tables 1 and 2 tabulate these data sets by source. Inclusion, exclusion, and diagnostic criteria for other studies were similar and can be found in each study. Most used a HemoCue test and excluded those with terminal or acute medical conditions and those undergoing intensive treatment (eg, chemotherapy or dialysis).
After standardizing input data, we used prevalence of underweight children as a predictive covariate for population groups where data were absent. It was the best performing of several covariates tested. The country-year–specific prevalence of underweight children was obtained from the IHME causes of death database and had been previously calculated for every year between 1970 and 2011 by using spatial-temporal regression of data from national and subnational measurement surveys. We refined the envelope for each severity, adjusting for estimated prevalence of pregnancy.
We finalized the anemia envelope by calculating years of life lived with disability (YLD) for each population group, multiplying prevalence times the disability weights (DWs) listed in Table 1. DWs were derived from surveys administered to population-representative samples in 5 countries (United States, Peru, Tanzania, Bangladesh, and Indonesia) and more than 31 000 respondents to an open Internet survey.24 Their empirical basis was thus derived from collective public judgment of health state severity rather than expert opinion of researchers or health care professionals.
Table 2 lists the 17 causes of anemia we considered, and supplemental Table 3 tabulates their corresponding International Classification of Diseases (ICD) codes. Ten causes had corresponding prevalence estimates from the GBD Study 2010. For malaria, we used P falciparum parasite rate to determine the at-risk population. Hemoglobinopathies each had several submodels and included separate results for heterozygous states. Our estimates of anemia from chronic kidney diseases (CKDs) were disaggregated into diabetes mellitus, hypertension, and other or unspecified.
Total “hemoglobin shift” was taken as the difference between the normal and predicted mean hemoglobin for each population group. We denoted the normal hemoglobin level as the global 95th percentile of the distribution of mean hemoglobin within each age group, sex, and year. We then determined a total shift for each country in the corresponding age group, sex, and year by finding the difference between the global “normal” and the country-specific predicted mean hemoglobin. Our model of attribution stated that because the shift is a disease state experienced by 100% of the population, then the sum of cause-specific hemoglobin shifts times the prevalence of each contributing cause should add up to the total.
Cause-specific hemoglobin shifts are listed in supplemental Table 4. We obtained them by performing systematic literature reviews and meta-analyses of hemoglobin changes in those with each condition or, in the case of malaria, simulation based on the P falciparum parasite rate. Shift times prevalence estimates from all causes were summed, compared with the total predicted hemoglobin shift, and proportionally assigned.
We distributed the residual envelope among 7 remaining causes. Of note, our IDA estimates include acute and chronic hemorrhagic states for which supplementation may be helpful, but poor nutritional intake is not the only underlying problem. A few causes in this category (hookworm, schistosomiasis, upper gastrointestinal bleeding, and gynecologic diseases) were considered separately from IDA because there were enough data from GBD 2010 to do so. Distribution of anemia burden to IDA only after assignment to known causes avoided double counting of these cases. Most other causes of anemia not specifically considered are included in the “other” categories.
Our ascription to IDA was based on a recently published meta-analysis of well-designed studies to determine the effect of iron fortification alone (without other micronutrients).25 Of note, the effect size from iron fortification was similar to other recent meta-analyses of iron supplementation that did not specifically exclude other micronutrients.26,27 We paired the observed hemoglobin shift with a calculated envelope residual from the matching country, age, sex, and year and determined that ∼80% of the residual could be ascribed to iron. The final remainder was split among these final six cause categories in the proportions listed in supplemental Table 5. Residual distribution proportions by age, region, and sex are shown in supplemental Figure 7.
For regional figures, we ordered the 21 GBD regions by mean age of death. Mean age of death reflects both population age structure and age-specific death rates and is a simple summary measure of the demographic and epidemiologic transition.28 We examined our results by using several metrics: prevalence and caseload for information on how common the condition is, YLD and mean DW to elucidate differential anemia severity between populations, and overall magnitude of burden. Uncertainty from all inputs into the calculations were propagated by taking 1000 draws for each age, sex, country, year and cause. Aggregations were made at the level of the 1000 draws for all estimates. The uncertainty interval (UI) around each quantity of interest is presented as the 2.5th and 97.5th percentile, which can be interpreted as a 95% UI. To help understand drivers of differences over time, we decomposed changes from 1990 to 2010 into growth in total population, change in population age and sex structure, and change in age- and sex-specific disease rates as described previously.29
Results
Anemia accounted for 65.5 million YLD (95% UI, 39.9 to 102 million) in 1990 (11.2% of worldwide YLD from all causes [95% UI, 8.2% to 14.7%]) and 68.4 million YLD (95% UI, 41.0 to 108 million) in 2010 (8.8% of all YLD [95% UI, 6.3% to 11.7%]). Anemia prevalence over this time period decreased from 40.2% (95% UI, 35.8% to 46.0%) in 1990 to 32.9% (95% UI, 28.9% to 38.5%) in 2010. Figure 2 illustrates global changes between 1990 and 2010. Supplemental Figure 7 and supplemental Table 6 illustrate regional changes. Although total anemia YLD increased globally, prevalence was lower in both sexes in 2010 for all severities of anemia. In males, the most substantial gains were in reduction of mild and moderate anemia prevalence whereas the largest percentage reduction for females was in the prevalence of severe anemia. Such a large reduction in the prevalence of severe anemia led to a decrease in mean DW (average severity of cases) of 4.9% for females, while the mean DW for males increased by 1.5%. A decrease in the rate of disease was the primary driver of decreased global burden in both sexes and for all severities of anemia.

Global anemia prevalence, total YLD, and mean DW, by severity, from 1990 to 2010. Global anemia burden was calculated for each year from 1980 through 2010 (1980-1990 not shown). Prevalence rates decreased from 40.2% to 32.9% from 1990 to 2010. Roughly two thirds of this decrease can be attributed to decreased sex- and cause-specific rates of diseases that lead to anemia. The remaining one third of the decrease was associated with population aging. Total anemia burden, as measured in YLD increased from 65.5 to 68.3 million YLD (8.8% of global total from all conditions) from 1990 to 2010. Without dramatic decreases in age-, sex- and cause-specific disease rates, population growth would have led to a much greater increase in total anemia YLD. Mean severity of anemia cases, as measured by mean DW, decreased for females from 1990 to 2010, but not for males.
Global anemia prevalence, total YLD, and mean DW, by severity, from 1990 to 2010. Global anemia burden was calculated for each year from 1980 through 2010 (1980-1990 not shown). Prevalence rates decreased from 40.2% to 32.9% from 1990 to 2010. Roughly two thirds of this decrease can be attributed to decreased sex- and cause-specific rates of diseases that lead to anemia. The remaining one third of the decrease was associated with population aging. Total anemia burden, as measured in YLD increased from 65.5 to 68.3 million YLD (8.8% of global total from all conditions) from 1990 to 2010. Without dramatic decreases in age-, sex- and cause-specific disease rates, population growth would have led to a much greater increase in total anemia YLD. Mean severity of anemia cases, as measured by mean DW, decreased for females from 1990 to 2010, but not for males.
Geographic and gender differences in anemia burden
South Asia accounted for 37.5% of the entire global anemia YLD in 2010, down from 39.8% in 1990. It also had the highest anemia prevalence in 1990 but improved significantly by 2010 to become fourth highest in males and third in females. Over the same time period, total YLD in the lower-income regions of sub-Saharan Africa increased from 16.4% to 23.9% of the worldwide total. Higher-income regions had the lowest prevalence estimates, all less than 25%.
Females had higher prevalence of anemia than males in virtually all regions, especially Central Asia (43.2% vs 22.8%) and Asia Pacific, High Income (19.4% vs 10%). Improvements in total anemia prevalence were also more pronounced for males, meaning that the gender gap widened in every region between 1990 and 2010. In all regions except Central and Eastern Europe, population growth alone would have equated to a substantial increase in the number of anemia YLD. In several regions, including all of Asia, age- and sex-specific rates of disease dropped so substantially that they caused a net decrease in the total number of anemia YLD. Central, East, and West sub-Saharan Africa performed the worst in this metric, with increased total anemia YLD of 45.6% to 71.9%. Although population growth was the primary contributor to the growth, these regions also lagged behind other low- and middle-income regions in decreasing the rate of anemia. Changes in caseload were qualitatively similar to those in YLD.
Cause-specific anemia burden and regional rankings
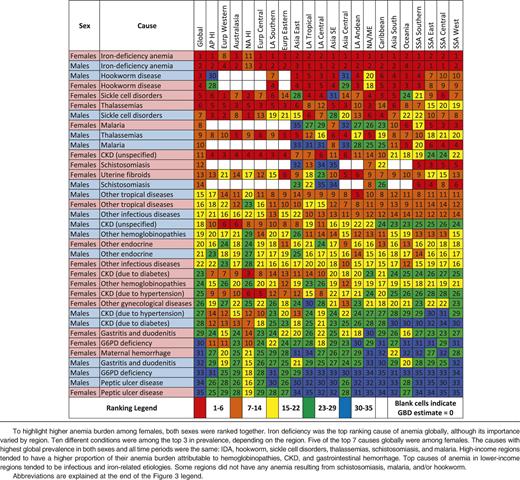
Figure 3 shows our cause-specific anemia estimates, and Table 3 ranks all of the causes of anemia by region compared with the overall global ranking for 2010. Ten different conditions were among the top 3 in prevalence, depending on the region. Five of the top 7 causes globally were among females. The causes with highest prevalence in both sexes and all time periods were the same: IDA, hookworm, sickle cell disorders, thalassemias, schistosomiasis, and malaria. Global prevalence decreased for most causes between 1990 and 2010. The largest gain for males was in reduction of hookworm prevalence, while the largest percentage improvement for females was in maternal hemorrhage. Malaria, schistosomiasis, and CKDs were the only causes of anemia that increased in prevalence, while anemia as a result of all hemoglobinopathies was relatively flat. The result, coupled with aging and population growth, was a dramatic increase in the number of cases for these conditions.

Globaland regional cause-specific anemia prevalence for 1990 and 2010. Prevalence of anemia for both males and females decreased from 1990 to 2010. The largest improvements for males were in anemia resulting from hookworm and iron deficiency, while the largest percentage gains for females were in iron deficiency and maternal hemorrhage. Regional differences in proportion of cases resulting from specific causes varied widely. Malaria was a major cause of anemia in many regions, but none more so than West sub-Saharan Africa, where it accounted for 24.7% of all prevalent anemia. South and East Asia, despite being among those regions with the greatest reductions in anemia, had more than half the world’s anemia cases. Anemia prevalence in 2010 generally increased with decreasing regional mean age of death. Prevalence was highest in East, Central, and West sub-Saharan Africa. These regions also saw the least improvement among all low- and middle-income regions between 1990 and 2010. AP, Asia Pacific; Cent, central; Eur, Europe; G6PD, glucose-6-phosphate dehydrogenase; hemog, hemoglobinemia; HI, high income; LA, Latin America; NA, North America; NA/ME, North Africa/Middle East; NTD, neglected tropical diseases; South, Southern; SE, Southeast; SSA, sub-Saharan Africa.
Globaland regional cause-specific anemia prevalence for 1990 and 2010. Prevalence of anemia for both males and females decreased from 1990 to 2010. The largest improvements for males were in anemia resulting from hookworm and iron deficiency, while the largest percentage gains for females were in iron deficiency and maternal hemorrhage. Regional differences in proportion of cases resulting from specific causes varied widely. Malaria was a major cause of anemia in many regions, but none more so than West sub-Saharan Africa, where it accounted for 24.7% of all prevalent anemia. South and East Asia, despite being among those regions with the greatest reductions in anemia, had more than half the world’s anemia cases. Anemia prevalence in 2010 generally increased with decreasing regional mean age of death. Prevalence was highest in East, Central, and West sub-Saharan Africa. These regions also saw the least improvement among all low- and middle-income regions between 1990 and 2010. AP, Asia Pacific; Cent, central; Eur, Europe; G6PD, glucose-6-phosphate dehydrogenase; hemog, hemoglobinemia; HI, high income; LA, Latin America; NA, North America; NA/ME, North Africa/Middle East; NTD, neglected tropical diseases; South, Southern; SE, Southeast; SSA, sub-Saharan Africa.
The lowest burden from iron deficiency was found in North America, high income (2.9% of envelope), while several regions had a very high fraction of their burden caused by it, including Central Asia (64.7%), South Asia (54.8%), and Andean Latin America (62.3%). High-income regions tended to have a higher proportion of their anemia burden attributable to hemoglobinopathies, CKDs, and gastrointestinal hemorrhage. Malaria was a major cause of anemia in many regions, but none more so than western sub-Saharan Africa, where it accounted for 24.7% of the prevalence envelope for both sexes combined.
Anemia burden by age group
Figure 4 shows global anemia burden by age group and sex. The highest anemia prevalence was in the postneonatal period, followed by age 1 to 4 years. These youngest age groups also had the least favorable changes from 1990 to 2010. Age group results by region are shown in supplemental Figure 8, and specific causes are shown in supplemental Figure 9. Age patterns of anemia were qualitatively similar for all regions and most causes. Notable exceptions were hookworm, CKDs, and anemia related to gastric and gynecologic conditions. In males, there was a marked increase in prevalence of anemia from hookworm at age 5 to 14 years, a rapid decline in adulthood, and another increase in older age groups. Anemia from CKD increased with age in an accelerating fashion for both sexes, culminating as the most prevalent cause of anemia in the 80+ years age group. Maternal hemorrhage peaked at age 25 to 29 years. Anemia from uterine fibroids and other gynecologic conditions peaked at young ages and decreased steadily with age. Gastritis and peptic ulcer disease were estimated to account for an appreciable portion of anemia burden in adults until age 50 to 54 years.

Global burden of anemia by age. Anemia burden by age for (A) prevalence and (B) total YLD. Those younger than age 5 years had the highest prevalence and total YLD from anemia. These age groups also had the least favorable changes between 1990 and 2010. Females had higher prevalence and total YLD than males at all ages. While anemia prevalence for females decreased steadily with age, anemia prevalence increased in older age groups among males. As demonstrated by steady decreases in total YLD, however, those prevalent cases among males tended to be less severe. Improvements in anemia prevalence and total YLD for males between 1990 and 2010 were more substantial than those for females although not statistically significant.
Global burden of anemia by age. Anemia burden by age for (A) prevalence and (B) total YLD. Those younger than age 5 years had the highest prevalence and total YLD from anemia. These age groups also had the least favorable changes between 1990 and 2010. Females had higher prevalence and total YLD than males at all ages. While anemia prevalence for females decreased steadily with age, anemia prevalence increased in older age groups among males. As demonstrated by steady decreases in total YLD, however, those prevalent cases among males tended to be less severe. Improvements in anemia prevalence and total YLD for males between 1990 and 2010 were more substantial than those for females although not statistically significant.
By age 15 years and continuing through adulthood, females consistently had more anemia than males. Mean DW for females was also higher throughout most of adulthood. The gender gap was widest in the Caribbean and Central and South Asia, although in percentage terms, it was greater in wealthy regions, especially Australasia and Asia Pacific, high income. Gender differences were most pronounced between ages 20 and 34 and worsened between 1990 and 2010. Females had higher prevalence of all causes except for other infectious disease, other neglected tropical diseases, other hemoglobinopathies, and peptic ulcer disease. Complete anemia burden figures by country, age group, year, and sex are illustrated in Figure 5 (YLD) and tabulated in supplemental Table 7 (prevalence).

TotalYLD resulting from all causes of anemia by country. YLD resulting from all causes of anemia are presented as per capita results for 2010. The percentage change in anemia burden from 1990 to 2010 by country is shown in the bottom panel. West and Central sub-Saharan Africa along with South Asia had the highest rates of anemia-related disability in 1990. Many African countries still had very high rates of anemia YLD in 2010 and made comparatively little progress in reducing anemia in the intervening two decades. Many countries did make significant progress, however, including all countries in East and South Asia, much of the Middle East, as well as parts of central Latin America. ATG, Antigua and Barbuda; BRB, Barbados; COM, Comoros; DMA, Dominica; FJI, Fiji; FSM, Federated States of Micronesia; GRD, Grenada; KIR, Kiribati; LCA, Saint Lucia; MDV, Maldives; MHL, Marshall Islands; MLT, Malta; MUS, Mauritius; SGP, Singapore; SLB, Solomon Islands; SYC, Seychelles; TLS, Timor-Leste; TON, Tonga; TTO, Trinidad and Tobago; VCT, Saint Vincent and the Grenadines; VUT, Vanuatu; WSM, Samoa.
TotalYLD resulting from all causes of anemia by country. YLD resulting from all causes of anemia are presented as per capita results for 2010. The percentage change in anemia burden from 1990 to 2010 by country is shown in the bottom panel. West and Central sub-Saharan Africa along with South Asia had the highest rates of anemia-related disability in 1990. Many African countries still had very high rates of anemia YLD in 2010 and made comparatively little progress in reducing anemia in the intervening two decades. Many countries did make significant progress, however, including all countries in East and South Asia, much of the Middle East, as well as parts of central Latin America. ATG, Antigua and Barbuda; BRB, Barbados; COM, Comoros; DMA, Dominica; FJI, Fiji; FSM, Federated States of Micronesia; GRD, Grenada; KIR, Kiribati; LCA, Saint Lucia; MDV, Maldives; MHL, Marshall Islands; MLT, Malta; MUS, Mauritius; SGP, Singapore; SLB, Solomon Islands; SYC, Seychelles; TLS, Timor-Leste; TON, Tonga; TTO, Trinidad and Tobago; VCT, Saint Vincent and the Grenadines; VUT, Vanuatu; WSM, Samoa.
Discussion
Despite significant decreases in prevalence from 1990 to 2010, anemia was responsible for 68.3 million YLD in 2010 (8.8% of global total), more than major depression (63.2 million [8.18%]), chronic respiratory diseases (49.3 million [6.33%]), and the totality of injuries (47.2 million [6.29%]). Total anemia YLD increased in all ages between 1990 and 2010. In young age groups, increased anemia YLD were driven by a combination of increased prevalence and population growth. During adulthood, some of the increase can likewise be attributed to population growth, while a portion may also be the result of enhanced survival among those with chronic conditions known to cause anemia (eg, hemoglobinopathies and CKDs). In older age groups, population aging is likely the primary driver of increased total YLD from anemia, because anemia prevalence in these age groups decreased from all causes except malaria. The impact of anemia on health is likely even greater since our results did not include quantification of anemia-related cognitive deficiencies, heart failure, or early mortality or disability from myriad other health states associated with severe hemoglobinopathies.
The age group most vulnerable to detrimental long-term effects of anemia is children under age 5 years. Young children had the highest prevalence in all regions and the highest mean severity in all low- and middle-income regions. Alarmingly, these were the only age groups with increased anemia prevalence from 1990 to 2010. We recommend that this age group remains a high priority for anemia control interventions. In accordance with recently published WHO guidelines,30 optimizing nutrition, including targeted daily iron supplementation, should be considered a first-line intervention in high-risk or high-prevalence groups. In endemic regions, empiric administration of antihelminthic medications may also be warranted. Efforts to target severe anemia should also be guided by the disease profile of children in the specific country because, as reported in Malawi19 and Bangladesh,31 many cases cannot be explained solely by iron deficiency.
Gender differences in anemia burden were not unexpected, but what was most striking was the magnitude of the gender gap and the finding that it has widened since 1990. Females had higher prevalence and mean severity of anemia in virtually all regions and throughout adulthood. Male children had higher anemia prevalence than females, a difference that appears to be almost entirely driven by excess prevalence of mild anemia resulting from hookworm. Because much of the excess anemia in females at other ages was related to iron deficiency (including gynecologic conditions that often present as iron deficiency), we recommend programs to focus both on iron supplementation and development of mechanisms for identifying and treating underlying causes of chronic hemorrhage.
In older age groups, CKD and nutritional factors were the biggest contributors to total anemia burden in both sexes. Their relative importance has grown both as a proportion of anemia within these age groups and as a proportion of total global anemia burden. Public health measures to target older age groups for nutritional supplementation and reduce the risks associated with the development of CKD, namely control of diabetes and hypertension, may help slow the growth of anemia burden in these age groups.
Regions with high anemia prevalence tended to have higher mean severity of anemia and a higher proportion of their anemia burden due to infectious and iron-related etiologies. East, South, and Southeast Asia registered the greatest prevalence reductions, while East, West, and Central sub-Saharan Africa fared the worst, owing largely to their population growth. High-income regions had the lowest anemia burden, but also the slowest progress. North America, high income, was the only region that did not reduce disease rates. Some countries have implemented programs that have likely contributed to the decreased prevalence of certain types of anemia. The most notable example may be Cyprus, where a newborn screening program for hemoglobinopathies is likely responsible for our finding of a 7.63% decrease (95% UI, 5.68% to 11.6%) in the anemia burden to thalassemia in 1- to 4-year-olds. Even then, however, the age-standardized anemia prevalence rate dropped only 1.88% (95% UI, 1.76% to 1.80%), suggesting that for now the decreased anemia burden may be overshadowed by improved survival of persons with these conditions. Differential levels of success in reducing anemia burden in different regions and population groups suggest that improvements in health, poverty, and living conditions that are not related to the health system may be responsible for some of the improvements.
The GBD Study 2010 estimates of anemia compare favorably with several recent studies.32-34 Asobayire et al,32 using their own modified anemia thresholds, found that 46% of school-age children in Côte d’Ivoire had anemia. By using the same thresholds as that study, our model predicted 35.1% (95% UI, 28.9% to 39.7%) anemia prevalence in 5- to 9-year-olds. Cardoso et al33 found that among anemic rural Brazilian infants, 93.7% (95% UI, 92.4% to 95.1%) had evidence of iron deficiency, with a significant proportion with positive laboratory tests for infection. Our model predicts that 91.2% (95% UI, 90.0% to 92.4%) of anemia in this age group is related to iron deficiency and infectious causes. Pasricha et al34 detected anemia in 75.3% of rural Indian infants. Using the same thresholds, our model estimated prevalence of anemia at 73.9% (95% UI, 73.0% to 74.3%). Finally, after the GBD Study 2010 was completed, we received a large volume of anemia survey microdata from Turkey (not shown), the results of which were within 2.2% of our estimates for both sexes.
As we demonstrated earlier, it is important to be cognizant of the thresholds used when reviewing results of anemia analyses. We chose to use the same anemia thresholds as those used by the WHO for GBD 2000,22 which included a singular hemoglobin cutoff of 120 g/L for all children. In addition to being consistent with previous GBD efforts, we chose this to optimize the tradeoff between sensitivity and specificity in identifying at-risk population groups in the youngest ages. While many different cutoffs for hemoglobin have been used, <110 g/L is the most common for children age 6 months to 5 years. Using this threshold would have lowered our 2010 prevalence estimates by an average 16.3% for males (range, 0% to 49.7%) and 18.1% for females (range, 0% to 57.2%), similar to the threshold effect seen by Gera et al.26 Although our selection of these thresholds could have influenced magnitude of burden estimates, trends in our analysis should not have been affected.
Our overarching goal was to provide estimates of anemia burden, with corresponding uncertainty measures, for every population group. We used prevalence of underweight children to predict population groups in which data were unavailable. We chose this single covariate despite plausible relationships existing between anemia and other factors. Because anemia and malnutrition have been clearly linked, the association appears to be independent of other factors,35,36 and this data set was among our most complete. Other than the effects introduced by the underweight prevalence covariate, our models assumed that the age pattern of hemoglobin in those younger than age 5 years is similar globally. Hopefully, as surveillance expands in the youngest age groups, we will have enough data to revisit this assumption. None of the global threshold recommendations account for potential variability in populations or ethnicities, and they do not contain any definition for anemia in those younger than age 6 months. The appropriate hemoglobin cutoff for those younger than age 6 months is unresolved but should be higher, probably between 150 g/L and 190 g/L.37 Also, though controversial, we found insufficient data at the global level to support different thresholds for abnormal hemoglobin in different ethnicities.38,39
Many more than 17 diseases can cause anemia. Most were assigned to our “other” categories, either because of the rarity of the condition or because there were insufficient data for individual modeling. Examples include anemia resulting from acute and chronic hemorrhage, anemia of chronic inflammation (ACI), and anemia associated with nonterminal HIV and malignancy. In addition, while many studies assign a significant portion of the anemia burden in older age groups to “unknown causes,” this was inconsistent with our effort to perform explicit causal attribution so this category was not included in this analysis. Most hemorrhage-related anemia is currently included in iron deficiency, but the other causes are missing from the GBD Study 2010 cause list. Because those with known chronic disease were excluded from data sources that informed envelope calculations, we suspect that a majority of the global ACI and AIDS-associated anemia burden was not captured. Global prevalence of ACI is unknown, but country-level studies have suggested its contribution is nontrivial, especially in older adults.40 Conversely, a majority of anemia associated with early malignancy and HIV was reflected in our anemia envelope calculations, but we did not have sufficient data to parse out which proportion was caused by the disease, its sequelae, or treatment.41 This anemia burden was likely distributed among the residual attribution categories.
Targeted anemia surveillance and intervention should be a greater priority in high-risk populations, especially young children and females.42 Despite causing so much disability, anemia does not receive its requisite attention in many public health spheres. Such inattention may be partly because anemia is thought of as a by-product of other disease processes rather than as a target for intervention in and of itself. It is somewhat ironic, then, that etiology-specific epidemiologic detail is so essential to development of appropriate intervention frameworks. We hope our analysis helps health specialists, donors, and policymakers see through this dichotomy by distilling the heterogeneity of anemia into a single entity while retaining enough information about individual conditions to facilitate formulation of strategies to further reduce anemia burden.
The online version of this article contains a data supplement.
There is an Inside Blood commentary on this article in this issue.
The publication costs of this article were defrayed in part by page charge payment. Therefore, and solely to indicate this fact, this article is hereby marked “advertisement” in accordance with 18 USC section 1734.
Acknowledgments
We thank all the individuals who contributed to the Global Burden of Diseases, Injuries and Risk Factors 2010 Study. We thank Greg Freedman and Ryan Barber at the Institute for Health Metrics and Evaluation for their assistance with coding and preparation of figures. We thank those who helped identify data sources and data extraction, including Gretchen Stevens, Juan Pablo Pena-Rosas, Francesco Branca, Luz Maria De Regil (all from the WHO), and Ramiro Guerrero (Agency for Promotion of Exports and Investments of El Salvador). We also thank those at the London School for Hygiene and Tropical Medicine for their assistance with analysis of anemia resulting from maternal hemorrhage, including Karen Wagner, Carine Ronsmans, Sara Thomas, Clara Calvert, and Veronique Filippi.
This work was supported by funding from the Bill & Melinda Gates Foundation for the GBD 2010 Study and by the US Fund for UNICEF (grant 43386) from the Bill & Melinda Gates Foundation (T.P.E.).
Authorship
Contribution: N.J.K. wrote the first draft of the manuscript and made edits recommended by other authors; N.J.K., R.J., M.N., and C.J.L.M. developed and implemented the analytic strategy for calculating the anemia envelope and its attribution; and N.J.K., S.K.W., N.J., R.L., M.R., D.W., D.P.C., T.P.E., S.R.F., R.L.P., and S.J.B. contributed data, performed analysis of individual etiologies of anemia, and performed systematic literature reviews to inform etiologic attribution of the anemia envelope.
Conflict-of-interest disclosure: The authors declare no competing financial interests.
Correspondence: Nicholas J. Kassebaum, Institute for Health Metrics and Evaluation, 2301 5th Ave, Suite 600 Seattle, WA 98105; e-mail: nickjk@uw.edu.