Abstract
Categorization of response criteria for multiple myeloma (MM) is based on magnitude of change in serum and urine paraprotein values and normalization of free light chain ratio (rFLC). However, the association between improvements in these surrogate markers and patient outcomes is not validated in the phase I setting. Early measures of response would be beneficial for patients and agents to identify those likely to have prolonged disease-free intervals and to validate agent activity for rapid movement to subsequent development.
We identified 31 trials that met enrollment criteria of phase I, relapsed or refractory disease, and non-transplant study population. Clinical and demographic data collected included age, sex, race, ECOG performance status (PS) at entry, myeloma subtype and isotype, prior therapy, cytogenetics at study entry, date of progression, and date of expiration. Patients with t(4;14), del13, del17p, t(14;16), or t(14;20) were considered to have non-standard risk cytogenetics. Evaluation of the relationship between progression free survival (PFS) and change in plasma cell activity by the rFLC and magnitude of response in serum/urine paraprotein per IMWG criteria was performed. Landmark analyses occurred at cycle 2 and 4, 8, and 12 months. Progression free survival (PFS) at 12 months was the primary outcome of interest.
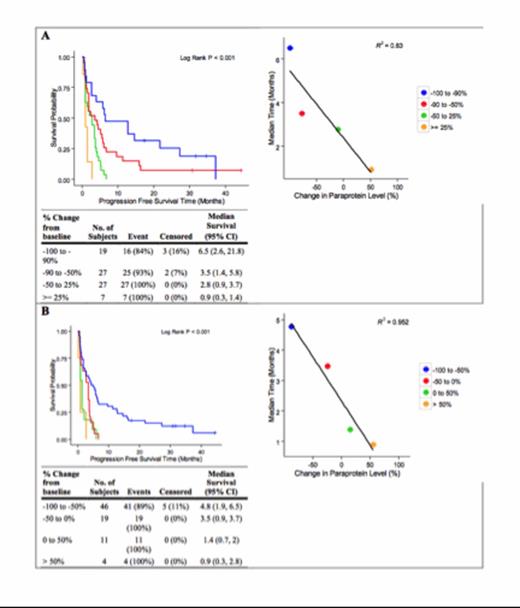
Among 87 patients; 47 (54%) were female; 56 (64%) white, 29 (33%) black; 27 (31%) non-standard risk cytogenetics; ECOG PS 1 in 73 (84%); and median prior lines 5 (1-11). Eighty were evaluable for paraprotein changes, 71 for rFLC. Normalization of rFLC at 4 months conferred a PFS advantage (11.3 v 2.8 months, p = 0.038) (Table 1). Normalization of rFLC by 12 months was found to predict PFS (6.1 vs. 2.8 months, p = 0.015) and a longer OS (45 vs. 17.4 months, p = 0.002). Magnitude of response in paraprotein was found to predict and correlate linearly with PFS at all time landmarks (r2 = 0.769 to 0.952). Analysis of PFS by IMWG criteria and by quartiles of 50% changes were both linear (p < 0.001) (Figure 1).
Normalization of rFLC, PFS, and OS.
| . | PFS . | OS . | ||||
|---|---|---|---|---|---|---|
| Time Landmark . | Normal rFLC . | Abnormal rFLC . | Logrank p . | Normal rFLC . | Abnormal rFLC . | Logrank p . |
| Cycle 2 | 14.6 (1.9 – 21.8) | 3.2 (1.9 – 4) | 0.098 | 42.4 (6.9 – 58) | 22.3 (15.7 – 40.8) | 0.921 |
| 4 Months | 11.3 (0.5 – 21.8) | 2.8 (1.7 – 3.9) | 0.038 | 42.4 (6.9 – 58) | 21.8 (15.1 – 31.8) | 0.46 |
| 8 Months | 6.6 (1 – 21.8) | 3.5 (1.7 – 4) | 0.131 | 40.8 (13.9 – 58) | 20.9 (14.1 – 31.8) | 0.538 |
| 12 Months | 6.1 (2.6 – 16) | 2.8 (1.4 – 3.9) | 0.015 | 45 (30.4 – n/a) | 17.4 (9.9 – 24.6) | 0.002 |
Data are presented as median in months (95% CI).
Figure 1Kaplan-Meier Analysis of PFS and Magnitude of Response by IMWG Criteria (A) and 50% Quartiles (B)
Figure 1Kaplan-Meier Analysis of PFS and Magnitude of Response by IMWG Criteria (A) and 50% Quartiles (B)
These findings suggest that normalization of the rFLC and magnitude of paraprotein response are viable surrogate disease endpoints in phase I clinical trials of novel agents and combinations. The use of current IMWG criteria in the phase I setting is valuable, but the addition of time of response and alterations of response boundaries should be further evaluated in the setting of improved treatments.
Kaufman:Onyx: Consultancy; Celgene: Consultancy, Research Funding; Novartis: Consultancy, Research Funding; Janssen: Consultancy; Millenium: Consultancy; Merck: Research Funding. Lonial:Millennium: Consultancy; Celgene: Consultancy; Novartis: Consultancy; BMS: Consultancy; Sanofi: Consultancy; Onyx: Consultancy.
Author notes
Asterisk with author names denotes non-ASH members.


