Key Points
miR-17∼92 promotes proliferation and terminal effector differentiation in CD8 T-cells by upregulating PI3K-AKT-mTOR signaling.
Abstract
The precise microRNAs and their target cellular processes involved in generation of durable T-cell immunity remain undefined. Here we show a dynamic regulation of microRNAs as CD8 T cells differentiate from naïve to effector and memory states, with short-lived effectors transiently expressing higher levels of oncogenic miR-17∼92 compared with the relatively less proliferating memory-fated effectors. Conditional CD8 T-cell–intrinsic gain or loss of expression of miR-17∼92 in mature cells after activation resulted in striking reciprocal effects compared with wild-type counterparts in the same infection milieu—miR-17∼92 deletion resulted in lesser proliferation of antigen-specific cells during primary expansion while favoring enhanced IL-7Rα and Bcl-2 expression and multicytokine polyfunctionality; in contrast, constitutive expression of miR-17∼92 promoted terminal effector differentiation, with decreased formation of polyfunctional lymphoid memory cells. Increased proliferation upon miR-17∼92 overexpression correlated with decreased expression of tumor suppressor PTEN and increased PI3K-AKT-mTOR signaling. Thus, these studies identify miR17∼92 as a critical regulator of CD8 T-cell expansion and effector and memory lineages in the physiological context of acute infection, and present miR-17∼92 as a potential target for modulating immunologic outcome after vaccination or immunotherapeutic treatments of cancer, chronic infections, or autoimmune disorders.
Introduction
Generation of long-lived functionally robust CD8 T-cell memory is a crucial goal for vaccine design efforts against pathogens such as HIV, malaria, tuberculosis, and even cancer. Thus, greater understanding of mechanisms underlying memory development is highly sought. MicroRNAs (miRNAs) have emerged over the last decade as major players in genome-wide regulation of gene expression.1,2 As small 18 to 24 nucleotide noncoding RNA species, miRNAs suppress gene expression posttranscriptionally by directing mRNA degradation or translational repression. In the immune system, the role of miRNAs in hematopoiesis is well-established.1,3-5 Global defects in miRNA biogenesis in the absence of the RNase-III enzyme Dicer have demonstrated a critical role of miRNAs in (1) development of B cells and antibody repertoire6 ; (2) natural killer (NK) T-cell development7,8 ; (3) CD4 T-cell proliferation, survival, and Th1/Th2 differentiation3,4,9 ; (4) regulatory T-cell homeostasis and function9-11 ; and (5) thymic development of CD8 T cells.3,4 More recently, Zhang et al12 have demonstrated that deficiency of Dicer in T-cells leads to dysregulation of CD8 T-cell activation, proliferation, effector responses, and survival, thus presenting miRNAs as major gene regulators during CD8 T-cell responses. However, our knowledge of the precise miRNAs involved and how they regulate CD8 T-cell differentiation is severely lacking.
CD8 T-cell responses are initiated when antigenic stimulation triggers proliferation and differentiation into effector cytotoxic T lymphocytes (CTLs),13 which engage in clearance of pathogen via release of cytotoxic molecules and effector cytokines such as IFN-γ and TNF-α. After pathogen clearance, a fraction of CTLs differentiate into long-lived memory cells. Such memory-fated CTLs are referred to as memory precursor effector cells (MPECs) as opposed to the short-lived effector cells (SLECs) that rapidly die after pathogen clearance. The diversely fated MPECs and SLECs are readily distinguishable by phenotypic markers during expansion,14-18 and their development is regulated by duration of antigen, inflammation, and cytokine signals which are implicated as key regulatory factors.16-24 Genome-wide transcriptome analyses of MPECs and SLECs have further identified several genes and cellular processes putatively involved in CD8 T-cell fate determination.17,25,26
Proliferation is a key cellular process that increases CTL numbers up to 100 000 fold.18 This study reports increased expression of the pro-proliferative miR-17∼92 locus during early stages of CD8 T-cell expansion, with relatively higher expression of miR-17∼92 in death-fated SLECs than in memory-fated MPECs. miR-17∼92 cluster is a polycistronic gene encoding 6 miRNAs (miR-17, miR-18a, miR-19a, miR-19b, miR-20a, and miR-92) and is amplified in certain human cancers.27,28 The miR-17∼92 cluster and its paralogs (miR-106a-363 and miR-106b-25) are distinguished onco-miRs because of their importance in cell transformation and tumorigenesis.28 Whereas deletion of miR-17∼92 is associated with defective embryonic development and early postnatal death,29 its overexpression in lymphocytes results in lymphoproliferative disease, autoimmunity, and premature death.30 Recently, Jiang et al9 have shown that miR-17 and miR-19b control the balance between Th1 and inducible regulatory T-cell responses. However, much remains to be learned about miR-17∼92 in CD8 T-cell differentiation.
We used the Cre-lox system to conditionally overexpress or delete miR-17∼92 specifically in mature CD8 T-cells after activation. In addition, to avoid potentially confounding issues with viral clearance, effector and memory differentiation of wild-type and knockout or overexpressor cells were analyzed within the same wild-type host. Deletion of miR-17∼92 resulted in enhanced memory differentiation. In contrast, constitutive expression of miR-17∼92 led to skewed terminal effector differentiation, with alterations in transcription factors that balance memory and effector fates. Mechanistically, miR-17∼92 modulated CD8 T-cell proliferation and PTEN-mediated regulation of PI3K-Akt-mTOR axis. Thus, these studies demonstrate that miR-17∼92 is a critical regulator of effector and memory lineages during infection via control of cell proliferation.
Materials and methods
Mice
C57BL/6 mice (Thy1.2+, Thy1.1+, Ly5.1+) were purchased from the Jackson Laboratory (Bar Harbor, ME). Thy1.1+ P14 mice bearing the DbGP33-specific T-cell receptor (TCR) were fully backcrossed to C57BL/6 mice and were maintained in our animal colony. Floxed mice for conditional deletion (Mir7-92tm1.1Tyj/J)29 or constitutive expression (C57BL/6-Gt(ROSA)26Sortm3(CAG-MIR17-92,-EGFP)Rsky/J)30 of miR-17∼92 were purchased from the Jackson Laboratory (Catalog numbers 008458 and 008517, respectively). These were each crossed with Granzyme B-Cre mice31 (a generous gift from Dr. J. Jacob) to generate conditional knockout (CKO) or conditional transgenic (CTg) mice in which Cre recombinase is expressed under control of the human granzyme B (GZMB) promoter (supplemental Figure 1A). DbGP33-specific CD8 T-cell miR-17∼92 conditional knockout (CD8CKO) and transgenic (CD8CTg) mice were also generated according to the breeding scheme outlined in supplemental Figure 1A. All animals were used in accordance with University Institutional Animal Care and Use Committee guidelines.
Virus and infections
The Armstrong strain of lymphocytic choriomeningitis virus (LCMV) was propagated, titered, and used as previously described.25 Mice were infected with 2 × 10⁵ LCMV intraperitoneally.
Isolation of T-cells, BrdU, and CFSE labeling
T cells were isolated from indicated tissues as previously described.17 Donor cells were distinguished with Thy1.1, Thy1.2, and Ly5.1 mAbs. One milligram BrdU (Sigma-Aldrich, St. Louis, MO) was administered intraperitoneally at indicated time points, and proliferation was determined by intranuclear staining of BrdU according to BD Bioscience’s (San Jose, CA) protocol. For proliferation analysis using carboxyfluorescein succinimidyl ester (CFSE), naïve P14 cells were labeled with CFSE17 (Molecular Probes, Eugene, OR) and adoptively transferred at about 106 antigen-specific cells per mouse before infection with LCMV. For in vitro T-cell stimulation, CFSE-labeled wild-type, miR-17∼92 CKO or CTg P14 cells were plated at 4 × 10⁵ cells per well in a 96-well flat-bottom plate and stimulated with GP33 (0.2 μg/mL) and anti-CD28 antibody (clone PV-1) (5 μg/mL). Proliferation analysis platform in FlowJo (Treestar) was used to analyze cell division.
Antibodies, flow cytometry, and intracellular cytokine staining
All antibodies were purchased from Biolegend (San Diego, CA) with the exception of GZMB (Invitrogen), T-Bet (Santa Cruz Biotechnology), and PTEN, pAKT, and pS6 (BD Biosciences). Cells were stained for surface or intracellular proteins and cytokines as previously described.25 For analysis of intracellular cytokines, 106 lymphocytes were stimulated with 0.2 μg/mL GP33-41 peptide in the presence of brefeldin A for 5 hours, followed by surface staining for CD8, Ly5.1, Thy1.1, or Thy1.2, and intracellular staining for IFN-γ, TNF-α, or IL-2. Intracellular signaling molecule PTEN, pAKT, and pS6 were screened by phosphoflow analysis using paraformaldehyde fixation and methanol permeabilization procedure.25,32
RNA isolation and microRNA array analysis
Naïve P14 cells were purified by fluorescence-activated cell sorting (FACS) from uninfected transgenic mice. For isolation of memory and day 4.5 or day 9 MPECs and SLECs, P14 chimeric mice containing 1 × 10⁴ naïve antigen-specific CD8 T cells were infected with LCMV. MPECs and SLECs were FACS-purified using KLRG-1 as a distinguishing marker as described previously.17 After FACS purification, total RNA (including small miRs) was isolated using miRNeasy kit (Qiagen). miRNA profiling was performed using miRCURY LNA arrays at Exiqon. A mixture of equal amounts of total RNA from naïve, memory, MPECs, and SLECs from days 4.5 and 9.0 after infection was used as a reference pool. The mRNA microarray data for early MPECs and SLECs have been published previously.18 miRNA (http://www.ncbi.nlm.nih.gov/geo/query/acc.cgi?acc=GSE46052, accession number GSE46052) and mRNA microarray data were analyzed using GeneSpring platform(Agilent Technologies), and Ingenuity IPA software (Ingenuity Systems, http://www.ingenuity.com) was used for pathway analysis of differentially expressed genes. One-way analysis of variance with corrected P ≤ .05 and fold change ≥1.15 was used to identify miRNAs that were differentially expressed in at least 2 samples. For the gene target prediction of miRNAs, the PITA algorithm was used through the online prediction tool (http://genie.weizmann.ac.il/pubs/mir07/mir07_dyn_data.html#) and Venn diagrams were created using publicly available GeneVenn software.33
mRNA isolation and RT-PCR analysis
105 naïve Thy1.2+ WT, CKO, and CTg P14 cells were adoptively transferred into naïve Thy1.1 mice that were subsequently infected with LCMV. Day 7 post infection, CD8WT, CD8CKO, and CD8CTg cells were column-purified from spleen using the EasySep mouse biotin selection kit (STEMCELL Technologies). mRNA was isolated using the RNeasy kit (Qiagen), quantified, and then equal amounts were used to generate cDNA using the QuantiTect Reverse Transcription kit (Qiagen). Real-time semiquantitative polymerase chain reaction (PCR) analysis of indicated mRNA levels was performed using respective Quantitect primer assays and the SYBR Green PCR kit (Qiagen) on Applied Biosystems’ 7900HT Fast Real-Time PCR System. GAPDH or HPRT controls were used for normalization as indicated.
Statistical analysis
Paired or unpaired Student t test (2-tailed) was used as indicated to evaluate differences between sample means. All statistical analyses were performed using Prism 5, and P values of statistical significance are indicated with asterisk(s) per the Michelin guide scale: *(P ≤ .05), **(P ≤ .01), ***(P ≤ .001) and (P > .05) was considered not significant (ns).
Results
Dynamic and differential expression of miRNAs in memory-fated and terminal effector CD8 T-cell subsets
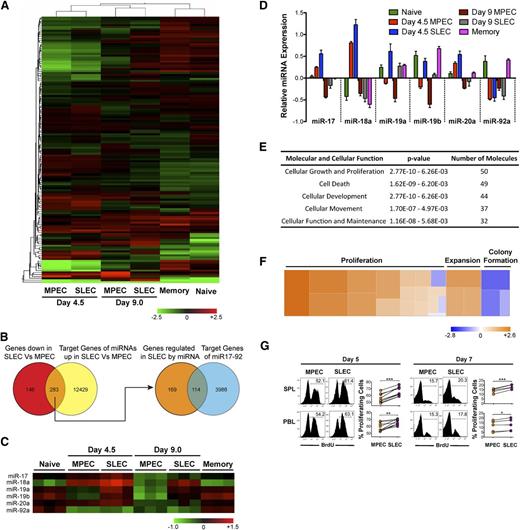
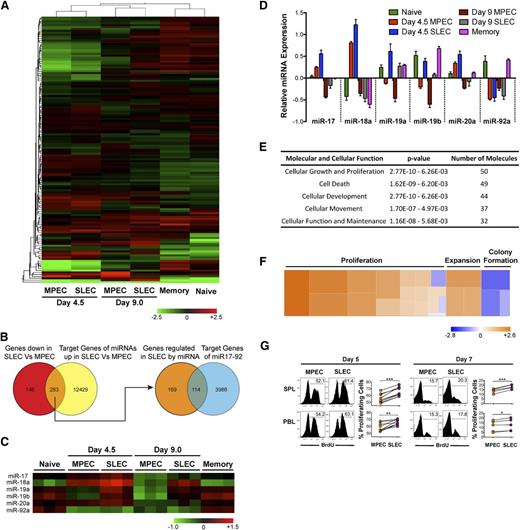
To identify specific miRNAs that can potentially regulate the differentiation of CD8 T cells from naïve to effector and memory states, we performed a genome-wide profiling of miRNA expression in naïve, memory, and MPEC and SLEC effector subsets during early (day 4.5 post infection) and late (day 9 post infection) stages of CD8 T-cell expansion. Of approximately 507 miRNA probes, we observed dynamic changes in expression of approximately 139 miRNAs (Figure 1A and supplemental Table1). Naïve and memory profiles were strikingly similar as demonstrated by close clustering in unsupervised hierarchical cluster analysis of differentially expressed miRNAs, with only 79 differentially expressed miRNAs. Early (day 4.5) and late (day 9) effector subsets clustered together, with early effectors exhibiting more dramatic alterations in miRNA expression relative to naïve and memory cells. Between MPECs and SLECs, about 77 miRNAs were differentially expressed at day 4.5 after infection. Fifty-eight of these 77 miRNAs (∼75%) were overexpressed in SLECs than MPECs (supplemental Table 2).
Differential expression of miR-17∼92 and its predicted gene targets in MPECs and SLECs correlates with differences in cell proliferation. P14 chimeric mice containing 104 DbGP33-specific CD8 T cells were infected with LCMV, and memory cells were FACS-purified at day 60 after infection, along with naïve P14 cells from uninfected mice. KLRG-1lo MPECs and KLRG-1hi SLECs were also FACS-purified at days 4.5 and 9.0 after infection. Total RNA (including small miRNA species) was isolated and miRNA expression profiling was conducted. (A) Heat map representation with unsupervised hierarchical cluster analysis of differentially expressed miRNAs, P ≤ .05. (B) Venn diagram comparison of predicted target list of miRNAs upregulated in SLECs with genes downregulated in SLECs. Common subset of 283 genes that are downregulated in SLECs and predicted to be targets of miRNAs upregulated in SLECs were then intersected with the predicted target list of miR-17∼92. (C) Heat map and (D) bar graph representations of relative expression of miRs -17, -18a, -19a, -19b, -20a, and -92a belonging to the miR-17∼92 cluster. (E) Functional classification of miR-17∼92–predicted target genes that are downregulated in SLECs into cellular processes and pathways. (F) Heat map representation of how increased expression of miR-17∼92 in SLECs regulates pathways that are predicted to affect cell growth and proliferation. Fifty genes predicted to be regulated by miR-17∼92 were functionally classified into 23 annotated pathways in Ingenuity and the z-score of impact on proliferation, expansion, and colony formation pathways is presented as heat map. A positive z-score correlates positively with the activation of a given pathway and is depicted by the orange color in the heat map. (G) P14 chimeric mice containing 104 DbGP33-specific CD8 T cells were infected with LCMV, and BrdU was administered intraperitoneally at days 4.75 and 6.75 after infection. Six hours later, proliferation of CD8+ Thy1.1+ KLRG-1lo MPECs or KLRG-1hi SLECs was analyzed by flow cytometry. Representative histogram plots and line graphs of BrdU incorporation are shown. Each line represents % BrdU+-proliferating MPECs and SLECs in individual mice. Results are representative of 3 independent experiments with 2 to 5 mice per experiment. Paired Student t test was used for statistical significance of difference of means (*P ≤ .05, **P ≤ .01, ***P ≤ .001).
Differential expression of miR-17∼92 and its predicted gene targets in MPECs and SLECs correlates with differences in cell proliferation. P14 chimeric mice containing 104 DbGP33-specific CD8 T cells were infected with LCMV, and memory cells were FACS-purified at day 60 after infection, along with naïve P14 cells from uninfected mice. KLRG-1lo MPECs and KLRG-1hi SLECs were also FACS-purified at days 4.5 and 9.0 after infection. Total RNA (including small miRNA species) was isolated and miRNA expression profiling was conducted. (A) Heat map representation with unsupervised hierarchical cluster analysis of differentially expressed miRNAs, P ≤ .05. (B) Venn diagram comparison of predicted target list of miRNAs upregulated in SLECs with genes downregulated in SLECs. Common subset of 283 genes that are downregulated in SLECs and predicted to be targets of miRNAs upregulated in SLECs were then intersected with the predicted target list of miR-17∼92. (C) Heat map and (D) bar graph representations of relative expression of miRs -17, -18a, -19a, -19b, -20a, and -92a belonging to the miR-17∼92 cluster. (E) Functional classification of miR-17∼92–predicted target genes that are downregulated in SLECs into cellular processes and pathways. (F) Heat map representation of how increased expression of miR-17∼92 in SLECs regulates pathways that are predicted to affect cell growth and proliferation. Fifty genes predicted to be regulated by miR-17∼92 were functionally classified into 23 annotated pathways in Ingenuity and the z-score of impact on proliferation, expansion, and colony formation pathways is presented as heat map. A positive z-score correlates positively with the activation of a given pathway and is depicted by the orange color in the heat map. (G) P14 chimeric mice containing 104 DbGP33-specific CD8 T cells were infected with LCMV, and BrdU was administered intraperitoneally at days 4.75 and 6.75 after infection. Six hours later, proliferation of CD8+ Thy1.1+ KLRG-1lo MPECs or KLRG-1hi SLECs was analyzed by flow cytometry. Representative histogram plots and line graphs of BrdU incorporation are shown. Each line represents % BrdU+-proliferating MPECs and SLECs in individual mice. Results are representative of 3 independent experiments with 2 to 5 mice per experiment. Paired Student t test was used for statistical significance of difference of means (*P ≤ .05, **P ≤ .01, ***P ≤ .001).
Because miRNAs are known to decrease gene expression, we next generated a list of genes that are differentially expressed between day 4.5 MPECs and SLECs from transcriptional profiling studies.18 We focused only on genes that are downregulated in SLECs (supplemental Table 3) and matched them against a composite list of predicted gene targets for miRNAs that were specifically upregulated in SLECs (supplemental Table 4). Such Venn diagram analysis (Figure 1B) identified a list of approximately 283 genes that could be potentially regulated by miRNAs overexpressed in SLECs (supplemental Table 5). Interestingly, among these 283 genes predicted to be direct targets of miRNAs upregulated in SLECs, approximately 40% (supplemental Table 7) were predicted targets of the miR-17∼92 cluster (supplemental Table 6). Consistent with this, miRs-17, -18a, -19a, -19b, and -20a belonging to the miR-17∼92 cluster were all expressed at modestly higher levels in SLECs than in MPECs (Figures 1C-D) during early stages of CD8 T-cell expansion.
Overexpression of miR-17∼92 promotes lymphoproliferation.30 To gain insight into cellular processes that may be modulated by miR-17∼92 in CD8 T-cells, we classified miR-17∼92 regulated genes that were downregulated in SLECs into pathways. In agreement with the classification of miR-17∼92 as an “onco-miR,” we found that a majority of genes belonged to cell proliferation and death/survival pathways (Figure 1E). In fact, approximately 50 of 113 genes functionally annotated into cellular growth and a proliferation pathway and were predicted to positively regulate proliferation (Figure 1F and supplemental Table 8). Increased expression of miRs-17, -18a, -19a, -19b, and -20a at day 4.5 after infection (Figure 1C-D and supplemental Figure 2), when effector cells are known to proliferate rapidly, suggested a role of miR-17∼92 in promoting CD8 T-cell proliferation. Thus, we wondered if increased expression of miR-17∼92 in SLECs (Figure 1C-D) correlated with enhanced proliferation. We used BrdU to analyze MPEC and SLEC proliferation during the early and late stages of CD8 T-cell expansion. As expected, overall proliferation was much higher during early stages (∼50%-60% BrdU+ cells), compared with ∼15% to 20% proliferating cells at the peak of expansion (Figure 1G). Notably, at both the early and late stages of expansion, SLECs underwent marginally, yet significantly, higher proliferation than their memory-fated counterparts, which expressed lower levels of miR-17∼92 (∼60% BrdU+ SLECs vs ∼50% BrdU+ MPECs at day 5 after infection in spleen) (Figure 1G). These data are consistent with a previous report17 that SLECs proliferate more than MPECs toward the tail-end of antigen clearance, prompting us to hypothesize that miR-17∼92 may regulate terminal effector and memory fates by altering CD8 T-cell proliferation.
Dysregulation of CD8 T-cell responses upon conditional gain or loss of expression of miR-17∼92
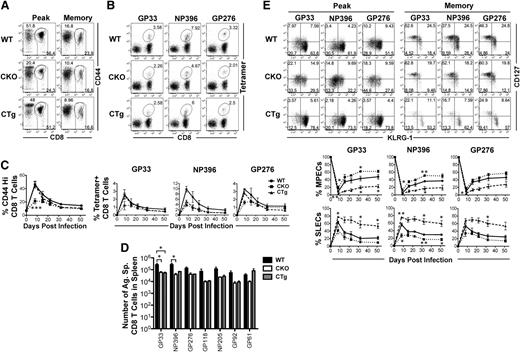
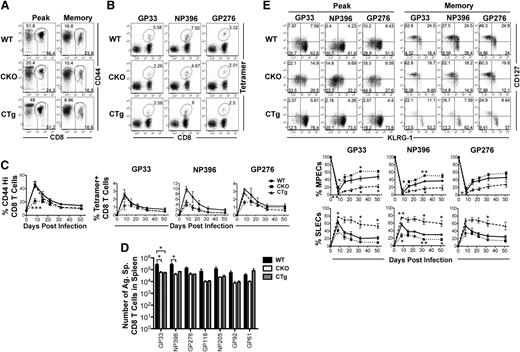
To determine whether miR-17∼92 affected effector and memory responses, we used gain or loss of expression strategies. Because miR-17∼92 is important for normal T-cell development, we used GZMB promoter–regulated Cre-recombinase expression to either (1) delete the loxP-flanked miR-17∼92 locus (CKO), or (2) delete loxP-flanked Neo-STOP cassette, thereby leading to constitutive expression of miR-17∼92 transgene (CTg) in mature T cells after activation (supplemental Figure 1A). Although CD8 T cells were expected to develop normally in CKO and CTg mice, we confirmed it by characterizing 4- to 6-week-old naïve CKO and CTg mice (supplemental Figure 1C). Numbers of CD8 T cells were similar among CKO, CTg, and wild-type mice and they were largely unactivated as demonstrated by a predominantly CD44lo, CD69lo, CD127hi, CD62Lhi, KLRG-1lo, CD27hi, and GZMBlo phenotype. Bcl-2, an antiapoptotic molecule, was expressed at similarly high levels in CKO, CTg, and wild-type CD8 T cells, which is typical. Successful deletion or constitutive expression of miR-17∼92 was confirmed by quantitative reverse-transcriptase PCR of individual miRNAs at the peak of CD8 T-cell expansion (supplemental Figure 1D). CD8 T-cell responses were then analyzed using a murine model of acute infection with LCMV. Expansion was diminished in the absence of miR-17∼92, with approximately twofold lower proportions of total antigen-specific CD8 T cells (CD44Hi) (Figure 2A,C), as well as DbGP33, DbNP396, and DbGP276 epitope-specific cells (Figure 2B-C) in CKO mice than in wild-type controls. Although CD8 T-cell expansion was largely similar in CTg and wild-type mice, the number of antigen-specific memory cells was lower in CTg mice as determined by both tetramer analysis (Figure 2C) and IFN-γ production after in vitro peptide stimulation (Figure 2D). The numbers of GP33-specific CD8 T cells were significantly different between the wild-type and CTg groups, and the other 5 antigen specificities tested exhibited similar trends. Decreased numbers of memory cells in CTg mice corresponded with significantly lower levels of MPECs (CD127hiKLRG-1lo) and increased levels of SLECs (CD127loKLRG-1hi) compared with wild-type mice at the peak of CD8 T-cell expansion (Figure 2E). At memory, CTg cells continued to manifest a more terminally differentiated phenotype with fewer CD127hiKLRG-1lo long-lived memory cells (Figure 2E) in all 3 antigen specificities analyzed. Opposite results were obtained in CKO mice—CD127hiKLRG-1lo cells predominated during effector peak and memory phases (Figures 2E), and CKO cells underwent lesser contraction as evidenced by similar numbers of CKO and CTg memory cells (Figure 2D) despite twofold lower expansion. These observations of enhanced memory phenotype in the absence of miR-17∼92, and more pronounced terminal differentiation upon its overexpression, demonstrate an important role of miR-17∼92 in regulating effector and memory fates.
miR-17∼92 regulates CD8 T-cell expansion and the balance between effector and memory fates. CKO and CTg mice with conditional loss or gain of expression of miR-17∼92 after activation of GZMB, respectively, were infected with LCMV along with wild-type mice, and antigen-specific CD8 T-cell responses were measured longitudinally in peripheral blood mononuclear cells. (A) Total antigen-specific CD8 T-cell responses were enumerated by flow cytometric analysis of CD44hi CD8+ T cells. Representative dot plots depicting frequencies of CD44hi CD8 T cells at the effector peak (day 8) and memory phase (day >30) are shown. (B) Representative dot plots of DbGP33-, DbNP396-, and DbGP276-specific CD8 T cells are shown at day 8 after infection. Numbers indicate the frequency of tetramer-positive CD8 T cells. (C) Line charts depict the frequencies of CD44hi and tetramer-specific CD8 T cells at indicated times after infection. (D) Bar graphs show total numbers of IFN-γ+ antigen–specific CD8 T cells at memory after 5-hour in vitro stimulation of splenocytes with indicated epitope peptides (0.1 μg/mL). Representative data from one experiment containing 3 mice in each group are presented. Unpaired Student t test was used for analysis of statistical significance (*P ≤ .05). (E) Representative dot plots of CD127 and KLRG-1 gated on tetramer-positive CD8 T cells are shown at effector peak (day 8) and memory (day >30) phases. Numbers in FACS plots represent quadrant frequencies. Mean ± SEM values of percentage MPECs (CD127+ KLRG-1–) and SLECs (CD127– KLRG-1+) are plotted as line charts. Representative data from 1 experiment containing 3 mice in each group are presented. Unpaired Student t test was used for analysis of statistically significant differences between wild-type and CKO or CTg mice, respectively (*P ≤ 0.05, **P ≤ .01, ***P ≤ .001).
miR-17∼92 regulates CD8 T-cell expansion and the balance between effector and memory fates. CKO and CTg mice with conditional loss or gain of expression of miR-17∼92 after activation of GZMB, respectively, were infected with LCMV along with wild-type mice, and antigen-specific CD8 T-cell responses were measured longitudinally in peripheral blood mononuclear cells. (A) Total antigen-specific CD8 T-cell responses were enumerated by flow cytometric analysis of CD44hi CD8+ T cells. Representative dot plots depicting frequencies of CD44hi CD8 T cells at the effector peak (day 8) and memory phase (day >30) are shown. (B) Representative dot plots of DbGP33-, DbNP396-, and DbGP276-specific CD8 T cells are shown at day 8 after infection. Numbers indicate the frequency of tetramer-positive CD8 T cells. (C) Line charts depict the frequencies of CD44hi and tetramer-specific CD8 T cells at indicated times after infection. (D) Bar graphs show total numbers of IFN-γ+ antigen–specific CD8 T cells at memory after 5-hour in vitro stimulation of splenocytes with indicated epitope peptides (0.1 μg/mL). Representative data from one experiment containing 3 mice in each group are presented. Unpaired Student t test was used for analysis of statistical significance (*P ≤ .05). (E) Representative dot plots of CD127 and KLRG-1 gated on tetramer-positive CD8 T cells are shown at effector peak (day 8) and memory (day >30) phases. Numbers in FACS plots represent quadrant frequencies. Mean ± SEM values of percentage MPECs (CD127+ KLRG-1–) and SLECs (CD127– KLRG-1+) are plotted as line charts. Representative data from 1 experiment containing 3 mice in each group are presented. Unpaired Student t test was used for analysis of statistically significant differences between wild-type and CKO or CTg mice, respectively (*P ≤ 0.05, **P ≤ .01, ***P ≤ .001).
miR-17∼92 regulates effector and memory differentiation in a CD8 T-cell–intrinsic manner
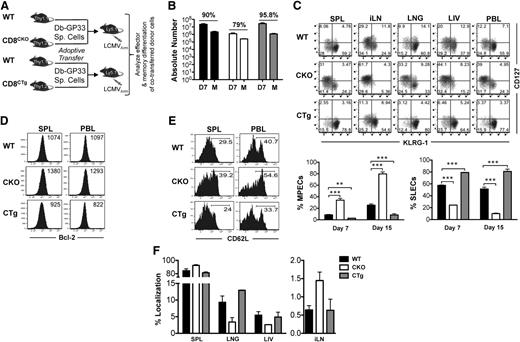
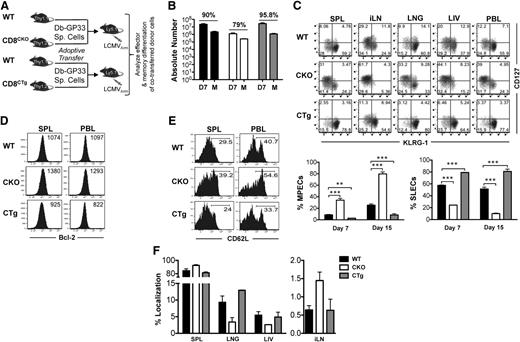
In addition to CD8 T cells, NK and CD4 T cells also express GZMB34 and are also expected to exhibit altered expression of miR-17∼92 in CKO and CTg mice. Both NK35,36 and CD4 T cells37 affect CD8 T-cell differentiation after infection. To investigate whether aberrant CD8 T-cell differentiation in CKO and CTg mice was caused by the direct effects of miR-17∼92 expression in CD8 T cells, or by indirect effects through dysregulation of CD4 T cells or NK cells, we next deleted or constitutively expressed miR-17∼92 in CD8 T cells only and analyzed their effector and memory responses in an otherwise wild-type milieu where all other hematopoietic and nonhematopoietic cells were wild-type for miR-17∼92 locus. Toward this, we generated CKO or CTg P14 TCR transgenic mice that contained DbGP33-specific CD8 T cells (supplemental Figure 1A). The experimental strategy was to adoptively transfer wild-type P14 cells (CD8WT) along with either CKO (CD8CKO) or CTg P14 (CD8CTg) cells in a 50:50 ratio (Figure 3A) such that their differentiation proceeded in the same environment. Such a cotransfer strategy also bypassed any potential, albeit unlikely, problems with viral clearance because wild-type P14 cells would clear the infection effectively.
miR-17∼92 acts in a CD8 T-cell–intrinsic manner to regulate memory differentiation. (A) 105 naïve CD8CKO (Thy1.2+) or CD8CTg (Thy1.2+) P14 cells were adoptively transferred along with equal numbers of wild-type DbGP33-specific P14 (Thy1.1+) cells into naïve C57Bl/6 mice (Ly5.1+) that were subsequently infected with LCMV. (B) Splenocytes were isolated at days 7 or >30 after infection, and frequencies of antigen-specific CD8WT, CD8CKO, and CD8CTg cells were determined by flow cytometry using CD8, Ly5.1, Thy1.1, and Thy1.2 markers. Absolute numbers of antigen-specific CD8 T cells at the effector and memory phases are presented as bar graphs. Percentage contraction of CD8 T cells from peak to memory is shown at top of the respective groups. (C) Representative FACS plots of CD127 and KLRG-1 expression on CD8WT-, CD8CKO-, and CD8CTg-gated populations are shown in spleen (SPL), inguinal lymph node (iLN), lung (LNG), liver (LIV), and blood (PBL) at day 7 after infection. Mean ± SEM of %MPECs (CD127hi KLRG-1lo) and %SLECs (CD127lo KLRG-1hi) at indicated times after infection are plotted as bar graphs. Results are representative of at least 4 independent experiments with n ≥ 3 in each group. Unpaired Student t test was used for statistical significance. (D) CD8WT, CD8CKO, and CD8CTg donor cells were analyzed for Bcl-2 expression in SPL and PBL at the peak of CD8 T-cell expansion. Histogram plots with mean fluorescence intensity (MFI) of Bcl-2 expression are shown. (E) Histogram plots of l-selectin (CD62L) expression on CD8WT, CD8CKO, and CD8CTg cells in SPL and PBL are presented at memory. Numbers represent frequencies of CD62Lhi antigen–specific CD8 T cells. (F) Bar graphs represent mean ± SEM values for %localization of CD8WT, CD8CKO, and CD8CTg cells at the memory phase in indicated tissues. %localization in each tissue was calculated by dividing the number of CD8WT, CD8CKO, or CD8CTg donor cells in the tissue by total number of respective donor cells in all tissues.
miR-17∼92 acts in a CD8 T-cell–intrinsic manner to regulate memory differentiation. (A) 105 naïve CD8CKO (Thy1.2+) or CD8CTg (Thy1.2+) P14 cells were adoptively transferred along with equal numbers of wild-type DbGP33-specific P14 (Thy1.1+) cells into naïve C57Bl/6 mice (Ly5.1+) that were subsequently infected with LCMV. (B) Splenocytes were isolated at days 7 or >30 after infection, and frequencies of antigen-specific CD8WT, CD8CKO, and CD8CTg cells were determined by flow cytometry using CD8, Ly5.1, Thy1.1, and Thy1.2 markers. Absolute numbers of antigen-specific CD8 T cells at the effector and memory phases are presented as bar graphs. Percentage contraction of CD8 T cells from peak to memory is shown at top of the respective groups. (C) Representative FACS plots of CD127 and KLRG-1 expression on CD8WT-, CD8CKO-, and CD8CTg-gated populations are shown in spleen (SPL), inguinal lymph node (iLN), lung (LNG), liver (LIV), and blood (PBL) at day 7 after infection. Mean ± SEM of %MPECs (CD127hi KLRG-1lo) and %SLECs (CD127lo KLRG-1hi) at indicated times after infection are plotted as bar graphs. Results are representative of at least 4 independent experiments with n ≥ 3 in each group. Unpaired Student t test was used for statistical significance. (D) CD8WT, CD8CKO, and CD8CTg donor cells were analyzed for Bcl-2 expression in SPL and PBL at the peak of CD8 T-cell expansion. Histogram plots with mean fluorescence intensity (MFI) of Bcl-2 expression are shown. (E) Histogram plots of l-selectin (CD62L) expression on CD8WT, CD8CKO, and CD8CTg cells in SPL and PBL are presented at memory. Numbers represent frequencies of CD62Lhi antigen–specific CD8 T cells. (F) Bar graphs represent mean ± SEM values for %localization of CD8WT, CD8CKO, and CD8CTg cells at the memory phase in indicated tissues. %localization in each tissue was calculated by dividing the number of CD8WT, CD8CKO, or CD8CTg donor cells in the tissue by total number of respective donor cells in all tissues.
Similar to observations with CKO mice, when miR-17∼92 was specifically deleted in CD8 T cells, expansion was significantly diminished compared with wild-type cells. Even though originally transferred in equal numbers, CD8CKO cells were about tenfold lower in numbers than CD8WT cells at day 7 after infection (Figure 3B). CD8CTg cells exhibited an opposite trend toward slightly greater expansion than wild-type cells, albeit not statistically significant. A determination of percent contraction of antigen-specific CD8 T cells revealed opposite trends—CD8CKO cells underwent slightly lower contraction (∼80%) from peak to memory, whereas CD8CTg cells underwent slightly higher contraction (∼95%) than CD8WT cells (∼90%) (Figure 3B). Consistent with decreased contraction, CD8CKO cells contained a greater proportion of MPECs than SLECs (Figure 3C) in all lymphoid and nonlymphoid tissues analyzed and exhibited a pronounced memory phenotype (CD127hiKLRG-1Lo) relative to CD8WT cells at both days 7 (∼40% vs 10% MPECs) and 15 after infection (80% vs 30% CD127hi KLRG-1lo cells) (Figure 3C). Along with CD127, CD8CKO cells also expressed higher levels of prosurvival molecule, Bcl-2 (Figure 3D) than CD8WT cells, which correlated with their decreased apoptosis (supplemental Figure 3) and contraction (Figure 3B). In addition to the CD127hiKLRG-1loBcl-2hi memory phenotype, CD8CKO cells also upregulated CD62L expression more efficiently (Figure 3E) and preferentially localized to lymph nodes during memory (Figure 3F). In contrast, CD8CTg cells expressed higher levels of KLRG-1, a senescence marker, typically indicative of terminal effector differentiation16,17 and were predominantly CD127loKLRG-1hi compared with CD8WT cells (Figure 3C). CD8CTg cells exhibited a modest decrease in Bcl-2 expression compared with wild-type counterparts (Figure 3D), which correlated with their lack of longevity (Figure 3B). Similar observations were made at endogenous precursor frequencies (102 antigen-specific cells after take) as well (data not shown).
CD8 T-cell–intrinsic effects of miR-17∼92 on polyfunctionality of antigen-specific cells
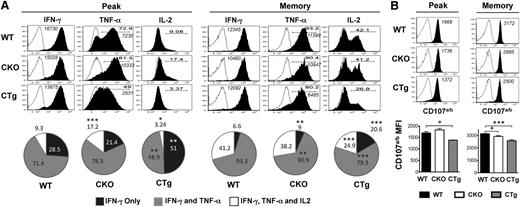
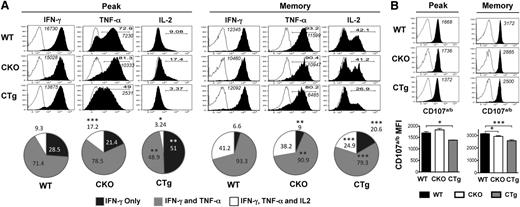
In addition to efficient migration to secondary lymphoid organs, rapid and robust elaboration of multiple cytokines including IFN-γ, TNF-α, and IL-2 (polyfunctionality) and degranulation upon secondary challenge are hallmark traits of lymphoid memory cells. Functionally, CD8CKO cells exhibited enhanced polyfunctionality in terms of coproduction of IFN-γ and TNF-α (∼79% and 71% in CD8CKO and CD8WT cells, respectively) or IFN-γ, TNF-α, and IL-2 (17% and 9% in CD8CKO and CD8WT cells, respectively) during the effector phase and also expressed higher levels of TNF-α on a per-cell basis (Figure 4A). These differences between CD8CKO and CD8WT cells disappeared by memory (Figure 4A), suggesting that CD8CKO cells acquire memory properties more rapidly than CD8WT cells, which eventually progress to the same state. In contrast, CD8CTg cells were compromised in their polyfunctionality, as demonstrated by decreased proportion of double (49% and 71% in CD8CTg and CD8WT cells, respectively) and triple cytokine producers (3% and 9% in CD8CTg and CD8WT cells, respectively), and decreased TNF-α production on a per-cell basis at both the effector and memory phases (Figure 4A). CD8CTg cells were also compromised in their ability to degranulate after activation by cognate peptide antigen, and significantly lower cell surface expression of CD107a/b was observed compared with CD8WT or CD8CKO cells at both peak and memory phases (Figure 4B). Thus, through loss or gain of miR-17∼92 expression, specifically in antigen-specific CD8 T-cells, these experiments demonstrate that miR-17∼92 functions in a CD8 T-cell–intrinsic manner to regulate expansion; effector differentiation; and kinetics of acquisition of memory phenotype, localization, and polyfunctionality.
Overexpression of miR-17∼92 leads to compromised polyfunctionality of antigen-specific CD8 T cells. Congenically mismatched antigen-specific CD8WT (Thy1.1+) and CD8CKO (Thy1.2+) or CD8CTg (Thy1.2+) cells were cotransferred in equal numbers (103) into congenically mismatched naïve B6 mice (Ly5.1+), which were infected with LCMV. Polyfunctionality was assessed by (A) measuring the frequencies of donor cells coproducing IFN-γ, TNF-α, and IL-2 and by (B) determining the extent of degranulation, as marked by cell surface expression of CD107a/b by intracellular cytokine staining (ICCS) after 5 hours of in vitro stimulation of splenocytes with GP33-41 peptide in the presence of brefeldin A and monensin and CD107a/b antibodies. CD8WT and CD8CKO or CD8CTg cells were gated using CD8, Thy1.1, Thy1.2, and Ly5.1 markers. (A) Representative histogram plots (gated on IFN-γ+ donors) are shown for day 8 (peak) and day >30 (memory) after infection. Open histograms represent unstimulated controls, and filled histograms represent GP33-41–stimulated samples. Bold numbers in histograms indicate % IFN-γ+ donors that also produce TNF-α or IL-2. Italicized numbers indicate MFI of IFN-γ and TNF-α expression. Pie charts show mean ± SEM of %donor cells producing IFN-γ only (single producers), IFN- γ and TNF-α (double producers), or IFN- γ, TNF-α, and IL-2 (triple producers) at peak (day 8) and memory (>day 30). Results are representative of 4 independent experiments, with n ≥ 3 in each group for peak time point and 5 independent experiments, with n ≥ 3 in each group for memory time point. (B) Representative histogram plots and bar graphs of mean ± SEM of CD107a/b MFI on degranulating CD8 T cells are shown. Open histograms represent unstimulated controls, and filled histograms represent GP33-41–stimulated samples. Numbers in histograms indicate MFI of CD107a/b. Plots are representative of 2 independent experiments, with n ≥ 3 in each group for peak and memory. Unpaired Student t test was used for statistical significance.
Overexpression of miR-17∼92 leads to compromised polyfunctionality of antigen-specific CD8 T cells. Congenically mismatched antigen-specific CD8WT (Thy1.1+) and CD8CKO (Thy1.2+) or CD8CTg (Thy1.2+) cells were cotransferred in equal numbers (103) into congenically mismatched naïve B6 mice (Ly5.1+), which were infected with LCMV. Polyfunctionality was assessed by (A) measuring the frequencies of donor cells coproducing IFN-γ, TNF-α, and IL-2 and by (B) determining the extent of degranulation, as marked by cell surface expression of CD107a/b by intracellular cytokine staining (ICCS) after 5 hours of in vitro stimulation of splenocytes with GP33-41 peptide in the presence of brefeldin A and monensin and CD107a/b antibodies. CD8WT and CD8CKO or CD8CTg cells were gated using CD8, Thy1.1, Thy1.2, and Ly5.1 markers. (A) Representative histogram plots (gated on IFN-γ+ donors) are shown for day 8 (peak) and day >30 (memory) after infection. Open histograms represent unstimulated controls, and filled histograms represent GP33-41–stimulated samples. Bold numbers in histograms indicate % IFN-γ+ donors that also produce TNF-α or IL-2. Italicized numbers indicate MFI of IFN-γ and TNF-α expression. Pie charts show mean ± SEM of %donor cells producing IFN-γ only (single producers), IFN- γ and TNF-α (double producers), or IFN- γ, TNF-α, and IL-2 (triple producers) at peak (day 8) and memory (>day 30). Results are representative of 4 independent experiments, with n ≥ 3 in each group for peak time point and 5 independent experiments, with n ≥ 3 in each group for memory time point. (B) Representative histogram plots and bar graphs of mean ± SEM of CD107a/b MFI on degranulating CD8 T cells are shown. Open histograms represent unstimulated controls, and filled histograms represent GP33-41–stimulated samples. Numbers in histograms indicate MFI of CD107a/b. Plots are representative of 2 independent experiments, with n ≥ 3 in each group for peak and memory. Unpaired Student t test was used for statistical significance.
Dysregulation of CD8 T-cell transcriptional profile upon changes in miR-17∼92 expression
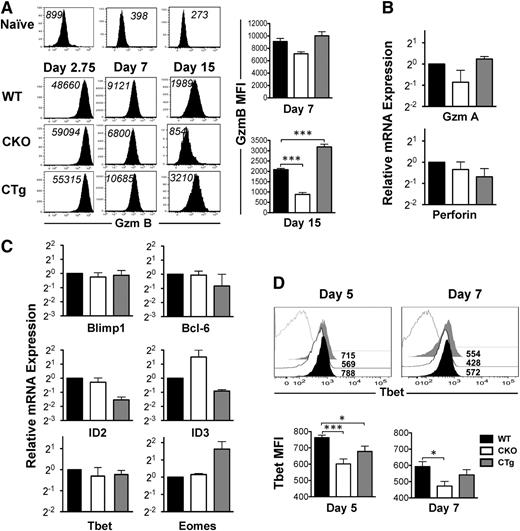
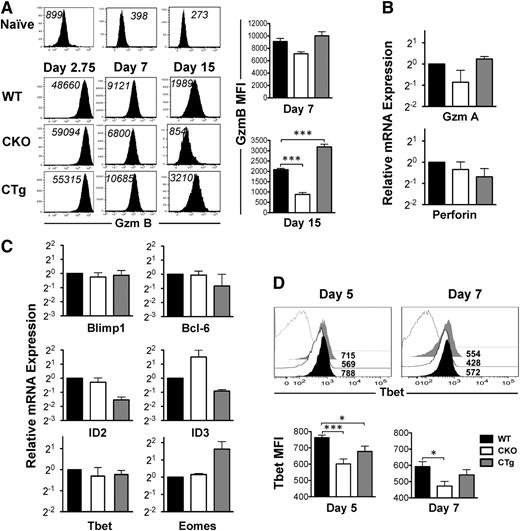
CD127 expression decreases as naïve cells differentiate into effectors. Because a large proportion of CD8CKO antigen-specific cells at the peak of CD8 T-cell expansion were CD127hi (Figure 3C), we wondered whether their differentiation into effectors was suboptimal and which transcription factors were affected by loss of miR-17∼92 expression. As shown in Figure 5A, similar to CD8WT cells, both CD8CKO and CD8CTg cells upregulated GZMB expression significantly from naïve levels as early as day 2.75 after infection. In addition to demonstrating potent effector differentiation, these observations also imply efficient expression of Cre by GZMB promoter, leading to successful loss or gain of miR-17∼92 expression in CD8CKO and CD8CTg cells, respectively, as observed in supplemental Figure 1D. Although GZMB expression was largely similar among CD8WT, CD8CKO, and CD8CTg cells at day 2.75 after infection, at day 7 after infection, CD8CTg cells expressed modestly higher levels of GZMB, and CD8CKO cells expressed slightly lower levels than CD8WT cells (Figure 5A). These trends gained statistical significance at day 15 after infection (Figure 5A), suggesting that the kinetics of downregulation of GZMB and conversion from effector to memory state was accelerated in CD8CKO cells and delayed in CD8CTg cells. Similar levels of mRNAs encoding other effector molecules such as granzyme A and perforin (Figure 5B) further reinforced potent effector differentiation of CD8WT, CD8CKO, and CD8CTg cells. Thus, CD127hiKLRG-1lo MPECs predominated in CD8CKO effector cells, despite strong expression of effector molecules.
Altered CD8 T-cell transcriptional profile upon gain or loss of expression of miR-17∼92. Effector status of wild-type, CKO, and CTg donor cells was assessed by analyzing the expression of effector molecules and specific transcription factors implicated in effector and memory fate specification. (A) Representative histogram plots of GZMB expression at days 2.75, 7, and 15 after infection are presented. CD8WT (Thy1,1+) and CD8CKO (Thy1.2+) or CD8CTg (Thy1.2+) P14 cells were cotransferred into congenically mismatched naïve B6 mice, which were infected with LCMV. For day 2.75 analysis, 106 naïve donors were adoptively transferred, and for days 7 and 15 analyses, 105 donors were used. MFI of GZMB expression is indicated in black. Adoptively transferred uninfected mice were used as controls to show the level of GZMB expression in naïve CD8 T cells. Bar charts represent mean ± SEM values of MFI of GZMB expression in gated donors at days 7 and 15 after infection. Results are representative of 2 independent experiments, with n ≥ 3 in each group. (B) Bar graphs show relative levels of GZMA and Perforin, mRNA in purified wild-type, CKO, and CTg donor cells at day 7 after infection. Data were normalized using glyceraldehyde 3-phosphate dehydrogenase (GAPDH) mRNA and represent 2 independent experiments. (C) Relative mRNA levels of Blimp, Bcl-6, ID2, ID3, eomesodermin, and T-bet in wild-type, CKO, and CTg CD8 T cells using quantitative reverse-transcriptase PCR are presented at day 7 after infection. Data from two independent experiments are presented as bar graphs of mean ± SEM relative mRNA levels, with wild-type mRNA levels normalized using GAPDH or HPRT controls. (D) T-bet expression in wild-type (black filled), CKO (black line), and CTg (gray filled) CD8 T cells was assessed at days 5 and 7 after infection in spleen. Numbers indicate MFI of T-bet expression and gray line histograms represent naïve controls. Mean ± SEM values of T-bet MFI on days 5 and 7 post infection are presented as bar graphs. Results are representative of 4 independent experiments, with n ≥ 2 to 3 per group. Unpaired Student t test was used for comparison of means.
Altered CD8 T-cell transcriptional profile upon gain or loss of expression of miR-17∼92. Effector status of wild-type, CKO, and CTg donor cells was assessed by analyzing the expression of effector molecules and specific transcription factors implicated in effector and memory fate specification. (A) Representative histogram plots of GZMB expression at days 2.75, 7, and 15 after infection are presented. CD8WT (Thy1,1+) and CD8CKO (Thy1.2+) or CD8CTg (Thy1.2+) P14 cells were cotransferred into congenically mismatched naïve B6 mice, which were infected with LCMV. For day 2.75 analysis, 106 naïve donors were adoptively transferred, and for days 7 and 15 analyses, 105 donors were used. MFI of GZMB expression is indicated in black. Adoptively transferred uninfected mice were used as controls to show the level of GZMB expression in naïve CD8 T cells. Bar charts represent mean ± SEM values of MFI of GZMB expression in gated donors at days 7 and 15 after infection. Results are representative of 2 independent experiments, with n ≥ 3 in each group. (B) Bar graphs show relative levels of GZMA and Perforin, mRNA in purified wild-type, CKO, and CTg donor cells at day 7 after infection. Data were normalized using glyceraldehyde 3-phosphate dehydrogenase (GAPDH) mRNA and represent 2 independent experiments. (C) Relative mRNA levels of Blimp, Bcl-6, ID2, ID3, eomesodermin, and T-bet in wild-type, CKO, and CTg CD8 T cells using quantitative reverse-transcriptase PCR are presented at day 7 after infection. Data from two independent experiments are presented as bar graphs of mean ± SEM relative mRNA levels, with wild-type mRNA levels normalized using GAPDH or HPRT controls. (D) T-bet expression in wild-type (black filled), CKO (black line), and CTg (gray filled) CD8 T cells was assessed at days 5 and 7 after infection in spleen. Numbers indicate MFI of T-bet expression and gray line histograms represent naïve controls. Mean ± SEM values of T-bet MFI on days 5 and 7 post infection are presented as bar graphs. Results are representative of 4 independent experiments, with n ≥ 2 to 3 per group. Unpaired Student t test was used for comparison of means.
To gain insight into miR-17∼92–related changes in the CD8 T-cell transcriptional milieu, we next quantified key counter-regulatory transcription factors involved in balancing the formation of MPECs and SLECs.38 Blimp1 increases formation of CD127loKLRG-1hi SLECs and enhances the expression of effector molecules such as IFN-γ and GZMB.26,39 Overexpression of Bcl-6, conversely, results in enhanced numbers of central memory cells.40 However, the levels of mRNAs encoding Bcl-6 and Blimp1 were largely similar in CD8WT, CD8CKO, and CD8CTg cells (Figure 5C). ID2 and ID3 promote CD8 T-cell survival during naïve-to-effector and effector-to-memory phases, respectively.38 Moreover, ID2 is required for formation of SLECs, whereas increased ID3 expression is associated with MPECs.41 Consistent with decreased survival of CD8CTg cells, we observed lower expression of ID2 and ID3 in CD8CTg cells compared with that in CD8WT cells. In contrast, ID3 was overexpressed in the absence of miR-17∼92 and correlated with increased proportion of MPECs in CD8CKO cells (Figure 5C). With respect to T-box transcription factor eomesodermin, which is required for CTL identity,38 we found that CD8WT and CD8CKO cells expressed similarly high levels of mRNA encoding eomesodermin. However, CD8CTg cells expressed about threefold higher eomesodermin mRNA levels than did CD8WT cells (Figure 5C), which is consistent with slightly higher GZMB expression. Although no significant differences in T-bet mRNA levels in CD8WT, CD8CKO, and CD8CTg cells were observed at day 7 after infection (Figure 5C), T-bet protein was expressed at significantly lower levels in CD8CKO cells compared with CD8WT cells at both days 5 and 7 after infection (Figure 5D). T-bet promotes the formation of CD127loKLRG-1hi SLECs.16 Thus, decreased expression of T-bet in CD8CKO cells is consistent with increased proportion of MPECs (Figure 3C). Collectively, these results demonstrate that gain or loss of miR-17∼92 expression after optimal T-cell activation does not alter the CD8 T-cell effector differentiation program but changes the transcriptional profile of antigen-specific cells to regulate their survivability, memory potential, and rate of conversion into memory.
miR-17∼92 regulates CD8 T-cell proliferation and PI3K-AKT-mTOR signaling
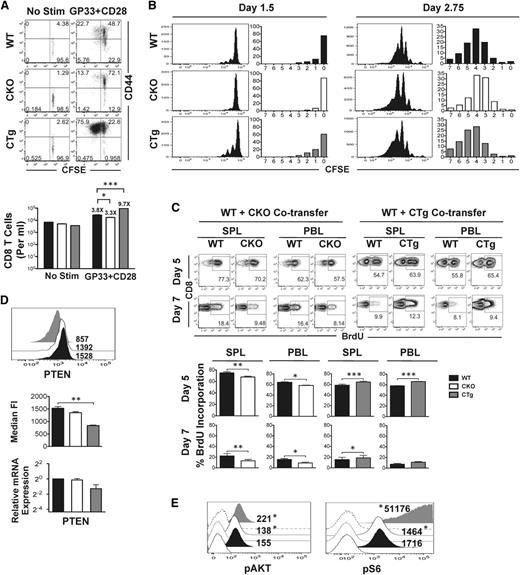
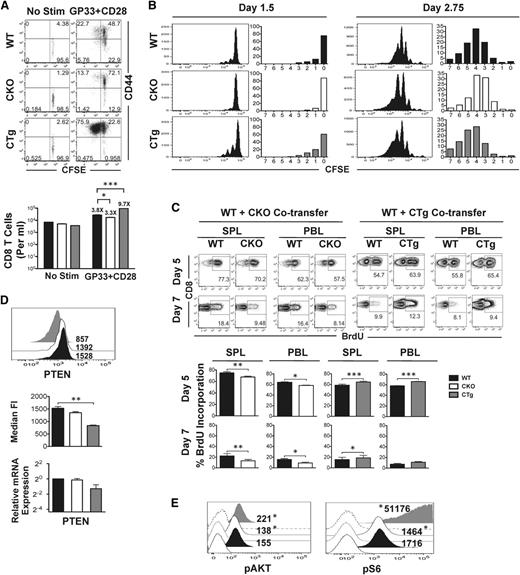
Data in Figure 1 suggested that miR-17∼92 may regulate terminal effector and memory fates by altering CD8 T-cell proliferation—MPECs expressed lower levels of miR-17∼92 than SLECs and proliferated less. Thus, we next sought to determine whether preferential formation of MPECs in the absence of mir-17∼92 was related to decreased proliferation. For this, we used CD8CKO and CD8CTg cells and measured antigen-specific proliferation in vitro after TCR stimulation (Figure 6A), or in vivo after infection with LCMV (Figure 6B). In both cases, we observed consistent reciprocal results: CD8CKO cells proliferated relatively less than CD8WT cells, whereas CD8CTg cells proliferated more. Despite largely similar activation (CD44 upregulation), the frequency of cells that had divided ≥1 was lower in CD8CKO and higher in CD8CTg cells (13.7% vs 75.9%, respectively) than CD8WT cells and correlated with fewer or more total numbers of CD8CKO and CD8CTg cells, respectively, recovered 60 hours after stimulation (Figure 6A).
Reciprocal effects of gain or loss of expression of miR-17∼92 on antigen-specific CD8 T-cell proliferation and signaling. (A) CD8WT and CD8CKO or CD8CTg P14 cells were labeled with CFSE and stimulated in vitro with GP33 and CD28 for 60 hours. Activation and proliferation of gated donor populations are presented as dot plots of CD44 vs CFSE. Mean ± SEM of antigen-specific CD8 T-cell numbers are plotted as bar graphs. Fold increase relative to unstimulated controls is listed above the respective bars. (B) 106 congenically mismatched CFSE-labeled CD8WT and CD8CKO or CD8CTg P14 cells were cotransferred into naïve mice, followed by LCMV infection. Cell proliferation was assessed by analyzing CFSE dilution at indicated days after infection. The frequencies of CD8 T cells in divisions 0 to 7 are summarized in bar graphs. Data are representative of 2 independent experiments, with n = 2 to 3 mice per experiment. (C) B6 mice containing 104 wild-type and CKO or wild-type and CTg P14 cells were administered 1 mg BrDU intraperitoneally at days 4.75 or 6.75 after infection. The frequency of BrDU incorporation for each population in spleen (SPL) and blood (PBL) was assessed in CD8+Thy1.1+ wild-type and CD8+Thy1.2+ CKO or CTg cells at days 5 and 7 after infection. Representative FACS plots of BrdU incorporation are presented, with mean ± SEM data plotted as bar graphs. Results are representative of 4 independent experiments, with n ≥ 3 in each group. Paired Student t test was used in each mouse to assess statistical significance. (D) 105 naive CKO (Thy1.2+) or CTg (Thy1.2+) P14 cells were adoptively transferred along with equal numbers of wild-type P14 (Thy1.1+) cells into naïve C57Bl/6 mice (Ly5.1+) that were subsequently infected with LCMV. Representative histogram plots with median fluorescence intensity of PTEN expression at day 7 after infection are presented. Average median fluorescence intensity of PTEN from 2 independent experiments, with n ≥ 3 in each group, is summarized in bar graph. Error bars represent SEM. Relative expression of PTEN mRNA in purified wild-type, CKO, and CTg CD8 T cells at day 7 post infection is also shown. Wild-type data were normalized using GAPDH control. Unpaired Student t test was used for statistical significance. (E) Histogram plots of pAKT and phosphoS6 expression in wild-type, CKO, and CTg P14 cells stimulated in vitro with GP33 and CD28 for 48 hours are presented as filled histograms. Shaded histograms represent expression of pAKT and phosphoS6 in unstimulated cells. Numbers indicate median fluorescence intensity of expression and are representative of 2 independent experiments. Probability binning algorithm in FlowJo was used to determine the T(x) metric for estimating the significance of difference between wild-type and CKO or wild-type and CTg populations (*P < .01).
Reciprocal effects of gain or loss of expression of miR-17∼92 on antigen-specific CD8 T-cell proliferation and signaling. (A) CD8WT and CD8CKO or CD8CTg P14 cells were labeled with CFSE and stimulated in vitro with GP33 and CD28 for 60 hours. Activation and proliferation of gated donor populations are presented as dot plots of CD44 vs CFSE. Mean ± SEM of antigen-specific CD8 T-cell numbers are plotted as bar graphs. Fold increase relative to unstimulated controls is listed above the respective bars. (B) 106 congenically mismatched CFSE-labeled CD8WT and CD8CKO or CD8CTg P14 cells were cotransferred into naïve mice, followed by LCMV infection. Cell proliferation was assessed by analyzing CFSE dilution at indicated days after infection. The frequencies of CD8 T cells in divisions 0 to 7 are summarized in bar graphs. Data are representative of 2 independent experiments, with n = 2 to 3 mice per experiment. (C) B6 mice containing 104 wild-type and CKO or wild-type and CTg P14 cells were administered 1 mg BrDU intraperitoneally at days 4.75 or 6.75 after infection. The frequency of BrDU incorporation for each population in spleen (SPL) and blood (PBL) was assessed in CD8+Thy1.1+ wild-type and CD8+Thy1.2+ CKO or CTg cells at days 5 and 7 after infection. Representative FACS plots of BrdU incorporation are presented, with mean ± SEM data plotted as bar graphs. Results are representative of 4 independent experiments, with n ≥ 3 in each group. Paired Student t test was used in each mouse to assess statistical significance. (D) 105 naive CKO (Thy1.2+) or CTg (Thy1.2+) P14 cells were adoptively transferred along with equal numbers of wild-type P14 (Thy1.1+) cells into naïve C57Bl/6 mice (Ly5.1+) that were subsequently infected with LCMV. Representative histogram plots with median fluorescence intensity of PTEN expression at day 7 after infection are presented. Average median fluorescence intensity of PTEN from 2 independent experiments, with n ≥ 3 in each group, is summarized in bar graph. Error bars represent SEM. Relative expression of PTEN mRNA in purified wild-type, CKO, and CTg CD8 T cells at day 7 post infection is also shown. Wild-type data were normalized using GAPDH control. Unpaired Student t test was used for statistical significance. (E) Histogram plots of pAKT and phosphoS6 expression in wild-type, CKO, and CTg P14 cells stimulated in vitro with GP33 and CD28 for 48 hours are presented as filled histograms. Shaded histograms represent expression of pAKT and phosphoS6 in unstimulated cells. Numbers indicate median fluorescence intensity of expression and are representative of 2 independent experiments. Probability binning algorithm in FlowJo was used to determine the T(x) metric for estimating the significance of difference between wild-type and CKO or wild-type and CTg populations (*P < .01).
Notably, in vivo proliferation data after infection were similar and remarkably consistent at different time-points; relative to CD8WT cells, lesser proliferation was detected in CD8CKO cells and greater proliferation was observed in CD8CTg cells at days 1 to 3 (Figure 6B) and days 5 to 7 after infection (Figure 6C). As tracked by CFSE labeling, fewer CD8CKO cells and more CD8CTg cells were in ≥1 round of cell division at day 1.5 compared with CD8WT cells. Likewise, CD8CKO and CD8CTg cells were fewer or, more respectively, in ≥5 rounds of division at day 2.75 after infection relative to CD8WT cells. Similarly, CD8CKO and CD8CTg cells exhibited lower and higher BrdU incorporation, respectively, at both days 5 and 7 after infection compared with the CD8WT counterparts in both spleen and blood (Figure 6C). The differences in cell proliferation of CD8CKO and CD8CTg cells were reinforced by absolute numbers of cells recovered (supplemental Figure 4). The differences in cell numbers were less apparent during days 1 to 3 after infection but were pronounced at days 5 to 7 after multiple rounds of proliferation.
The PI3K-AKT-mTOR signaling pathway critically regulates cell growth, survival, and cell cycle progression and is triggered in response to antigenic and cytokine stimulation. Several studies show that AKT-mTOR signal integration is central to regulation of effector and memory responses,42-46 and inhibition of mTOR inhibits terminal effector differentiation. Combined with previous reports that tumor suppressor PTEN, a negative regulator of PI3K, is a direct target of miR-17∼92 in T-cells,9,30 we next asked whether the effects of miR-17∼92 on cell proliferation were related to alterations of PI3K-AKT-mTOR signaling. Thus, we assessed levels of PTEN expression in CD8WT, CD8CKO, and CD8CTg cells direct ex vivo. We found significantly lower expression of PTEN in CD8CTg cells compared with CD8WT and CD8CKO cells. PTEN mRNA levels were also decreased in CD8CTg cells (Figure 6D). PD1, another negative regulator of PI3K, was also decreased upon constitutive expression of miR-17∼92 and increased upon its deletion (supplemental Figure 5). To determine the downstream effects of perturbations in PTEN expression on PI3K activity, we measured levels of its phosphorylated target, phosphoAKT (pAKT). Activation of PI3K-AKT induces upregulation of mTOR and its downstream effector ribosomal-subunit-6 kinase (S6K), leading to phosphorylation of ribosomal protein S6 (pS6). Thus, pS6 was also quantified as a measure of mTOR activation. Decreased expression of PTEN and PD1 and the associated release of PI3K inhibition in CD8CTg cells led to enhanced AKT-mTOR signaling as evidenced by increased levels of pAKT and pS6 compared with CD8CKO cells (Figure 6E).
Collectively, our observations provide strong evidence that miR-17∼92 exerts its effects on effector and memory fates by directly decreasing PTEN expression in antigen-specific CD8 T cells, thereby relieving inhibition on PI3K-AKT-mTOR signaling and cell cycle progression.
Discussion
Mechanisms by which memory fate decisions and terminal effector differentiation are regulated is an area of active investigation. This study offers novel, high-resolution miRNA expression profiling of CD8 T cells as they differentiate from naïve to effector and memory cells, with a further dissection of miRNA expression patterns between diversely-fated MPEC and SLEC effector subsets. This analysis identified miR-17∼92 as a potential regulator of several proliferation-related genes that are differentially expressed between MPECs and SLECs. Using both gain and loss of expression of miR-17∼92, specifically in CD8 T-cells, our studies provide definitive bifold evidence in support of a CD8 T-cell intrinsic role of miR-17∼92 in regulating signaling, proliferation, and survival during acute viral infection, thereby controlling the balance of memory and terminal effector differentiation in a CD8 T-cell–intrinsic manner.
While this manuscript was in review, a similar study reported increased miR-17∼92 expression in effector CD8 T cells.47 Our dissection of total effector CD8 T-cell pool into MPECs and SLECs confirmed this recent report and further revealed a preferential upregulation of miR-17∼92 cluster in SLECs compared with MPECs. miR-17∼92 expression in CD8 T cells promoted proliferation; consistently during the early, intermediate, and late stages of expansion, CD8CKO and CD8CTg cells exhibited decreased and increased proliferation respectively compared with CD8WT cells. These observations, along with those of Wu et al,47 are consistent with oncogenic properties of this locus and previously reported associations of malignancies, lymphoproliferation,48 and autoimmunity with overexpression.28 More striking differences in proliferation upon in vitro TCR stimulation, in absence of the inflammatory signals associated with infection, suggest that miR-17∼92 primarily affects TCR-driven CD8 T-cell expansion. Future studies involving deletion or overexpression of individual miRs (-17, -18a, -19a, -19b, -20a, and -92) will define the precise miR-17∼92 miRNAs that are important in regulating CD8 T-cell proliferation.
With respect to the effects of miR-17∼92 on cell survival, consistent with higher levels of Bcl-2 expression, CD8CKO cells exhibited decreased apoptosis and underwent relatively less contraction than did CD8WT cells. Conversely, CD8CTg cells expressed lower levels of Bcl-2 and their numbers declined progressively. Bim, a proapoptotic molecule, is a direct target of miR-17∼9230 in CD4 T cells. However, we did not observe significant alterations in Bim (data not shown) upon deletion or overexpression of miR-17∼92 in CD8 T cells. Consistent with decreased survival of CTg cells, we observed decreased expression of ID2 and ID3. In contrast, ID3 mRNA levels were higher in CKO cells and correlated with increased Bcl-2 and IL-7Rα. Thus, besides regulating proliferation, miR-17∼92 also affects survival through changes in Bcl-2, ID2, and ID3.
Our data suggest that miR-17-92 controls proliferation and survival by decreasing the expression of negative regulatory molecule PTEN, thereby releasing the brakes on the PI3K-AKT-mTOR signaling pathway. This reinforces findings by Wu et al47 and previous reports that PTEN is a direct target of miR-17∼92 in T cells.9,30 Consistent with previous reports43-46 that mTOR signaling correlates inversely with memory differentiation, our data show increased mTOR signaling and compromised memory differentiation on overexpression of miR-17∼92. Decreased mTOR signaling in the absence of miR-17∼92 may partially account for decreased expression of T-bet, a T-box transcription factor that drives effector CTL differentiation.16 Because T-bet mRNA was unaffected in the absence of miR-17∼92, it is likely that miR-17∼92 regulates T-bet expression at the protein level. Although no differences in Bcl-6 and Blimp-1 mRNA were observed, regulation at the protein expression level merits investigation. Moreover, the extracellular signals and transcriptional regulatory networks that differentially regulate miR-17∼92 expression in SLECs and MPECs remain to be discovered. Some key candidate transcription factors include c-Myc, a positive regulator of the miR-17∼92 cluster,49 and E2F family transcription factors.28 In addition, Bcl-6 is overexpressed in MPECs and has been shown to repress expression of miR-17∼92 in CD4 T cells.50
In conclusion, our studies present miR-17∼92 as a critical regulator of CD8 T-cell memory through control of proliferation. Deletion of miR-17∼92 led to faster acquisition of memory properties. Thus, manipulation of miR-17∼92 expression during immunization may be helpful in optimizing the quantity and quality of T-cell memory. We hope that our in vivo profiling studies along with miRNA profiling of in vitro51 cytokine-driven effector and memory differentiation will serve as a springboard for future investigations into the role of additional miRNAs in CD8 T-cell differentiation.
The online version of this article contains a data supplement.
The publication costs of this article were defrayed in part by page charge payment. Therefore, and solely to indicate this fact, this article is hereby marked “advertisement” in accordance with 18 USC section 1734.
Acknowledgments
The authors thank Drs Mary Poss (The Pennsylvania State University) and Avery August (Cornell University) for critically reading the manuscript.
This work was supported by research funding from the Pennsylvania State University (V.K. and S.S.).
Authorship
Contribution: A.A.K., L.A.P., and Y.Y. carried out experiments, analyzed data, and prepared figures; and V.K. and S.S. conceptualized the project, designed the experiments, carried out experiments, analyzed data, interpreted the results, prepared figures, wrote the manuscript, and supervised the work.
Conflict-of-interest disclosure: The authors declare no competing financial interests.
Correspondence: Vandana Kalia and Surojit Sarkar, W207 Millennium Science Complex, The Huck Institutes of the Life Sciences, The Pennsylvania State University, University Park, PA 16802; e-mail: sarkarkalia@gmail.com.

