Key Points
HIV-2 viral control is associated with a polyfunctional Gag-specific CD8+ T-cell response but not with perforin upregulation.
Our findings provide insight into cellular immune responses associated with a naturally contained human retroviral infection.
Abstract
While a significant proportion of HIV-2–infected individuals are asymptomatic and maintain undetectable viral loads (controllers), 15% to 20% progress to AIDS and are predicted by detectable viremia. Identifying immune correlates that distinguish these 2 groups should provide insights into how a potentially pathogenic retrovirus can be naturally controlled. We performed a detailed study of HIV-2–specific cellular responses in a unique community cohort in Guinea-Bissau followed for over 2 decades. T-cell responses were compared between controllers (n = 33) and viremic subjects (n = 27) using overlapping peptides, major histocompatibility complex class I tetramers, and multiparameter flow cytometry. HIV-2 viral control was significantly associated with a high-magnitude, polyfunctional Gag-specific CD8+ T-cell response but not with greater perforin upregulation. This potentially protective HIV-2–specific response is surprisingly narrow. HIV-2 Gag-specific CD8+ T cells are at an earlier stage of differentiation than cytomegalovirus-specific CD8+ T-cells, do not contain high levels of cytolytic markers, and exhibit low levels of activation and proliferation, representing distinct properties from CD8+ T cells associated with HIV-1 control. These data reveal the potential T-cell correlates of HIV-2 control and the detailed phenotype of virus-specific CD8+ T cells in a naturally contained retroviral infection.
Introduction
Nearly 3 decades after the identification of HIV-1, considerable progress has been made in understanding the mechanisms by which HIV evades and profoundly damages the immune system, but a vaccine that reliably prevents or controls HIV remains elusive. Important insights into correlates of protective immunity can be gained from studying simian immunodeficiency virus in animal models and human subjects infected with HIV-1 who do not develop immunodeficiency. One such model that has not been adequately investigated is infection with HIV-2. HIV-1 and HIV-2 share 30% to 60% sequence identity and show many similarities in their cytopathic potential and replication kinetics in vitro.1 A notable difference is the presence of Vpx in HIV-2, with possible implications for enhanced infection of dendritic cells (and therefore greater antigen presentation) in HIV-2 due to Vpx-mediated antagonism of the host restriction factor SAMHD1.2 Clinically, HIV-2 differs from HIV-1 in that a substantial proportion of infected people (approximately 37% in our cohort) maintain an undetectable plasma viral load (VL) for over a decade with no signs of immunodeficiency.3 Unlike the rare phenomenon of “elite control” in HIV-1 infection, this phenotype is both clinically stable and occurs more commonly than disease progression. Nevertheless, those with HIV-2 who develop disease (15%-20%) do so in a manner4 and time frame5 that cannot be distinguished clinically from HIV-1 infection. Identifying the key differences between these 2 groups at either end of the HIV-2 clinical spectrum should provide insights into the mechanisms by which humans can control infection with a potentially pathogenic retrovirus. Furthermore, recent data have suggested that preceding HIV-2 infection can limit the rate of disease progression and HIV-1 viral evolution following HIV-1 superinfection.6 As cross-reactive HIV-2 Gag-specific cytotoxic T-lymphocyte responses7,8 are a possible explanation for these observations, characterization of CD8+ T cells in HIV-2–infected subjects could aid our understanding of what would be required of a vaccine that could successfully contain HIV-1 via induction of T-cell responses.
We have previously shown that HIV-2–infected subjects with high CD4+ counts are more likely to preserve polyfunctional virus-specific T-cell responses than their HIV-1-infected counterparts,9,10 but whether these responses distinguish HIV-2 controllers from viremic progressors is not known. When the T-cell response toward the HIV-2 proteome was compared between these 2 groups, viral control was strongly associated with high-magnitude HIV-2 Gag-specific responses.11 However, this study was performed using ELISpot assays that did not distinguish between CD4+ and CD8+ responses, and further detailed phenotypic and functional characterization of this potentially protective response is lacking. Here, we present data from a study of HIV-2 Gag-specific T-cell responses from subjects selected to represent both controllers and viremic subjects in order to identify the cellular immune correlates of HIV-2 viral control. Our study arguably represents the most comprehensive analysis of HIV-2–specific T cells to date, including detailed ex vivo phenotypic analysis of CD8+ T cells targeting several immunodominant epitopes and direct comparison of both cytokine-mediated and cytotoxic functional capacity in HIV-2 controllers and viremic subjects.
Materials and methods
Study subjects
Antiretroviral-therapy–naïve HIV-2 monoinfected subjects from the Caió community cohort in rural Guinea-Bissau were recruited following informed consent. This cohort was established in 1989 and has followed HIV-2 infected individuals identified via community serosurveys for over 2 decades.12 CD4+ T-cell subset analysis was performed using fresh whole-blood staining with 2-color immunofluorescence reagents (anti-CD45/anti-CD4) and a CyFlow-SL flow cytometer (Partec). Peripheral blood mononuclear cells (PBMCs) were cryopreserved. Confirmation of HIV-2 status was undertaken using a diagnostic algorithm involving both serological and molecular methods.11 HIV-2 plasma VLs were quantified using an in-house reverse transcriptase polymerase chain reaction assay as previously described (with a lower limit of detection of 100 copies per mL).13 Ethical approval was provided by the joint Medical Research Council (MRC)/Gambia Government Ethics Committee and the Guinea-Bissau Ministry of Health.
HLA class I genotyping on subjects in this cohort was performed during previous studies using sequencing.14 This study was conducted in accordance with the Declaration of Helsinki.
Peptide–major histocompatibility complex class I tetramers
Generation of peptide/HLA class I tetramers conjugated to streptavidin and phycoerythrin (PE; Sigma-Aldrich) was performed according to previously described protocols.15 The tetramers used were HLA-B*3501-NPVPVGNIY, B*5801-TSTVDEQIQW, B*5301-TPYDINQML, B14-DRFYKSLRA (HIV-2 Gag p26), A*0201-NLVPMVATV (cytomegalovirus [CMV] pp65), B*3501-EPLPQGQLTAY, and B*0801-RAKFKQLL (Epstein-Barr virus [EBV] BZLF1).
Antibodies
The following directly conjugated monoclonal antibodies were used: CD107a-PECy5, CD4-APCefluor780, IFN-γ-PECy7, tumor necrosis factor α (TNF-α)–eFluor 450, interleukin 2 (IL-2)–PE, CD27-APCe780, CD160–eFluor 647 (eBioscience); CD8-ECD (Beckman Coulter); Perforin-FITC (clone D48, Gen-Probe); CD3-Qdot655, CD4-Qdot605, CD8-Qdot705, CD45RO–Texas red PE (Invitrogen); CD14-V500, CD19-V500, granzyme B-Alexa Fluor 700, Ki67–Alexa Fluor 488, Bcl-2–V450 (BD Biosciences); CD38-APC, 2B4(CD244)-PECy5.5 (clone C1.7), PD-1–PECy7 (clone EH12.2H7), T-bet brilliant violet (clone 4B10), HLA-DR–Alexa Fluor 700 (Biolegend). LIVE/DEAD fixable Aqua Dead Cell Stain (for 405 nm excitation) was obtained from Invitrogen. Unconjugated CD57 monoclonal antibody (clone NK-1, BD Biosciences) was conjugated in our laboratory to Quantum dot 565 obtained from Invitrogen.
Intracellular cytokine stimulation and polychromatic flow cytometry
Assays were performed at the MRC Laboratories in The Gambia and cells analyzed using a CyAn flow cytometer (Dako, Beckman Coulter). Overlapping peptide sets representing entire HIV-2 Gag (n = 70) and Env (n = 107) proteins11 were used for stimulations. Freshly thawed, cryopreserved PBMCs were resuspended in RPMI supplemented with 10% heat-inactivated fetal calf serum, 2 mM l-glutamine (Sigma-Aldrich), 1% PenStrep (Sigma-Aldrich) (R10), and 60 µg/mL DNase solution (Type IV, Sigma-Aldrich) for 15 minutes at 37°C. Cells were washed and resuspended in R10 and rested overnight at a concentration of 106/mL, after which 5 × 10⁵ live PBMCs (determined by trypan blue exclusion) were stimulated with overlapping Gag (and where adequate cells were available, Env) peptide pools at 2 µg/mL (each peptide) and costimulatory antibodies anti-CD28 and anti-CD49 (BD Biosciences) at 1 µg/mL. Cells stimulated with Staphylococcus enterotoxin B (SEB; Sigma) at 2 µg/mL and costimulatory antibodies alone were also included. Following incubation for 1 hour at 37°C, brefeldin A (3 µg/mL) and monensin (2 µM) (eBioscience) and surface stain for CD107a were added. Following a further 5-hour incubation, cells were stained with Aqua, CD4, and CD8 antibodies. Cells were then fixed and permeabilized (Cytofix/Cytoperm; BD Biosciences) and stained intracellularly for interferon γ (IFN-γ), TNF-α, IL-2, and perforin. Perforin staining was excluded in an additional SEB-stimulated condition used for flow-minus-one staining to aid with subsequent gating.
Electronic compensation was performed using the BD CompBead anti–mouse immunoglobulin set (BD Biosciences) and antibodies described above. Between 300 000 and 400 000 events were acquired for each sample. Data analysis was performed using FlowJo version 9.1 (Treestar). Forward scatter (FSC)-area versus FSC-height parameters were used to exclude cell aggregates, followed by exclusion of dead cells and gating on lymphocytes using FSC and side scatter properties (supplemental Figure 1). CD4+ and CD8+ T cells were identified. Boolean/combinatorial gate arrays were created using each measured marker (CD107a, IFN-γ, TNF-α, IL-2, and perforin), which determined the frequency of each response pattern based on all possible combinations. Responses detected in the negative (anti-CD28/anti-CD49d) control were subtracted from responses observed in stimulated samples for each response individually prior to further analysis. In cases where the stimulated sample value is smaller than that of the anti-CD28/anti-CD49d control, negative values arise. These were set to 0. To avoid systematic bias with this approach, a threshold was set below which all positive values were also zeroed on the assumption that the distribution of background values is symmetric around 0.16 This threshold (0.009 for the CD8+ and 0.01 for the CD4+ data set) was chosen based on the distribution of negative values for each data set of twice the 90th centile.
Tetramer staining and polychromatic flow cytometry
Assays were performed at the Weatherall Institute of Molecular Medicine (Oxford) and cells analyzed with an LSRII flow cytometer (BD). Cryopreserved PBMCs were thawed as described above. A total of 1 × 10⁶ live PBMCs were stained with Aqua for 30 minutes at 4°C followed by 1 µg of tetramer-PE for 15 minutes at 37°C. Surface staining with CD3-Qdot655, CD4-Qdot605, CD8-Qdot705, CD14-V500, CD19-V500, CD27–eFluor 780, CD45RO–Texas red PE, CD57-Qdot565, and PD-1–PECy7, as well as 2B4-PECy5.5 and CD160–eFluor 647 in panel 1 and CD38-APC and HLA-DR–Alexa Fluor 700 in panel 2, was performed. Following fixing and permeabilization, intracellular staining with perforin-FITC, granzyme B–Alexa Fluor 700, and T-bet brilliant violet in panel 1 and Ki67–Alexa Fluor 488 and Bcl-2–V450 in panel 2 were done. Flow-minus-one samples were included to aid gating during subsequent flow cytometric analysis.
Electronic compensation was performed as described above. Between 500 000 and 1 000 000 events were acquired for each sample. FSC area and FSC height were used to exclude cell aggregates, followed by removal of CD14+, CD19+, dead cells, and gating on CD3+ cells. FSC and side scatter were then used to gate on small lymphocytes, followed by isolation of CD8+ cells and tetramer-staining cells (supplemental Figure 2). Boolean/combinatorial gate arrays were created to measure the coexpression of PD-1, 2B4, and CD160.
Statistical analysis
Statistical analyses were performed using GraphPad Prism version 5.0 for Macintosh (GraphPad Software). Comparisons between variables were performed using the Mann-Whitney U test, Kruskal-Wallis test with Dunn’s post test for multiple comparisons, or the Wilcoxon matched pairs test. Discrete data were compared by the χ2 test or Fisher’s exact test. Correlations between nonnormally distributed data were made using the Spearman’s rank correlation coefficient.
Results
Study subjects
Sixty HIV-2–monoinfected individuals were recruited. Clinical and demographic parameters are described in Table 1. HIV-2 controllers were defined as asymptomatic individuals with a current undetectable VL (<100 copies per mL). The predominantly female and older age of the subjects may be due to an increased risk of HIV-2 acquisition in older women17 and higher non–HIV-related mortality in men in sub-Saharan Africa.18
HIV-2 control is significantly associated with greater magnitude and polyfunctionality of the Gag-specific CD8+ T-cell response
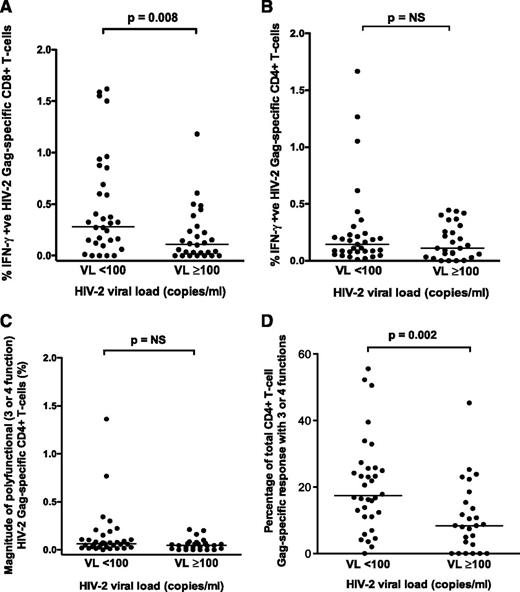
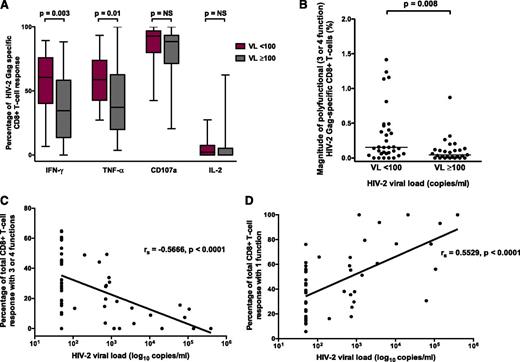
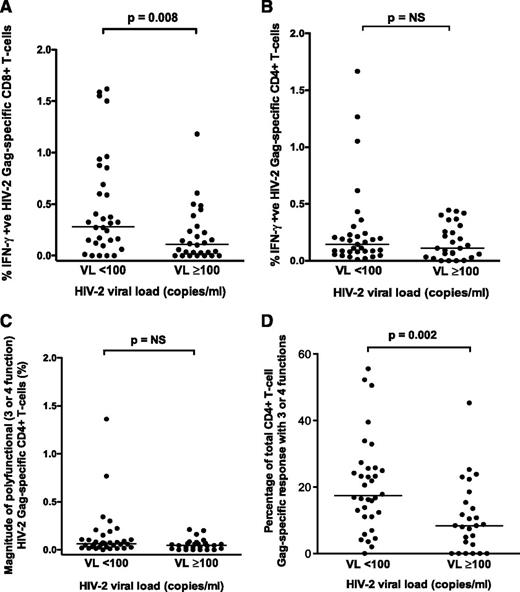
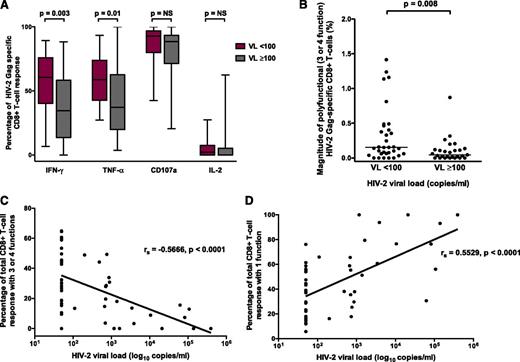
The magnitude of the CD8+ (but not CD4+) Gag-specific IFN-γ response differentiated HIV-2 controllers from viremic individuals (P = .008; Figure 1A-B). Although the magnitude of polyfunctional CD4+ T cells was similar between the 2 groups, the proportion of the total CD4+ response expressing ≥3 functions was significantly higher in HIV-2 controllers (Figure 1C-D). A greater proportion of the Gag-specific CD8+ response consisted of IFN-γ– and TNF-α–producing cells in controllers (Figure 2A). The frequency of polyfunctional CD8+ T cells was significantly higher in controllers (Figure 2B), and polyfunctionality correlated inversely with plasma VL (Figure 2C). In contrast, the proportion of the CD8+ T-cell response made up of monofunctional cells increased with higher VL (Figure 2D). No significant association was observed between CD4+ count and the CD8+ IFN-γ response or polyfunctionality (supplemental Figure 3). Using median fluorescence intensity (MFI) of each parameter as a proxy for the amount of cytokine produced per cell, we also observed, as previously described,10 that polyfunctional Gag-specific CD8+ T cells secreted more IFN-γ (supplemental Figure 4) and TNF-α, but not CD107a or IL-2 (data not shown), than their “less functional” counterparts.
Comparison of HIV-2 Gag-specific responses. Comparison of HIV-2 Gag-specific CD8+ (A) and CD4+ (B) IFN-γ responses in HIV-2 controllers (n = 33) and viremic subjects (n = 27) (2-tailed Mann-Whitney U test). Comparison of polyfunctional (3- or 4-function) Gag-specific CD4+ T-cell responses in HIV-controllers (n = 33) and viremic subjects (n = 27) is displayed as percentage of polyfunctional Gag-specific CD4+ T-cells (C) and proportion of the total Gag-specific CD4+ response that is polyfunctional (D) (2-tailed Mann-Whitney U test). Bars represent medians. NS, not significant.
Comparison of HIV-2 Gag-specific responses. Comparison of HIV-2 Gag-specific CD8+ (A) and CD4+ (B) IFN-γ responses in HIV-2 controllers (n = 33) and viremic subjects (n = 27) (2-tailed Mann-Whitney U test). Comparison of polyfunctional (3- or 4-function) Gag-specific CD4+ T-cell responses in HIV-controllers (n = 33) and viremic subjects (n = 27) is displayed as percentage of polyfunctional Gag-specific CD4+ T-cells (C) and proportion of the total Gag-specific CD4+ response that is polyfunctional (D) (2-tailed Mann-Whitney U test). Bars represent medians. NS, not significant.
HIV-2 viral control is associated with polyfunctionality of the Gag-specific CD8+ T-cell response. (A) Proportion of response made up by different factors in HIV-2 controllers (VL < 100) and viremic subjects (VL ≥ 100). (B) Magnitude of polyfunctional Gag-specific CD8+ T cells in HIV-2 controllers and viremic subjects (2-tailed Mann-Whitney U test). (C) Inverse correlation between CD8+ polyfunctionality and HIV-2 VL. (D) Direct correlation between CD8+ monofunctionality and HIV-2 VL (Spearman’s rank correlation coefficient). All comparisons included n = 33 HIV-2 controllers and n = 27 viremic subjects. NS, not significant.
HIV-2 viral control is associated with polyfunctionality of the Gag-specific CD8+ T-cell response. (A) Proportion of response made up by different factors in HIV-2 controllers (VL < 100) and viremic subjects (VL ≥ 100). (B) Magnitude of polyfunctional Gag-specific CD8+ T cells in HIV-2 controllers and viremic subjects (2-tailed Mann-Whitney U test). (C) Inverse correlation between CD8+ polyfunctionality and HIV-2 VL. (D) Direct correlation between CD8+ monofunctionality and HIV-2 VL (Spearman’s rank correlation coefficient). All comparisons included n = 33 HIV-2 controllers and n = 27 viremic subjects. NS, not significant.
HIV-2 Env-specific responses (measured in 25 HIV-2 controllers and 14 viremic subjects) were almost exclusively from CD8+ T cells (data not shown). No significant difference in the magnitude of the Env-specific CD8+ IFN-γ response was observed between the 2 groups (supplemental Figure 5). Gag-specific CD8+ responses were more polyfunctional than Env-specific responses, although this difference was primarily found in HIV-2 controllers (supplemental Figure 6).
The HIV-2 Gag-specific CD8+ T-cell response is highly focused and often absent in viremic individuals
Peptide–major histocompatibility complex (MHC) class I tetramers specific for 4 immunodominant HIV-2 Gag epitopes in this cohort11 were used to determine the phenotype of HIV-2–specific CD8+ T cells (HLA B53, B58, B35, and B14 restricted). Cytotoxic T lymphocytes targeting 2 of these epitopes (B35 and B58 restricted) are also known to recognize the equivalent regions in HIV-1.7,8 A total of 31 individuals with B53, B58, B35, or B14 alleles were included (supplemental Table 1, a total of 35 tetramer-staining experiments). Also included were 5 CMV-specific and 8 EBV-specific tetramer-staining populations. Frequencies of all tetramer-staining populations are detailed in supplemental Table 2.
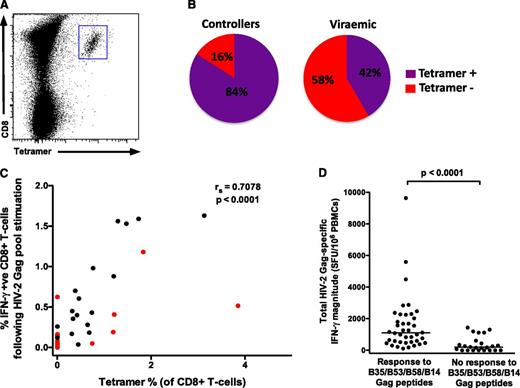
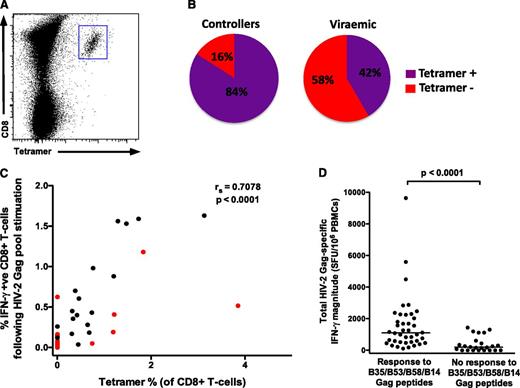
A greater proportion of HIV-2 controllers compared with viremic subjects had tetramer-staining populations (84% vs 42%, P = .02; Figure 3B). This is an important observation, but it prevented a meaningful comparison of HIV-2–specific CD8+ T-cell phenotype between the 2 groups, and therefore all HIV-2 populations were analyzed together (25 tetramer-staining populations from 21 HIV-2–infected individuals: 16 controllers, 5 viremic). We observed a strong correlation (r = 0.71) between the magnitude of the CD8+ IFN-γ response to the total Gag pool (by intracellular cytokine stimulation) and the percentage of tetramer-staining T cells in each subject (Figure 3C), suggesting that the bulk of the Gag-specific response in these subjects is accounted for by CD8+ T cells targeting 1 or more of these epitopes. We then reanalyzed previously reported IFN-γ ELISpot data from the same cohort, generated using a 3-dimensional peptide matrix.11 The total Gag pool-specific magnitude was significantly greater in individuals who responded to ≥1 of these 4 HIV-2 Gag epitopes (40 of 64, 62.5%) than to those who did not (Figure 3D; median interquartile range [IQR]) 1103 (524-2081) SFU per mL vs 195 (0-481) SFU per mL, thus confirming the remarkable immunodominance of these epitopes. Furthermore, of the individuals who displayed B53-, B58-, B35-, or B14-restricted responses, 32 of 40 (80%) responded to only 1 of these peptides. This represents an incredibly restricted breadth in the HIV-2–specific Gag response shown to be associated with viremic control.
HIV-2 Gag-specific CD8+T cells enumerated by peptide-MHC class I tetramers reveal a highly focused response. (A) Example of tetramer staining. (B) A greater proportion of HIV-2 controllers (16 of 19) have detectable immunodominant Gag-specific tetramer populations than viremic individuals (5 of 12) (P = .02). (C) A significant correlation exists between tetramer-positive cells and the IFN-γ response to the total Gag pool (n = 31; viremic donors in red; Spearman’s rank correlation coefficient). Where 2 different tetramer responses were present (in 4 subjects), these were added together. (D) The total Gag-specific IFN-γ response (as measured by ELISpot assays) according to presence or absence of responses to the 4 immunodominant epitopes (n = 64; data reanalyzed from Leligdowicz et al11 ; 2-tailed Mann-Whitney U test).
HIV-2 Gag-specific CD8+T cells enumerated by peptide-MHC class I tetramers reveal a highly focused response. (A) Example of tetramer staining. (B) A greater proportion of HIV-2 controllers (16 of 19) have detectable immunodominant Gag-specific tetramer populations than viremic individuals (5 of 12) (P = .02). (C) A significant correlation exists between tetramer-positive cells and the IFN-γ response to the total Gag pool (n = 31; viremic donors in red; Spearman’s rank correlation coefficient). Where 2 different tetramer responses were present (in 4 subjects), these were added together. (D) The total Gag-specific IFN-γ response (as measured by ELISpot assays) according to presence or absence of responses to the 4 immunodominant epitopes (n = 64; data reanalyzed from Leligdowicz et al11 ; 2-tailed Mann-Whitney U test).
Control of HIV-2 viremia is not associated with CD8+ T cells with high cytotoxic potential
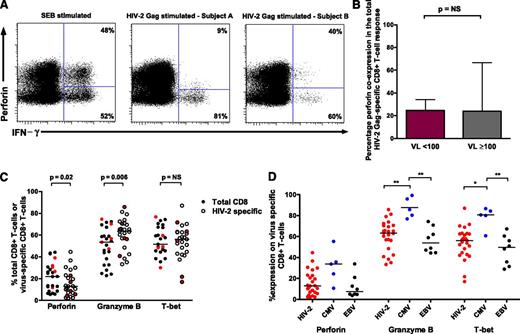
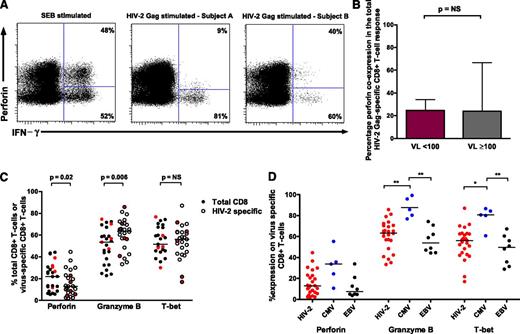
HIV-1 control is associated with the capacity of HIV-1–specific CD8+ T cells to express perforin on antigen stimulation as well as enrichment of other cytolytic markers.19,20 We explored whether similar qualities are required for HIV-2 control. Although perforin coexpression (with 1 or more of IFN-γ, TNF-α, IL-2, and CD107a20 ) was readily identifiable following both SEB and Gag stimulation, this did not differentiate HIV-2 controllers from viremic subjects (Figure 4A-B). We also assessed the degree of ex vivo perforin, granzyme B, and T-bet expression in virus-specific CD8+ T cells. When compared with bulk CD8+ T cells, HIV-2–specific T cells showed modest increases in granzyme B, similar expression of T-bet, and lower levels of perforin (Figure 4C). Expression levels on viremic donor cells did not cluster together. CMV-specific CD8+ T cells displayed significantly higher granzyme B and T-bet expression than HIV-2– and EBV-specific T cells (Figure 4D). Analysis of T-bet MFI revealed a similar picture (data not shown).
Perforin upregulation does not define HIV-2 control and high cytotoxic potential is not a feature of HIV-2–specific CD8+T cells. (A) CD8+ T cells coexpressing perforin and IFN-γ are detectable following SEB stimulation, with varying proportions observed following HIV-2 Gag stimulation (example plots). (B) No difference was observed between HIV-2 controllers (n = 33) and viremic subjects (n = 27) in the degree of perforin coexpression (with IFN-γ, TNF-α, IL-2, or CD107a) following stimulation with overlapping Gag peptides (2-tailed Mann-Whitney U test). Displayed are medians and upper IQR. (C) Comparison of cytolytic markers on bulk CD8+ and HIV-2 Gag-specific CD8+ T cells (n = 25 tetramer-positive populations from 21 HIV-2 subjects: 16 controllers and 5 viremic donors; 2-tailed Wilcoxon matched pairs test). Values from viremic donors are highlighted in red. (D) Comparison of cytolytic markers on different virus-specific CD8+ T cells (Kruskal-Wallis test with Dunn’s post test for multiple comparisons). Bars represent medians. **P < .01; *P < .05. NS, not significant.
Perforin upregulation does not define HIV-2 control and high cytotoxic potential is not a feature of HIV-2–specific CD8+T cells. (A) CD8+ T cells coexpressing perforin and IFN-γ are detectable following SEB stimulation, with varying proportions observed following HIV-2 Gag stimulation (example plots). (B) No difference was observed between HIV-2 controllers (n = 33) and viremic subjects (n = 27) in the degree of perforin coexpression (with IFN-γ, TNF-α, IL-2, or CD107a) following stimulation with overlapping Gag peptides (2-tailed Mann-Whitney U test). Displayed are medians and upper IQR. (C) Comparison of cytolytic markers on bulk CD8+ and HIV-2 Gag-specific CD8+ T cells (n = 25 tetramer-positive populations from 21 HIV-2 subjects: 16 controllers and 5 viremic donors; 2-tailed Wilcoxon matched pairs test). Values from viremic donors are highlighted in red. (D) Comparison of cytolytic markers on different virus-specific CD8+ T cells (Kruskal-Wallis test with Dunn’s post test for multiple comparisons). Bars represent medians. **P < .01; *P < .05. NS, not significant.
HIV-2–specific CD8+ T cells display an earlier differentiated phenotype
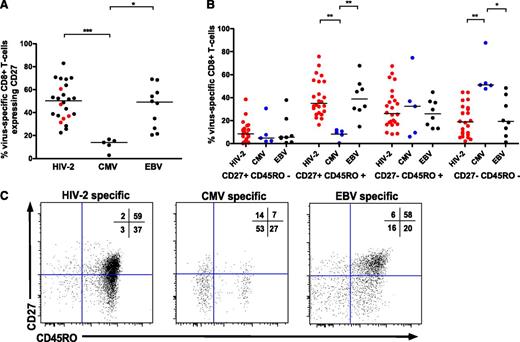
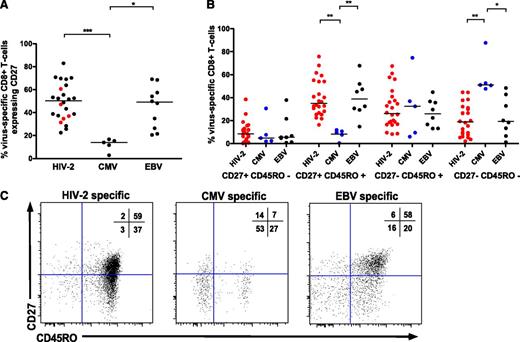
Previous studies have shown significant heterogeneity in the phenotype of CD8+ T cells specific for different chronic viral infections.21,22 HIV-2–specific CD8+ T cells displayed greater CD27 expression than CMV-specific CD8+ T cells (Figure 5A,C), representing T cells at an earlier stage of differentiation. No clear pattern was observed in controllers vs viremic donor cells (Figure 5A). While CMV-specific T cells tended to display a “terminal effector” phenotype of CD27−/CD45RO−, HIV-2–specific and EBV-specific T cells were more frequently CD27+/CD45RO+ (Figure 4B-C). No significant difference was seen in antigen-specific CD8+ T-cell senescence based on expression of CD57 (data not shown).
HIV-2–specific CD8+T cells display an earlier differentiated phenotype than CMV-specific CD8+T cells. CD27 (A) and CD27/CD45RO (B) coexpression according to viral specificity. ***P < .001; ** P < .01; *P < .05 (Kruskal-Wallis test with Dunn’s post test for multiple comparisons). HIV-2–specific CD8+ populations (n = 25) are derived from 21 HIV-2 subjects (n = 16 controllers, n = 5 viremic donors). CD27% expression on cells from viremic donors is highlighted in red in panel A. (C) Examples of CD27/CD45RO distribution of HIV-2–, CMV-, and EBV-specific CD8+ T cells, with percentage distribution in each quadrant displayed.
HIV-2–specific CD8+T cells display an earlier differentiated phenotype than CMV-specific CD8+T cells. CD27 (A) and CD27/CD45RO (B) coexpression according to viral specificity. ***P < .001; ** P < .01; *P < .05 (Kruskal-Wallis test with Dunn’s post test for multiple comparisons). HIV-2–specific CD8+ populations (n = 25) are derived from 21 HIV-2 subjects (n = 16 controllers, n = 5 viremic donors). CD27% expression on cells from viremic donors is highlighted in red in panel A. (C) Examples of CD27/CD45RO distribution of HIV-2–, CMV-, and EBV-specific CD8+ T cells, with percentage distribution in each quadrant displayed.
HIV-2–specific CD8+ T cells display high levels of PD-1, 2B4, and CD160 expression
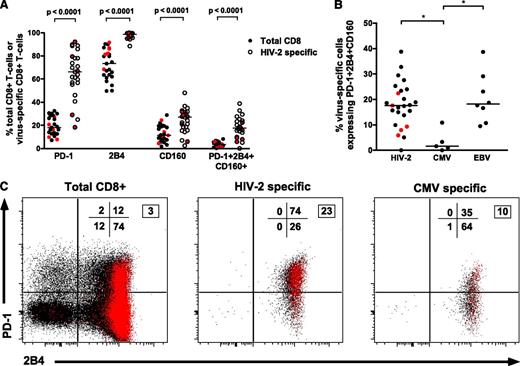
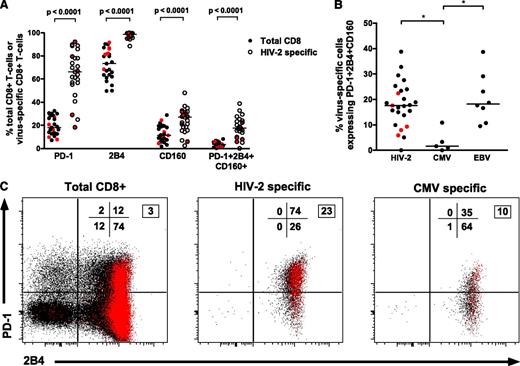
Recent data have defined a relationship between coexpression of multiple inhibitory receptors (PD-1/2B4/CD160) on HIV-1–specific CD8+ T cells and higher viremia, suggesting these represent a “hyperexhausted” cellular phenotype.23 However, HIV-2–specific CD8+ T-cell populations (largely from individuals with undetectable VLs and polyfunctional Gag responses) have surprisingly higher levels of PD-1/2B4/CD160 coexpression than bulk CD8+ populations (Figure 6A). Furthermore, a significant direct correlation was observed between coexpression of PD-1/2B4/CD160 and the magnitude of the Gag-specific IFN-γ response (r = 0.48, P = .027; supplemental Figure 7). CMV-specific CD8+ T cells displayed significantly lower coexpression of inhibitory receptors (Figure 6B-C). We therefore hypothesized that PD-1/2B4/CD160 expression may be related to cellular differentiation status. Accordingly, a strong correlation was observed between both PD-1 expression as well as PD1/2B4/CD160 coexpression with CD27+CD45RO+CD8+ T cells (supplemental Figure 8) (r = 0.69, P = .0002 and r = 0.75, P < .0001, respectively).
HIV-2–specific CD8+T-cells show high levels of PD-1, 2B4, and CD160 coexpression despite low VLs. (A) Higher expression of inhibitory receptors on HIV-2–specific CD8+ T cells when compared with intrapatient bulk CD8+ populations (n = 25 tetramer-positive populations from 21 HIV-2 subjects: 16 controllers and 5 viremic donors; 2-tailed Wilcoxon matched pairs test). Values from viremic donors are highlighted in red. (B) Comparison of PD-1+2B4+CD160+ coexpression on different virus-specific CD8+ T cells showing significantly lower coexpression on CMV-specific CD8+ T cells when compared with HIV-2–specific or EBV-specific CD8+ T cells. *P < .05 in a Kruskal-Wallis test with Dunn’s post test for multiple comparisons. Values from viremic donors are highlighted in red. (C) Example of inhibitory receptor expression on total CD8+, HIV-2–specific, and CMV-specific CD8+ T cells from a single donor. Red dots represent cells coexpressing CD160 in addition to PD-1 and/or 2B4. Percentage distribution in each quadrant is displayed (PD-1 vs 2B4), with the boxed number denoting percentage of cells coexpressing all 3 markers.
HIV-2–specific CD8+T-cells show high levels of PD-1, 2B4, and CD160 coexpression despite low VLs. (A) Higher expression of inhibitory receptors on HIV-2–specific CD8+ T cells when compared with intrapatient bulk CD8+ populations (n = 25 tetramer-positive populations from 21 HIV-2 subjects: 16 controllers and 5 viremic donors; 2-tailed Wilcoxon matched pairs test). Values from viremic donors are highlighted in red. (B) Comparison of PD-1+2B4+CD160+ coexpression on different virus-specific CD8+ T cells showing significantly lower coexpression on CMV-specific CD8+ T cells when compared with HIV-2–specific or EBV-specific CD8+ T cells. *P < .05 in a Kruskal-Wallis test with Dunn’s post test for multiple comparisons. Values from viremic donors are highlighted in red. (C) Example of inhibitory receptor expression on total CD8+, HIV-2–specific, and CMV-specific CD8+ T cells from a single donor. Red dots represent cells coexpressing CD160 in addition to PD-1 and/or 2B4. Percentage distribution in each quadrant is displayed (PD-1 vs 2B4), with the boxed number denoting percentage of cells coexpressing all 3 markers.
HIV-2–specific CD8+ T cells display low levels of activation and proliferation ex vivo
Generalized cellular immune activation correlates with both VL and disease progression in HIV-1 and HIV-2,24-26 but activation and proliferation of HIV-2–specific CD8+ T cells is less well characterized. CD38+Ki67+ coexpression was low on HIV-2–specific CD8+ T cells and not significantly higher when compared with intrapatient bulk CD8+ T cells (median percentage [IQR] 2.49 [1.47, 3.5] vs 1.71 [1.33, 2.33], P = .194, 2-tailed Wilcoxon matched test; supplemental Figure 9a). Interestingly, a significant inverse correlation was observed between CD38 expression on HIV-2–specific T cells and the percentage CD8+ IFN-γ response following Gag pool stimulation (rs = −0.5104, P = .01; supplemental Figure 9b). A similar relationship was not observed between CD38 expression on bulk CD8+ T cells and the IFN-γ response (rs = −0.2176, P = .235; supplemental Figure 9c), suggesting activation of HIV-2–specific CD8+ T cells per se may have a detrimental effect on function. Previous work has proposed that an increased susceptibility to apoptosis in CD8+ T cells expressing high levels of CD38 may result in a failure to control HIV-1 replication.27 Accordingly, a strong inverse correlation was seen between CD38 expression and presence of Bcl-2, an antiapoptotic marker, on HIV-2–specific CD8+ T cells (rs = −0.618, P = .001; supplemental Figure 9d).
Discussion
A key factor in designing an effective T-cell vaccine for HIV-1 infection is the clear identification of immune correlates associated with viremic control. Strong class I HLA associations28 and the association of a broad Gag-specific T-cell response with lower VLs29 implicate CD8+ T cells as a crucial element of HIV-1 control. Nevertheless, the failure of the Merck Ad5-HIV vaccine30 demonstrates that the goal of an effective anti–HIV-1 T-cell vaccine remains elusive. HIV-2 infection provides an alternative model of natural HIV control, yielding important insights into HIV pathogenesis and viral control in humans. The current study provides detailed information about the qualities of CD8+ T cells associated with natural HIV-2 control.
Using IFN-γ ELISpots, we have previously highlighted the association between the magnitude of HIV-2 Gag-specific T-cell responses and undetectable VL.11 We now demonstrate that this correlation is largely due to the CD8+ response. CD8+ T-cell polyfunctionality is associated with HIV-2 control, a feature shared with HIV-1–specific CD8+ T cells from HIV-1 controllers.31,32 The quality (but not magnitude) of the CD4+ T-cell response may, however, be important: HIV-2 controllers had a greater proportion of polyfunctional CD4+ T cells in the Gag-responsive population than viremic subjects. The contribution of CD4+ help by secretion of cytokines such as IL-21 was also not assessed and may play a role.33 The importance of immunodominant Gag-specific responses in HIV-1 control has also been shown, but requires large studies to demonstrate a significant association.29,34 The hierarchical dominance of Gag-specific responses in HIV-2 is, however, more profound.11 Responses against HIV-2 Env (the second most commonly targeted HIV-2 protein11 ) did not define viral control and further highlighted the greater polyfunctionality of Gag-specific responses in HIV-2 controllers. Our data also suggest that an HLA-B*3501–restricted HIV-2 p26 epitope (NPVPVGNIY) is commonly targeted and may contribute to viral control. Interestingly, HLA-B*3501 is associated with higher HIV-1 VLs and more rapid disease progression in HIV-1 clade B infection28 but protective outcomes in clade C infection.35 The difference appears to be the greater Gag-directed response in clade C–infected HLA-B*3501–positive subjects (specifically targeting the p24 epitope NPPIPVGDIY),36 a situation seemingly paralleled in HIV-2 infection.
Maintaining a substantial breadth of T-cell responses is considered important in HIV-1 control and is associated with greater polyfunctionality and virus inhibition.37 This requirement for broad host responses, as a result of HIV-1 diversity and adaptation, poses a significant challenge for HIV-1 vaccine design. Our data suggest a stark contrast in HIV-2 infection, where CD8+ T cells responding to a single HIV-2 epitope can be responsible for almost the entire Gag-specific response in a particular subject. Furthermore, whereas the persistence of high levels of tetramer-staining CD8+ T cells is frequently observed in HIV-1 infection despite high viremia,38 immunodominant Gag-specific CD8+ T-cell populations are often not detectable in viremic HIV-2 subjects.
Different chronic viral infections are characterized by virus-specific CD8+ T cells displaying a particular cellular phenotype,21 and, accordingly, their effector functions vary. Several studies demonstrate that rare HIV-1 controllers possess HIV-1–specific CD8+ T cells that are highly differentiated, with downregulation of markers such as CD27 and CD45RO,19,39,40 whereas others have shown no difference in cellular phenotype between controllers and progressors.41 Highly differentiated CD8+ T-cell subsets described in some HIV-1 controllers also have the ability to rapidly upregulate cytotoxic granule contents on stimulation and express higher levels of the transcription factor T-bet.19,20,42 Surprisingly, we find that HIV-2–specific CD8+ T cells (largely from individuals with low or undetectable VLs) are characterized by low levels of preloaded cytotoxic molecules and that rapid upregulation of perforin after Gag stimulation does not distinguish HIV-2 controllers from viremic subjects. In keeping with this observation, HIV-2–specific CD8+ T cells are of an earlier differentiated phenotype. Interestingly, cell supernatant alone from HIV-2–specific CD8+ T-cell clone cultures are able to partially suppress HIV-2 replication in CD4+ T-cell lines (A.L., unpublished data). Further functional studies evaluating both the cytolytic activity and suppressive capacity of soluble factors secreted from primary HIV-2–specific CD8+ T cells are required.
Studies exploring the relationship between antigen burden and cellular differentiation offer a potential explanation for the earlier differentiation phenotype of HIV-2–specific CD8+ T cells.43,44 Using both ex vivo antigen-specific CD8+ T-cell analysis and a model of in vitro T-cell priming, our previous study suggests that higher viral burden drives T-cell differentiation in HIV infection through greater immune activation.43 Consistent with these data, HIV-1 seroconverters with higher VL set points have greater frequencies of differentiated effector memory HIV-1–specific CD8+ T cells and higher activation levels.44 Although studies of acute HIV-2 infection are lacking, it is likely that the VL set point of HIV-2 controllers is low, which may explain the persistent CD27 expression observed in chronic infection. The low activation levels observed in HIV-2–specific CD8+ T cells in our current study are also in keeping with this hypothesis. Furthermore, we find high coexpression of PD-1/2B4/CD160 on HIV-2–specific CD8+ T cells. Although robust data exist to suggest an inhibitory role for these markers in HIV-1 disease,23 our findings support previous work suggesting PD-1 upregulation may also reflect changes in cellular differentiation45,46 and does not affect the ability of CD8+ T cells to secrete cytokines in healthy adults.46
How could HIV-2–specific CD8+ responses with a limited specificity control HIV-2 for decades? Highly functional but narrow responses remain beneficial only if viral escape does not occur, resulting in uncontrolled viral replication in the absence of responses to other regions. Despite the fitness costs associated with mutation, escape from Gag-specific CD8+ T-cell responses is frequently seen in HIV-1 infection. Selection analyses comparing HIV-1 and HIV-2 env47 and gag (T.d.S., unpublished data) reveal that HIV-2 is under greater negative selective pressure than HIV-1, suggesting far greater functional and structural constraints are imposed on HIV-2. CD8+ T-cell epitope escape in HIV-2 has not been described, and viral sequences from individuals with potent Gag-specific responses (and therefore selective pressure) show a high degree of conservation in respective epitopes.48 Thus, low VL set points and a functionally constrained virus may allow the persistence of initial CD8+ T-cell responses targeting conserved epitopes, which can contribute to viral control for years.
Our study is relatively limited by being based in a single cohort, although the long follow-up in a genetically homogeneous population infected with the same HIV-2 group (A) is also a major strength that is difficult to reproduce in HIV-1 controller cohorts. It would be important to corroborate our findings in subjects with different HLA allele distributions. A key limitation worth discussing is the difficulty in determining whether the potent responses observed represent the cause of HIV-2 viral control or if they simply a reflect an undamaged immune system due to limited viral replication secondary to other factors. We fail to show an association between CD4+ counts (a marker of immunodeficiency) and the HIV-2 Gag-specific CD8+ T-cell response, which may argue for a causative role. Alternative strategies to explore this problem may be helpful. Studying the evolution of HIV-2–specific CD8+ responses and VLs in HIV-2 controllers who acquire HIV-1 superinfection (ie, suffer further immunologic damage) may provide some insight. Such studies would also be key in determining whether T-cell responses, such as those described in this study, are responsible for attenuating the course of acute HIV-1 in HIV-1/2 dually infected subjects6 via cross-recognition of HIV-1 epitopes. The strongest evidence for a causative role could be established by achieving control of HIV-2 in viremic individuals via immunotherapeutic strategies designed to induce CD8+ T-cell responses. Such measures could provide proof-of-concept for future induction of HIV-1 immune-mediated control and allow valuable lessons to be learned. It may also provide a therapeutic option for clinical care of HIV-2–infected subjects, who are often disadvantaged by suboptimal ART regimens, compounded by the lack of reliable drug procurement in resource-limited settings.
The online version of this article contains a data supplement.
The publication costs of this article were defrayed in part by page charge payment. Therefore, and solely to indicate this fact, this article is hereby marked “advertisement” in accordance with 18 USC section 1734.
Acknowledgments
The authors are grateful to the Caió population for their participation in the study and Caió field station staff for their role in subject recruitment. The authors would like to acknowledge Ramu Sarge Njie for excellent management of the HIV diagnostics and Pa Saidou Chaw for assistance with the HIV-2 VLs. The authors also thank Abdoulie Jabang and Bakary Sanneh for technical assistance with sample processing. The authors acknowledge Matt Cotten for his supervision of HIV molecular diagnostics and helpful advice on study design and data interpretation. The authors are also grateful to Shauna Mullaly and the biomedical engineering team at the MRC Gambia for vital support during fieldwork and sample transport. The authors acknowledge Nicola Smith and Helen Ferry for help with flow cytometry panels and Andrew McMichael for critical review of the manuscript. The authors are also grateful to Robin Weiss for support and advice during all stages of the work.
This work was supported by a UK MRC clinical research training fellowship (G0701313) (T.I.d.S.).
Authorship
Contribution: T.I.d.S. designed the study, undertook subject recruitment, performed experiments, analyzed data, and wrote the manuscript; Y.P. designed and performed experiments and wrote the manuscript; A.L. performed data analysis and wrote the manuscript; I.Z. designed the experiments and wrote the manuscript; L.L. and H.G. undertook patient recruitment, processed samples, and wrote the manuscript; M.-E.B. designed the experiments and wrote the manuscript; T.V. and M.S. designed the study, undertook subject recruitment, and wrote the manuscript; L.-M.Y. performed experiments and wrote the manuscript; C.v.T. designed the study, undertook subject recruitment, and wrote the manuscript; P.E. undertook subject recruitment, helped with data interpretation and wrote the manuscript; A.J. helped design the study and interpret the data and wrote the manuscript; H.W. helped design the study and interpret the data and wrote the manuscript; T.D. designed experiments, helped with data analysis and interpretation, and wrote the manuscript; and S.L.R.-J. designed the study and experiments, undertook data interpretation, and wrote the manuscript.
Conflict-of-interest disclosure: The authors declare no competing financial interests.
Correspondence: Thushan I. de Silva, Academic Department of Immunology and Infectious Diseases, Department of Infection and Immunity, The University of Sheffield Medical School, Sheffield, United Kingdom; e-mail: thushandesilva@hotmail.com.

