Abstract
Common dendritic cell progenitors (CDPs) in the bone marrow (BM) regenerate dendritic cells (DCs) in lymphoid and nonlymphoid tissues. How the dissemination of progenitor-derived DCs to peripheral tissues is regulated on need remains elusive. Microbes are sensed by pathogen recognition receptors such as Toll-like receptors (TLRs). We found that CDPs in the BM express TLR2, TLR4, and TLR9. On TLR stimulation, CDPs down-regulated CXCR4, the nonredundant chemokine receptor for their BM retention, up-regulated CCR7, and migrated to lymph nodes (LNs). When TLR agonists were injected locally, CDPs preferentially gave rise to DCs in inflamed LNs in expense of noninflamed LNs and the BM, but they did not alter their lineage differentiation and proliferative activity. Consequently, BM DC progenitors can sense TLR agonists and, via regulation of CXCR4 and CCR7, support the replenishment of DCs in reactive LNs. This mechanism likely developed to support DC homeostasis on specific need at sites of inflammation.
Introduction
Dendritic cells (DCs) are the key antigen-presenting cells involved in both the maintenance of tolerance and induction of immunity. Multiple subsets of DCs have been identified in lymphoid and nonlymphoid tissues of which 2 major populations are classic DCs (cDCs) and plasmacytoid DCs (pDCs).1 cDCs reside within lymphoid organs and express high levels of CD11c, intermediate levels of major histocompatibility complex class II (MHC II), and efficiently present antigen to naive T cells.2 pDCs are located in lymph nodes (LNs), spleen, BM, and liver; have a spherical shape; are CD11cint CD45RA+; and produce large amounts of type I interferons on viral infections.3
Most DCs have a short half-life and are continuously replenished from hematopoietic stem and progenitor cells (HSPCs) in the BM.4,5 Recent studies provide a detailed understanding of the sequential progenitors that lead to the generation of DCs in steady state. Macrophage and DC progenitors (MDPs)6 develop into monocytes, macrophages, and common DC progenitors (CDPs).7,8 CDPs are DC-restricted progenitors,7,9 giving rise to pDCs and pre-DCs10 that further differentiate to cDCs8 and some nonlymphoid tissue DCs.11-13 The key cytokines that drive the generation of distinct DC subsets in vivo are fms-related tyrosine kinase 3 ligand (Flt3L), granulocyte macrophage–colony stimulating factor (CSF), and macrophage CSF (M-CSF).1,4,14,15
The migration of differentiated tissue DCs to LNs has been addressed in multiple studies. In steady state, DCs from peripheral tissues (such as the skin) travel to draining LNs via afferent lymphatics, have a CD11cint MHC IIhi phenotype, and are referred to as migratory DCs (MigDCs).16,17 pDCs, cDCs, and their progenitors can enter LNs from the blood via high endothelial venules (HEVs).8,16 For both routes of entry, the chemokine receptor CCR7 plays a crucial role.17-19 CCR7 is expressed by DCs and naive/central memory T cells.16 Its ligands CCL21 and CCL19 are present on afferent lymphatics, HEVs, and in the T-cell zones.16 On inflammation, DCs up-regulate CCR720-23 and endothelial cells increase secretion of CCR7-ligands,19,24 both of which contribute to increased recruitment of DCs.
In steady state, CDPs reside in the BM and locally give rise to pDCs and pre-DCs.8,10 Pre-DCs subsequently leave the BM to generate DCs in nonlymphoid tissues, or they enter LNs via HEVs in a CD62L-dependent manner.8 HSPCs are retained in the BM by the chemokine receptor CXCR4 and its ligand CXCL12 (SDF-1),25,26 and the injection of the CXCR4 antagonist AMD3100 leads to mobilization of HSPCs to the blood.27,28 During inflammation, CXCL12 is down-regulated, and activated neutrophils secrete proteases that cleave CXCR4 and CXCL12, both inducing the mobilization of HSPCs from the BM.26,29,30 However, to date little is known about the migration of BM DC progenitors during systemic inflammation.
Immune and stroma cells sense pathogen-associated molecular patterns (PAMPs) of invading microbes via pattern-recognition receptors.31 Toll-like receptors (TLRs) are pattern-recognition receptors that are integrated into cellular membranes and detect exogenous pathogens.31 TLR triggering leads to cell activation and production of inflammatory cytokines.32 Recent studies indicate that human33-35 and mouse HSPCs36-38 express TLRs. Once pathogens spread from a local site of infection to the blood, they can act directly on BM cells.38 In fact, systemically injected lipopolysaccharide (LPS) binds to TLR4 on HSPCs in the BM.36 Although the effects of TLR triggering on mature cells are well defined, little is known about the biologic relevance of TLR expression on HSPCs. Recent studies suggest that direct sensing of TLR agonists by HSPCs may skew their lineage differentiation toward myeloid cells and DCs.34-36,38 TLR activation of circulating HSPCs was further suggested to induce a migratory arrest and differentiation at sites of inflammation.37
Given these observations, we hypothesized that DC progenitors in the BM may express TLRs and systemically spreading PAMPs may induce their migration to replenish DCs at the primary site of inflammation.
Methods
Mice
Sex- and age-matched, 6- to 10-week-old C57BL/6-KA-CD45.1 or C57BL/6-KA-CD45.2 wild-type (WT) mice were used, if not stated otherwise. Of these mice, CD45.1xCD45.2 mice in F1 generation were interbred. CCR7-deficient CD45.2+ animals (CCR7−/−) were provided by M. Lipp (Max-Delbrück-Center for Molecular Medicine, Berlin, Germany).18 The mice were bred and maintained at the Institute for Research in Biomedicine, Bellinzona and the University Hospital Zurich animal facilities, and they were treated in accordance with guidelines of the Swiss Federal Veterinary Office. The experiments were approved by the Dipartimento della sanità e della socialità del cantone Ticino and the Gesundheitsdirektion Kanton Zuerich, Veterinaeramt.
Antibodies
All antibodies were purchased from eBiosciences or BioLegend, unless stated otherwise. The following monoclonal antibodies were used: CD3ϵ (145-2C11), CD4 (RM4-5), CD8α (53-6.7), CD11b (M1/70), CD11c (N418), CD16/CD32 FcγR-III/II (2.4G2; BD Biosciences), CD19 (ID3), CD34 (Ram34), CD45RA (14.8; BD Biosciences), CD45.1 (A20), and CD45.2 (104) CD44 (IM7; BD Biosciences), CD62L (MEL-14), CCR7 (4B12), CXCR3 (220803; R & D Systems), CXCR4 (2B11), B220 (RA3-6B2), c-kit (2B8), Flt3 (A2F10), Gr-1 (RB6-8C5), IL7Rα (A7R34), M-CSFR (AFS98), MHC II (M5/114.15.2; BD Biosciences), NK1.1 (PK136; BD Biosciences), Sca-1 (D7 or E13-161.7; BD Biosciences), Ter119 (Ter119), TLR2 (6C2), TLR4 (MTS510), and TLR9 (M9.D6). The antibodies were directly conjugated to fluorochromes, or if biotinylated they were visualized using fluorochrome-conjugated streptavidin. Cells were stained in FACS buffer (PBS, 2% FBS, and 2mM EDTA), and for chemokine- and Toll-like receptors after blocking Fc-receptor binding with anti-CD16/CD32. For intracellular staining of TLR9, cells were fixed and permeabilized using the Cytofix/Cytoperm kit (BD Biosciences).
Cell sample preparation
BM samples were prepared as described previously.39 In brief, long bones and spines were smashed with mortar and pestle, filtered, and density gradient centrifuged with Histopaque-1077 (Sigma-Aldrich). Spleens and LNs were mashed and digested for 30 minutes at 37°C with 10 U/mL DNase-I and 1 mg/mL Collagenase D (Roche Diagnostics). Red blood cells of spleen and blood samples were lysed in 150mM ammonium chloride and 10mM potassium hydrogen carbonate. Before cell sorting, samples were immunomagnetically preselected. For BM progenitors, cells positive for lineage antigens (Lin; CD3ϵ, CD4, CD8α, CD19, CD11b, B220, Gr-1, NK1.1, and Ter119) were stained with PE-Cy5–conjugated antibodies, labeled with anti–Cy5-MicroBeads (Miltenyi Biotec), and negatively selected with MACS LS-columns and MidiMACS Separators (Miltenyi Biotec). For spleen or LN DCs, samples were stained with anti–CD11c-APC, labeled with anti–APC-MicroBeads (Miltenyi Biotec), and enriched for CD11c. For the analysis of mice that were adoptively transferred with CDPs, BM and spleen samples were immunomagnetically pre-enriched for CD11c by staining with CD11c-PECy7 and anti–PE-MicroBeads (Miltenyi Biotec) to increase the detection of CDP-derived CD11c+ cells.
FACS and analysis
Cell populations were sorted and analyzed with an FACSAria or FACSCanto2 (both BD Biosciences) according to the following cell surface phenotypes:4,7,8,39 LSK cells, Lin− c-kithi Sca-1+; CMP, Lin− IL7Rα− c-kithi Sca-1− CD34+ CD16/32lo; granulocyte-macrophage progenitor (GMP), Lin− IL7Rα− c-kithi Sca-1− CD34+ CD16/32hi; megakaryocyte-erythrocyte progenitor (MEP), Lin− IL7Rα− c-kithi Sca-1− CD34− CD16/32lo; common lymphoid progenitor (CLP), Lin− c-kitint Flt3+ IL7Rα+; CDP, Lin− c-kitint Flt3+ IL7Rα− M-CSFRhi/low+; pre-DC, Lin(*)− CD11c+ MHC II− [Lin(*): CD3, CD19, B220, NK1.1, and Ter119]; pDC, CD19− NK1.1− CD11cint CD45RA+; and cDC, CD19− NK1.1− CD45RA− CD11chi MHC IIint. From LNs, DC populations were additionally defined as CD19− NK1.1− CD45RA− CD11cint CD40hi MHC IIhi, and CD19− NK1.1− CD45RA− CD11chi CD40int MHC IIint. Dead cells were excluded by propidium iodide staining (Invitrogen). For analysis, 1 × 10⁶ to 8 × 10⁶ cells were acquired, and the data were analyzed with the use of FlowJo Version 9.3.0 software (TreeStar). For the analysis of endogenous CDPs or pre-DCs, 35 μg of TLR agonists (see “In vitro TLR agonist stimulation”) was injected intravenously, 100 μg of AMD3100 (Plerixafor; Genzyme) was injected subcutaneously. PBS was injected as control, respectively.
Quantitative RT-PCR
Cell populations sorted ex vivo or after culture in vitro were resuspended in TRIzol-LS reagent (Invitrogen), and RNA was extracted. Remaining DNA was eliminated by DNase I treatment using the DNA-free kit (Applied Biosystems). For cDNA synthesis equal amounts of RNA were reverse transcribed using SuperScript-III (Invitrogen). Quantitative real-time PCR was performed on a 7900HT Fast System (Applied Biosystems) using TaqMan primers and probes for Rn18s (Hs99999901_s1), Tlr2 (Mm00442346_m1), Tlr4 (Mm00445274_m1), Tlr9 (Mm0046193_m1), Cxcr4 (Mm01292123_m1), and Ccr7 (Mm00432608_m1). Results were normalized to Rn18s.
In vitro TLR agonist stimulation
FACS-sorted CDPs were cultured in RPMI 1640 (Invitrogen) supplemented with 10% FBS (Invitrogen), 2% penicillin-streptomycin (Invitrogen), GlutaMAX (Invitrogen), 50 ng/mL mouse Flt3L, 10 ng/mL SCF, and 20 ng/mL M-CSF (R&D Systems) and stimulated for 12 and 21 hours with 10 μg/mL Pam3csk4 (InvivoGen), 10 μg/mL ultrapure LPS from Escherichia coli 0111:B4 (InvivoGen), or 5 μg/mL CpG-ODN1826 (Microsynth). In some experiments, CDPs were stimulated with Pam3csk4 or CpG for 2 hours in vitro in medium containing 50 ng/mL mouse Flt3L, and the cells were subsequently transferred in vivo as indicated.
In vivo adoptive transfer assays
CDPs (2-3 × 10⁵) were isolated by FACS from the BM of female CD45.1+, CD45.2+ WT, or CD45.2+ CCR7−/− mice. The cells were labeled for 8 minutes with 2μM CFSE at 37°C and adoptively transferred intravenously into 3-week-old CD45.1xCD45.2 female F1 nonirradiated hosts. In some experiments, 25 μg of CpG or PBS was subcutaneously injected into one of the front foot pads immediately after adoptive transfer of the cells. In this case, brachial and axillary LNs from the injected and the noninjected side were analyzed. For the analysis of mice that were adoptively transferred with CDPs, BM and spleen samples were enriched for CD11c to increase the detection of CD11c+ DC-offspring. In addition to the enriched samples, nonenriched samples were acquired by flow cytometry to assess CD11c− CDP-offspring (data not shown). For samples from subcutaneous LNs, total cells from the LNs were acquired without prior enrichment.
Statistics
The data were analyzed for statistical significance with the use of 2-tailed, unpaired t tests using Prism 4 software (GraphPad Software). P was considered significant at values < .05.
Results
CDP express TLR2, TLR4, and TLR9
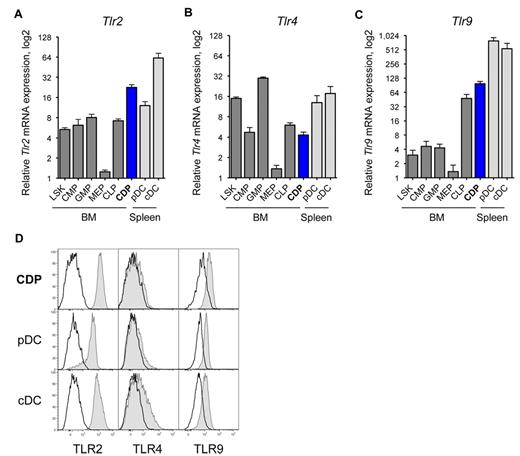
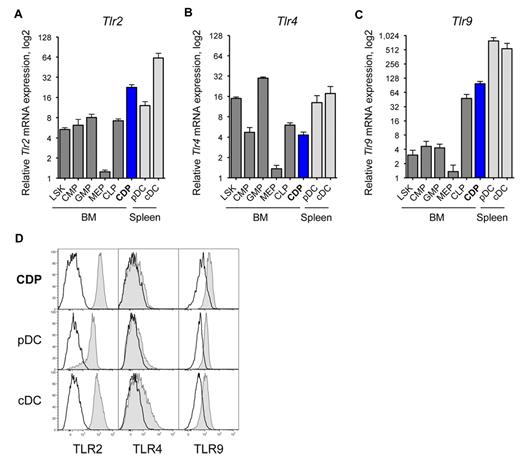
We used quantitative real-time PCR to assess the Tlr mRNA expression in CDPs. CDPs expressed relatively high levels of Tlr2, that is, within the range of splenic DCs, and ∼ 3-fold higher than other BM progenitors (Figure 1A). CDPs expressed moderate levels of Tlr4, at magnitudes similar to CMPs and CLPs, but less than LSK cells, GMPs, or splenic DCs (Figure 1B). CDPs expressed intermediate levels of Tlr7, similar to LSK cells, and higher than CMPs and GMPs, but lower than CLPs, or splenic DCs (data not shown). CDPs expressed relatively high levels of Tlr9, 2-fold higher than CLPs, and more than 10-fold higher than other BM progenitors, but lower than splenic DCs (Figure 1C). On the protein level, CDPs in the BM expressed relative high amounts of surface TLR2 and intracellular TLR9, at levels comparable to spleen pDC and cDCs (Figure 1D). Furthermore, CDPs expressed low TLR4 surface protein, at levels similar to pDCs, and cDCs express intermediate levels of TLR4. The TLR protein expression of pre-DCs and other hematopoietic progenitor cells in the BM is shown in supplemental Figure 1 (available on the Blood Web site; see the Supplemental Materials link at the top of the online article). Interestingly, pre-DCs, the immediate progeny of CDPs, expressed relatively high levels of TLR2 and TLR9 protein, comparable to CDPs, and low levels of TLR4. In conclusion, CDPs express high levels of TLR2 and TLR9 and intermediate levels of TLR4, both for mRNA and protein.
CDPs express TLR2, TLR4, and TLR9. The relative mRNA expression of Tlr2 (A), Tlr4 (B), and Tlr9 (C) is shown for progenitor populations (dark gray) and CDPs (blue) sorted from steady-state mouse BM, and pDCs and cDCs from the spleen (light gray). Progenitors included LSK cells containing stem cells and multipotent progenitors, CMP,46 GMP, MEP, and CLP.47 Populations were isolated by FACS, mRNA expression was determined by quantitative real-time PCR, and levels were normalized to Rn18s. Results on mRNA show means and SEM of 4 independent experiments, including independent cell sorts and real-time PCR runs, and they are plotted on a bilogarithmic scale (log 2). Histograms show surface TLR2 and TLR4 protein expression, and intracellular expression of TLR9 (gray filled histograms), overlaid with isotype-matched control stains (black line) of BM CDPs and spleen pDCs and cDCs (D). The data show 1 representative experiment of 3 independent experiments.
CDPs express TLR2, TLR4, and TLR9. The relative mRNA expression of Tlr2 (A), Tlr4 (B), and Tlr9 (C) is shown for progenitor populations (dark gray) and CDPs (blue) sorted from steady-state mouse BM, and pDCs and cDCs from the spleen (light gray). Progenitors included LSK cells containing stem cells and multipotent progenitors, CMP,46 GMP, MEP, and CLP.47 Populations were isolated by FACS, mRNA expression was determined by quantitative real-time PCR, and levels were normalized to Rn18s. Results on mRNA show means and SEM of 4 independent experiments, including independent cell sorts and real-time PCR runs, and they are plotted on a bilogarithmic scale (log 2). Histograms show surface TLR2 and TLR4 protein expression, and intracellular expression of TLR9 (gray filled histograms), overlaid with isotype-matched control stains (black line) of BM CDPs and spleen pDCs and cDCs (D). The data show 1 representative experiment of 3 independent experiments.
Chemokine receptor and migratory marker expression by CDPs
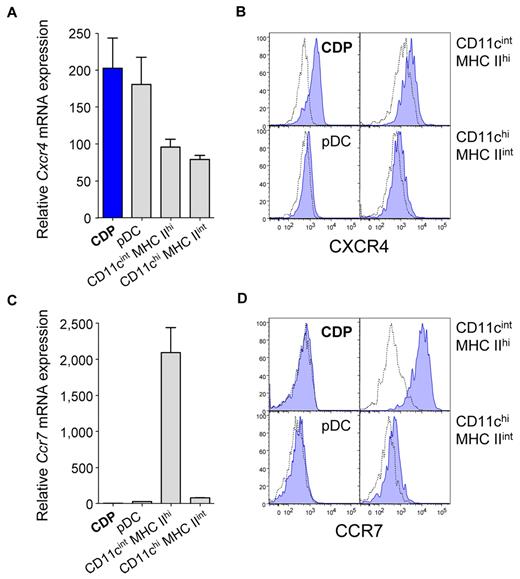
Because triggering of the expressed TLRs may influence their migratory behavior, we examined the chemokine receptor expression of CDPs in steady state. Compared with DCs isolated from LNs, CDPs in the BM expressed relatively high levels of Cxcr4 mRNA and protein (Figure 2A-B). In contrast, CDPs expressed low levels of Ccr7 mRNA, just above the limit of detection (Figure 2C), and no surface protein (Figure 2D). The expression of Ccr7 mRNA and protein was the highest for CD11cint MHC IIhi DCs, whereas CD11chi MHC IIint DCs and pDCs expressed intermediate to low levels. Furthermore, CDPs express CD62L and CD44, but they were negative for CXCR3 and CD11c (see Onai et al7 ; data not shown). Therefore, CDPs in steady state display a migratory marker profile typical of BM-resident HSPCs, such as CXCR4 and CD44, but they do not express markers of differentiated DCs, such as CCR7 or CXCR3.16
CDPs express CXCR4 but no detectable levels of CCR7. The expression of the chemokine receptors Cxcr4 (A-B) and Ccr7 (C-D) was determined for CDPs that were isolated by FACS from steady-state BM and for indicated DCs from subcutaneous LNs. Bar graphs show Cxcr4 (A) and Ccr7 (C) mRNA expression of CDPs (blue), pDCs, CD11cint MHC IIhi DCs, and CD11chi MHC IIint DCs (gray). mRNA expression was assessed by quantitative real-time PCR and normalized to Rn18s. Histogram overlays show surface protein expression of CXCR4 (B) and CCR7 (D) evaluated by flow cytometry. Specific antibody stains are shown in filled blue histograms, and isotype-matched controls are shown in dotted lines. Bar graphs show means and SEM of 3 independent experiments, including independent cell sorts and real-time PCR runs (A,C), and histograms show 1 representative experiment (B,D) of 3 independent experiments.
CDPs express CXCR4 but no detectable levels of CCR7. The expression of the chemokine receptors Cxcr4 (A-B) and Ccr7 (C-D) was determined for CDPs that were isolated by FACS from steady-state BM and for indicated DCs from subcutaneous LNs. Bar graphs show Cxcr4 (A) and Ccr7 (C) mRNA expression of CDPs (blue), pDCs, CD11cint MHC IIhi DCs, and CD11chi MHC IIint DCs (gray). mRNA expression was assessed by quantitative real-time PCR and normalized to Rn18s. Histogram overlays show surface protein expression of CXCR4 (B) and CCR7 (D) evaluated by flow cytometry. Specific antibody stains are shown in filled blue histograms, and isotype-matched controls are shown in dotted lines. Bar graphs show means and SEM of 3 independent experiments, including independent cell sorts and real-time PCR runs (A,C), and histograms show 1 representative experiment (B,D) of 3 independent experiments.
TLR-stimulated CDPs down-regulate CXCR4 and up-regulate CCR7
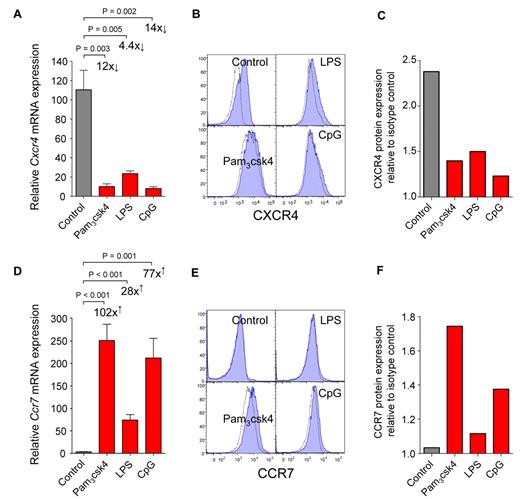
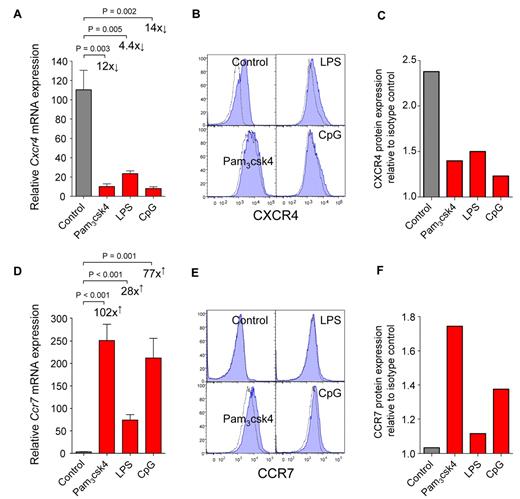
To investigate the biologic relevance of TLR expression by CDPs, we stimulated CDPs with TLR agonists in vitro. Synthetic triacylated lipoprotein Pam3csk4 was used to stimulate TLR2, LPS was used for TLR4, and unmethylated CpG-containing oligodeoxynucleotides (CpG) was used for TLR9. After 12 hours, Pam3csk4 or CpG led to a strong down-regulation of Cxcr4 mRNA (Figure 3A) and up-regulation of Ccr7 (Figure 3D). Similar but less pronounced effects were induced by LPS. In line with mRNA expression, CXCR4 surface protein was down-regulated 21 hours after stimulation with all TLR agonists used (Figure 3B-C), and CCR7 protein was up-regulated after stimulation with Pam3csk4 and CpG, but only minor effects were observed for LPS (Figure 3E-F). The mRNA expression of transcription factors relevant for DC development (Stat3, Sfpi1, Spib, and Cebpa) and cytokine receptors (Flt3 and Csf2ra) changed no more than 3-fold on stimulation of CDPs with TLR agonists (data not shown). We thus conclude that the direct triggering of TLRs on CDPs induces a change in their chemokine receptor expression, that is, down-regulation of CXCR4 and up-regulation of CCR7.
CDPs down-regulate CXCR4 and up-regulate CCR7 on TLR stimulation in vitro. FACS-isolated CDPs were cultured in cytokines alone (control) or stimulated by adding the TLR agonists Pam3csk4, LPS, or CpG. Twelve hours later, mRNA was isolated, and chemokine receptor expression was assessed by quantitative real-time PCR and normalized to Rn18s. Bar graphs show relative expression of mRNA for Cxcr4 (A) and Ccr7 (D) in cultures with cytokines alone (gray) or after addition of TLR agonists (red). Surface protein expression was determined by flow cytometry after 21 hours. Histograms show protein surface expression (blue filled) of CXCR4 (B) and CCR7 (E), overlaid with isotype-matched controls (dotted lines). The relative quantification of protein expression as a ratio between the mean fluorescence intensity of the specific antibody stain and isotype-matched controls is shown for CXCR4 (C) and CCR7 (F). mRNA expression is shown as means and SEM of 4 (A) or 5 (D) independent experiments, including independent cell sorts, cultures, and real-time PCR runs. The fold-changed mRNA expression and the level of statistical significant difference between stimulated cells and control cultures is indicated on the graphs. The histogram overlays (B,E) and the quantification of changes in protein expression (C,F) are shown as 1 representative experiment of 2 independent experiments.
CDPs down-regulate CXCR4 and up-regulate CCR7 on TLR stimulation in vitro. FACS-isolated CDPs were cultured in cytokines alone (control) or stimulated by adding the TLR agonists Pam3csk4, LPS, or CpG. Twelve hours later, mRNA was isolated, and chemokine receptor expression was assessed by quantitative real-time PCR and normalized to Rn18s. Bar graphs show relative expression of mRNA for Cxcr4 (A) and Ccr7 (D) in cultures with cytokines alone (gray) or after addition of TLR agonists (red). Surface protein expression was determined by flow cytometry after 21 hours. Histograms show protein surface expression (blue filled) of CXCR4 (B) and CCR7 (E), overlaid with isotype-matched controls (dotted lines). The relative quantification of protein expression as a ratio between the mean fluorescence intensity of the specific antibody stain and isotype-matched controls is shown for CXCR4 (C) and CCR7 (F). mRNA expression is shown as means and SEM of 4 (A) or 5 (D) independent experiments, including independent cell sorts, cultures, and real-time PCR runs. The fold-changed mRNA expression and the level of statistical significant difference between stimulated cells and control cultures is indicated on the graphs. The histogram overlays (B,E) and the quantification of changes in protein expression (C,F) are shown as 1 representative experiment of 2 independent experiments.
TLRs regulate CDP-migration in vivo
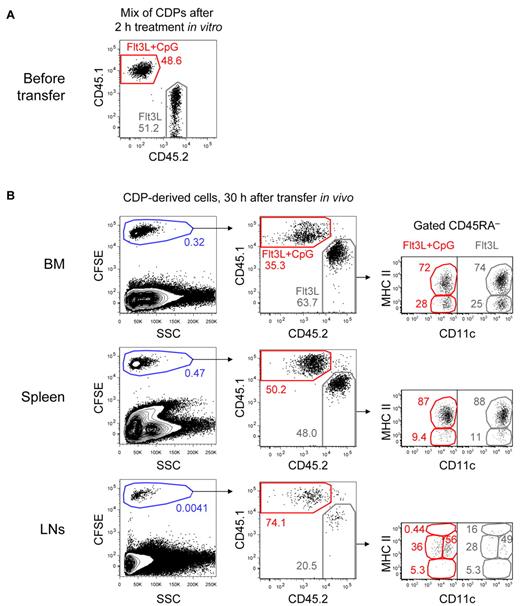
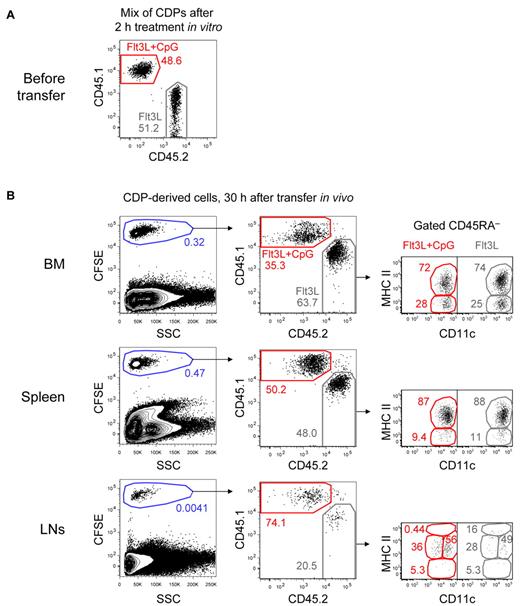
Our results on changes in the chemokine receptor profile of CDPs imply that TLR triggers may directly regulate their migration. We tested this hypothesis in vivo by adoptively cotransferring in vitro TLR-stimulated and nonstimulated CDPs into steady-state recipients. CD45.1+ CDPs were stimulated with CpG for 2 hours in cultures containing Flt3L and mixed in a one-to-one ratio with CD45.2+ CDPs from control cultures containing only Flt3L (Figure 4A). The mix of CDPs was then labeled with CFSE and adoptively transferred into steady-state, nonirradiated CD45.1xCD45.2 F1 hosts. Thirty hours after the transfer, the recipient's BM contained only 35.3% CpG-stimulated but 63.7% nonstimulated CDP-derived cells (Figure 4B). Equal numbers of both populations were found in the spleen. In subcutaneous LNs, 74.1% of the engrafted cells were derived from CpG-stimulated CDPs and only 20.5% from nonstimulated CDPs. Most CDP-derived cells in the BM, spleen, and LNs showed a CD11c+ MHC IIint phenotype of developing DCs, whereas some cells in the BM and spleen were CD11c+ MHC II−, characteristic for pre-DCs.10 All cells were negative to intermediate for CD45RA, and no CD11c− CDP-derived cells were detectable in any of the analyzed organs. Furthermore, no clear difference in the phenotype of stimulated and nonstimulated cells was observed with the majority of cells showing a CD11c+ MHC IIint phenotype (Figure 4B). The in vitro stimulation of CDPs with Pam3csk4 led to similar effects, although not as pronounced as those observed after CpG stimulation (supplemental Figure 2). These results for the first time demonstrate that TLR triggering of bone marrow CDPs can directly regulate their migration, that is, their preferential homing to LNs. In contrast, we did not observe that TLR triggering had major effects on the differentiation of distinct DC subtypes from CDPs.
TLR-stimulated CDPs preferentially home to LNs in expense of the BM in steady-state hosts. CDPs were FACS-isolated from the BM of CD45.1+ and CD45.2+ mice. CD45.1+ CDPs were stimulated for 2 hours in cultures containing Flt3L and CpG, whereas CD45.2+ CDPs were cultured in Flt3L alone. After culture, CDPs were washed, mixed in a one-to-one ratio, CFSE-labeled, and adoptively transferred intravenously into CD45.1xCD45.2 F1 steady-state hosts. After 30 hours, BM, spleen, and subcutaneous LNs were analyzed. The transferred mix of CD45.1+ CpG-stimulated CDPs and CD45.2+ CDPs from control cultures is shown in panel A. Cells gated on NK1.1− CD19− are shown for the different organs after 30 hours in vivo (B left column). To better distinguish CDP-derived cells from the host, cells were gated CFSE+, and the ratio of CD45.1+ CpG-stimulated and CD45.2+-nonstimulated cells was determined (B middle column). The CD11c and MHC II expression of CD45RA− cells is shown for each subset (B right column). The results of 1 representative experiment of 3 independent experiments of each recipient mouse are shown.
TLR-stimulated CDPs preferentially home to LNs in expense of the BM in steady-state hosts. CDPs were FACS-isolated from the BM of CD45.1+ and CD45.2+ mice. CD45.1+ CDPs were stimulated for 2 hours in cultures containing Flt3L and CpG, whereas CD45.2+ CDPs were cultured in Flt3L alone. After culture, CDPs were washed, mixed in a one-to-one ratio, CFSE-labeled, and adoptively transferred intravenously into CD45.1xCD45.2 F1 steady-state hosts. After 30 hours, BM, spleen, and subcutaneous LNs were analyzed. The transferred mix of CD45.1+ CpG-stimulated CDPs and CD45.2+ CDPs from control cultures is shown in panel A. Cells gated on NK1.1− CD19− are shown for the different organs after 30 hours in vivo (B left column). To better distinguish CDP-derived cells from the host, cells were gated CFSE+, and the ratio of CD45.1+ CpG-stimulated and CD45.2+-nonstimulated cells was determined (B middle column). The CD11c and MHC II expression of CD45RA− cells is shown for each subset (B right column). The results of 1 representative experiment of 3 independent experiments of each recipient mouse are shown.
Retention of CDPs in BM depends on CXCR4
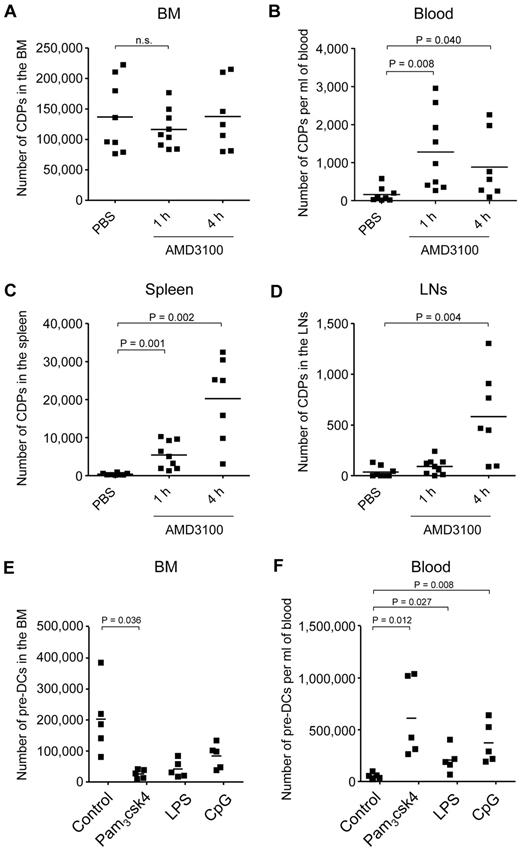
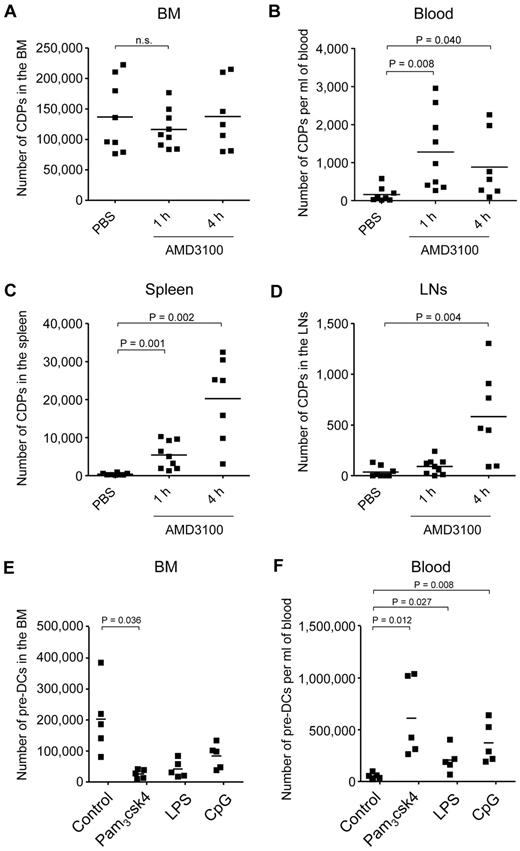
We next investigated whether steady-state expressed CXCR4 is important for the retention of CDPs in the BM. Because a genetic deletion of Cxcr4 is lethal in mice,26 we used the Cxcr4 antagonist AMD3100 to assess this question. In steady state, no or very few CDPs were detectable outside the BM, such as in the blood, spleen, or LNs (PBS control; Figure 5A-D; supplemental Figure 3). In contrast, 1 hour after injection of AMD3100, there was a transient decrease in CDP numbers in the BM that was not significant, given the broad range of CDP numbers in individual animals and the amount of animals analyzed. Nevertheless, CDPs increased significantly after 1 hour in the blood and spleen, and CDPs were significantly increased in the spleen and LNs 4 hours after AMD3100 application. Of note, the increase in total numbers of CDPs in blood, spleen, and LNs correlated well with temporary decrease of CDPs in BM, with overall low absolute numbers of CDPs in the periphery (range, < 1000-30 000) compared with relatively high numbers in BM (range, 70 000-220 000). Because CDPs cannot be detected at relevant numbers in any other tissue than BM in steady state, the CDPs appearing in the periphery on injection of AMD3100 must have exited the BM, and the BM localization of these CDPs thus depended on CXCR4. In addition, the number of Lin(*)− CD11c+ MHC II− pre-DCs8,10 decreased significantly in the BM after 4 hours of AMD3100 injection and increased in the blood and spleen after 1 and 4 hours (supplemental Figure 4), further supporting the finding that the localization of DC progenitors in the BM depends on CXCR4.
DC progenitor mobilization from the BM. CXCR4 antagonist AMD3100 or PBS were injected subcutaneously. The absolute number of CDPs was assessed by flow cytometry, 1 hour after injection of PBS, and 1 and 4 hours after injection of AMD3100. The results for BM (A; n.s. indicates not significant), blood (B), spleen (C), and subcutaneous LNs (D) of 6 independent experiments using a total of 7 to 9 mice (1 filled square per mouse) per condition are shown. CDPs were gated as Lin− c-kitint Flt3+ M-CSFR+ IL7Rα− CD11c− MHC II−. Mean values are depicted (horizontal lines), and where significant, the levels of significant difference between PBS-injected controls and AMD3100-injected animals are indicated. TLR agonists were injected intravenously, and the numbers of Lin(*)− CD11c+ MHC II− cells, corresponding to pre-DCs, were assessed by flow cytometry after 12 hours in the BM (E) and blood (F). The total number of pre-DCs is indicated for each individual animal. The data from 2 independent experiments using a total of 5 mice per condition are shown. Mean values are depicted (horizontal lines), and where significant, the levels of significant difference between PBS- and TLR agonist-injected animals are indicated.
DC progenitor mobilization from the BM. CXCR4 antagonist AMD3100 or PBS were injected subcutaneously. The absolute number of CDPs was assessed by flow cytometry, 1 hour after injection of PBS, and 1 and 4 hours after injection of AMD3100. The results for BM (A; n.s. indicates not significant), blood (B), spleen (C), and subcutaneous LNs (D) of 6 independent experiments using a total of 7 to 9 mice (1 filled square per mouse) per condition are shown. CDPs were gated as Lin− c-kitint Flt3+ M-CSFR+ IL7Rα− CD11c− MHC II−. Mean values are depicted (horizontal lines), and where significant, the levels of significant difference between PBS-injected controls and AMD3100-injected animals are indicated. TLR agonists were injected intravenously, and the numbers of Lin(*)− CD11c+ MHC II− cells, corresponding to pre-DCs, were assessed by flow cytometry after 12 hours in the BM (E) and blood (F). The total number of pre-DCs is indicated for each individual animal. The data from 2 independent experiments using a total of 5 mice per condition are shown. Mean values are depicted (horizontal lines), and where significant, the levels of significant difference between PBS- and TLR agonist-injected animals are indicated.
DC progenitors are mobilized from the BM on injection of TLR agonists
Based on the finding that TLR-stimulated CDPs down-regulate CXCR4, we hypothesized that TLR triggering would mobilize CDPs from the BM. To test this hypothesis, we injected TLR agonists intravenously or into the foot pad and tried to assess the numbers of CDPs in BM, blood, spleen, and LNs. However, cells expressing Flt3 and M-CSFR, that is, cells with the defined phenotype of CDPs, were not detectable in BM and any of the organs after 12 and 24 hours (data not shown). This was probably because of increased levels of respective cytokines, leading to internalization of the receptors,40 blockage of antibody binding, or both. In contrast to CDPs, pre-DCs, containing immediate downstream CDP progeny, could be monitored by surface phenotype and were significantly reduced in the BM and increased in the blood 12 hours after injection of TLR agonists (Figure 5E-F). Thus, CDPs that sense TLR agonists in vivo and down-regulate CXCR4 are probably consecutively mobilized from the BM, although, because of technical limitations caused by the induced inflammation, this currently is only directly demonstrated for their immediate progeny, pre-DCs.
CDP-derived DCs are recruited to inflamed LNs
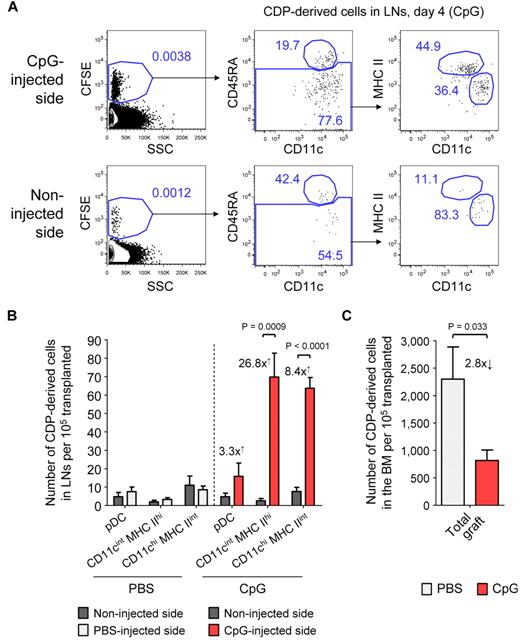
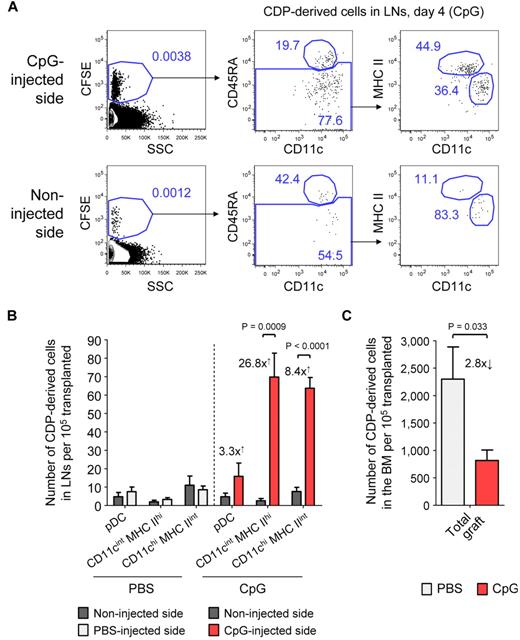
We next addressed the question of how TLR agonists may influence the differentiation of CDPs and the localization of CDP-derived DCs in vivo. Freshly isolated CDPs were adoptively transferred into nonirradiated hosts and at the same time CpG was injected into the foot pad. By day 4, CDPs, on average, gave rise to 3.3-fold more pDCs, 26.8-fold more CD11cint MHC IIhi DCs, and 8.4-fold more CD11chi MHC IIint DCs in inflamed LNs draining the CpG-injected side compared with LNs from the noninjected side of an animal (Figure 6A-B). DC subsets derived from transferred CDPs and of host origin were gated similarly (supplemental Figure 5). Adoptively transferred CDPs gave rise to substantial numbers of pDCs and cDCs in the BM and spleen on day 4, with similar pDC-to-cDC ratios in mice injected with CpG or PBS (data not shown). However, the engraftment of pDCs into the LNs was generally low. No cells of other lineages than DCs were observed in any of the TLR agonist–treated or steady-state animals. The injection of Pam3csk4 into the foot pad led to a similar recruitment of CDP-derived DCs into LNs draining the site of injection as CpG (data not shown), whereas PBS did not have any effect (Figure 6B; supplemental Figure 5). There was no difference in the proliferation activity of CDP-derived cells from inflamed and control LNs of the same animal, as determined by CFSE dilution (Figure 6A). Together, these data indicate that the local administration of TLR agonists leads to a significant increase of CDP-derived CD11cint MHC IIhi and CD11chi MHC IIint DCs in inflamed LNs, which was because of recruitment but not to increased local proliferation. Interestingly, the increase in CDP-derived DCs in inflamed LNs was higher than the increase in total cells within these LNs, suggesting an active migration of CDP-derived progenitors, DCs, or both to inflamed LNs, rather than a passive increase in their numbers with the total LN size. In addition, we detected a 2.8-fold decrease in CDP-derived DCs in the BM of animals that were injected with CpG into the foot pad, compared with animals treated with PBS (Figure 6C). This further supports the hypothesis that locally injected TLR agonists spread to the BM and lead to the mobilization of CDPs.
CDPs give rise to increased numbers of DCs in inflamed LNs. CD45.1xCD45.2 F1 hosts were transplanted with freshly isolated, CFSE-labeled CD45.1+ CDPs and injected with either 25 μg of CpG or PBS into one foot pad. The plots show CD19− NK1.1− cells on day 4 in LNs draining the injected side and the noninjected side of a representative CpG-treated animal (A). The cells were first gated CFSE+ to separate transferred CDP-derived cells from the host background (left) and further gated CD45.1+ CD45.2− cells (data not shown). The gating for pDCs (CD11clow CD45RA+), CD11cint MHC IIhi, and CD11chi MHC IIint DCs derived from transferred CDPs is indicated (middle to right). The bar graph in panel B shows the average number of CDP-derived cells in the LNs from the injected and the noninjected side of animals treated with CpG or PBS. The numbers drawn on the graph indicate the average fold increase of CDP-derived DCs on the injected compared with the noninjected side. The number of total CDP-derived cells in the BM of PBS- and CpG-treated animals it shown in panel C. The graphs show the means and SEM of 4 independent experiments, each using 1 CpG- and 1 PBS-treated recipient mouse, and the level of significant difference between inflamed and noninflamed organs is indicated.
CDPs give rise to increased numbers of DCs in inflamed LNs. CD45.1xCD45.2 F1 hosts were transplanted with freshly isolated, CFSE-labeled CD45.1+ CDPs and injected with either 25 μg of CpG or PBS into one foot pad. The plots show CD19− NK1.1− cells on day 4 in LNs draining the injected side and the noninjected side of a representative CpG-treated animal (A). The cells were first gated CFSE+ to separate transferred CDP-derived cells from the host background (left) and further gated CD45.1+ CD45.2− cells (data not shown). The gating for pDCs (CD11clow CD45RA+), CD11cint MHC IIhi, and CD11chi MHC IIint DCs derived from transferred CDPs is indicated (middle to right). The bar graph in panel B shows the average number of CDP-derived cells in the LNs from the injected and the noninjected side of animals treated with CpG or PBS. The numbers drawn on the graph indicate the average fold increase of CDP-derived DCs on the injected compared with the noninjected side. The number of total CDP-derived cells in the BM of PBS- and CpG-treated animals it shown in panel C. The graphs show the means and SEM of 4 independent experiments, each using 1 CpG- and 1 PBS-treated recipient mouse, and the level of significant difference between inflamed and noninflamed organs is indicated.
CCR7 contributes to the generation of LN DCs from CDPs
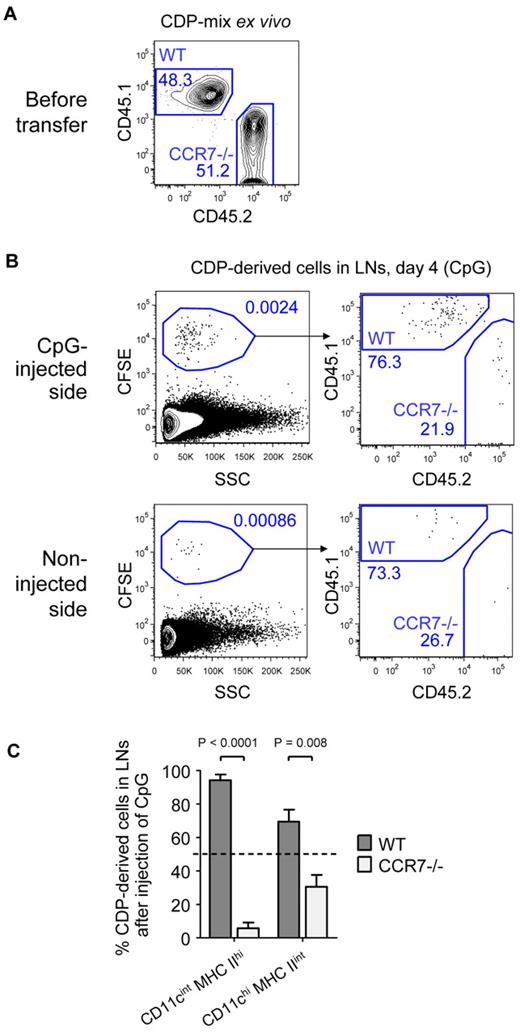
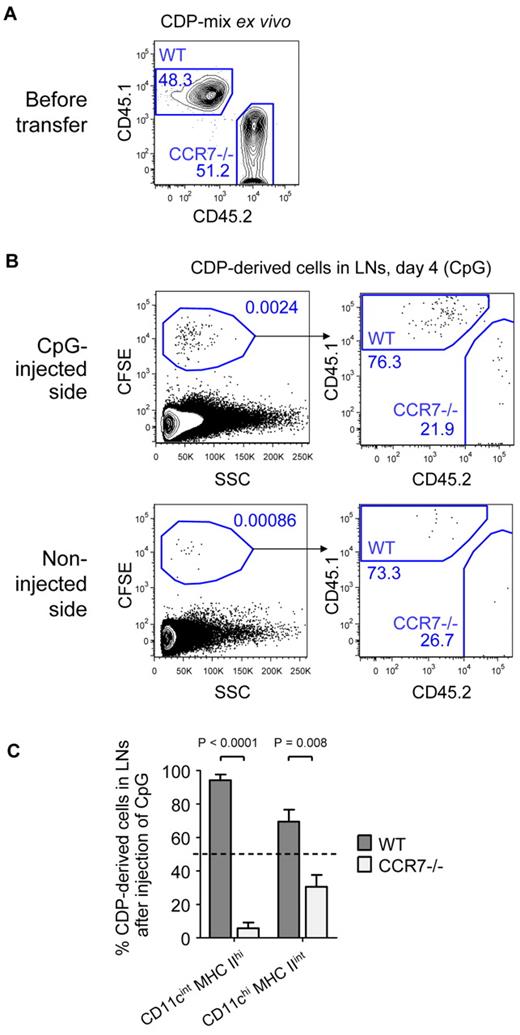
Finally, we investigated the role of CCR7 in TLR-mediated recruitment of CDP-derived DCs to inflamed LNs. A one-to-one mix of freshly isolated CD45.1+ WT and CD45.2+ CCR7-deficient (CCR7−/−) CDPs was transferred into CD45.1xCD45.2 F1 hosts, and CpG was injected into one foot pad. In the representative experiment shown, 48.3% WT and 51.2% CCR7−/− CDPs were transferred (Figure 7A). As in previous experiments, the transferred CDPs gave rise to increased numbers of DCs in the LNs on the inflamed side by day 4 (Figure 7B). Of these, 76.3% derived from WT and only 21.9% from CCR7−/− CDPs. In LNs from the noninflamed side (Figure 7B) or LNs from PBS-treated animals (supplemental Figure 6), the few CDP-derived cells that were detected consisted of ∼ 80% WT and 20% CCR7−/− cells. In contrast, WT and CCR7−/− CDPs engrafted equally well into the BM of CpG- and PBS-treated animals (supplemental Figure 6). Because the total engraftment of pDCs in the LNs on day 4 was very low, they were excluded from further analysis. CD11cint MHC IIhi DCs in inflamed LNs were derived from 94.3% of WT and 5.7% of CCR7−/− CDPs, whereas CD11chi MHC IIint DCs derived from 69.5% of WT and 30.5% of CCR7−/− CDPs (Figure 7C). In conclusion, CCR7 on CDPs is up-regulated by TLR agonists and CCR7 is essential for the recruitment of CDP-derived CD11cint MHC IIhi DCs to inflamed LNs, whereas CCR7 independent, partially compensatory recruitment mechanisms exist for CD11chi MHC IIint CDP-derived DCs, because this population was reduced by approximately half.
LN recruitment of CDP-derived DCs depends on CCR7. Freshly isolated CDPs from CD45.1+ WT and CD45.2+ CCR7-deficient animals (CCR7−/−) were mixed in a one-to-one ratio, CFSE-labeled, and adoptively transferred intravenously into CD45.1xCD45.2 F1 hosts that were injected with 25 μg of CpG into the foot pad. The transferred mix of CD45.1+ WT and CD45.2+ CCR7−/− CDPs of 1 representative experiment is shown in panel A. Plots in panel B show CD19− NK1.1− cells from LNs of the CpG-injected and the noninjected side on day 4. The samples were further gated CFSE+ to assess the ratio of CD45.1+ WT and CD45.2+ CCR7−/− CDP-derived cells. The bar graph in panel C indicates the percentage of CD11cint MHC IIhi or CD11chi MHC IIint DCs derived from WT or CCR7−/− CDPs. The transferred CDP-mix of 50% WT and 50% CCR7−/− is indicated by a dotted line. One of 3 independent experiments is depicted using one recipient animal per condition (A-B). The bar graph in panel C shows the mean and SEM of the 3 independent experiments with indication of the level of significant differences between WT and CCR7−/− DC subsets.
LN recruitment of CDP-derived DCs depends on CCR7. Freshly isolated CDPs from CD45.1+ WT and CD45.2+ CCR7-deficient animals (CCR7−/−) were mixed in a one-to-one ratio, CFSE-labeled, and adoptively transferred intravenously into CD45.1xCD45.2 F1 hosts that were injected with 25 μg of CpG into the foot pad. The transferred mix of CD45.1+ WT and CD45.2+ CCR7−/− CDPs of 1 representative experiment is shown in panel A. Plots in panel B show CD19− NK1.1− cells from LNs of the CpG-injected and the noninjected side on day 4. The samples were further gated CFSE+ to assess the ratio of CD45.1+ WT and CD45.2+ CCR7−/− CDP-derived cells. The bar graph in panel C indicates the percentage of CD11cint MHC IIhi or CD11chi MHC IIint DCs derived from WT or CCR7−/− CDPs. The transferred CDP-mix of 50% WT and 50% CCR7−/− is indicated by a dotted line. One of 3 independent experiments is depicted using one recipient animal per condition (A-B). The bar graph in panel C shows the mean and SEM of the 3 independent experiments with indication of the level of significant differences between WT and CCR7−/− DC subsets.
Discussion
Invading infectious pathogens are sensed by immune cells carrying pathogen recognition receptors, such as TLRs. TLR triggering of DCs leads to their cellular activation, ie, migration, antigen processing and presentation, secretion of inflammatory cytokines, and ultimately the induction of innate and adaptive immune responses. Here, we asked the question whether pathogen recognition is restricted to mature DCs or whether pathogens can already be detected by early DC-restricted hematopoietic progenitors in the BM, and if so, what would be the impact of such recognition?
We found that CDPs,7,9 the earliest DC-restricted progenitors in the BM, indeed express high levels of TLR2 and TLR9 and moderate levels of TLR4 and TLR7 compared with other HSPCs.36,38 On in vitro stimulation of TLRs, CDPs drastically changed their chemokine receptor profile: CXCR4, a receptor we here found to be important for CDP retention in the BM, was down-regulated and CCR7, a receptor critical for LN homing, was up-regulated. As a consequence, CDPs altered their migratory behavior in vivo and generated increased numbers of DCs in inflamed LNs at the expense of DC generation in the BM. Such bias was because of preferential homing of CDP-derived DCs to inflammatory sites and not a result of local proliferation. We thus propose a novel mechanism of DC regeneration in inflamed LNs initiated by the exposure of BM DC-restricted progenitors to systemically spreading pathogen-associated signals.
Previous studies demonstrated that PAMPs spreading from a local source of infection can reach the BM, where they are sensed via TLRs by HSPCs. Nagai et al showed that HSPCs, such as LSK cells and GMPs express relatively high levels of TLR2 and TLR4, and 1 hour after intravenous or intraperitoneal injection, LPS was bound to TLR4 on the surface of HSPCs in the BM.36 On direct stimulation of TLR2, TLR4, and TLR7/8, multipotent HSPCs, CMPs, and GMPs differentiated to monocytes, macrophages, and DCs at the expense of other lineages.34-36,38,41 CLPs further expressed particularly high TLR9, and corneal infection with herpes simplex virus-1 led to preferential differentiation of CLPs to DCs at the cost of lymphoid development.38 These findings imply that TLR ligation on upstream progenitor cells would skew their differentiation toward needed cellular components. Here, we confirm the TLR expression pattern of early hematopoietic progenitors.36,38 However, in contrast to previous studies on other hematopoietic progenitors as myeloid progenitors and CLP, we did not observe substantial changes in the differentiation of CDPs in vivo. In both steady state and on injection of CpG, adoptively transferred CDPs gave rise to a similar ratio of pDCs and cDCs in the BM and spleen of nonirradiated recipients, and they did not generate cells of other lineages. Consequently, although TLR-induced lineage skewing might be relevant for upstream progenitors that carry the potential for multiple lineage development, this effect was not observed for DC-restricted progenitors in steady state and during inflammation.
Thus far, only one previous study investigated the migration of HSPCs on TLR triggering. Massberg et al examined a population of LSK cells that in steady state circulates through the blood, peripheral tissues, and the lymph.37 On LPS stimulation in vitro and subsequent retransfer in vivo, these cells ceased to migrate and down-regulated sphingosine 1-phosphate receptor S1P1, normally controlling the egress of lymphocytes from the tissue into the lymphatics, and they differentiated locally into myelomonocytic cells. The expression of chemokine receptors was not examined in this study. In contrast to circulating LSK cells, we and others have shown that CDPs in steady state reside in the BM and are not detectable in the blood, spleen, or LNs.8 Therefore, CDPs should only encounter TLR agonists that spread systemically to the BM. In this study, we found that CDP retention in the BM relies on CXCR4 and that CXCR4 is down-regulated by CDPs on direct stimulation with TLR agonists. Moreover, adoptively transferred CDPs gave rise to less DCs in the BM on injection of CpG than in steady state. Because CDPs are identified by the cytokine receptors Flt3 and M-CSFR, this population cannot be monitored directly once the respective cytokines are elevated on inflammation. However, an immediate progeny of CDPs, pre-DCs, decreased in the BM and increased in the blood on intravenous injection of TLR agonists, and the localization of pre-DCs in the BM depended on CXCR4. These findings strongly support the view that PAMPs spreading from a source of infection and reaching the BM lead to a mobilization of DC progenitors via down-regulation of CXCR4. This progenitor cell intrinsic mechanism complements and synergizes with the previous finding that BM stroma cells decrease the production of CXCL12 and activated neutrophils secrete proteases that cleave CXCL12 and CXCR4 on inflammatory stimuli, such as LPS, further contributing to the release of progenitors from the BM.29,42
In steady state, pre-DCs circulate in the blood and enter LNs via HEVs to locally generate cDCs.8 Pre-DCs further give rise to DCs in nonlymphoid tissues,11-13 which subsequently may enter afferent lymphatics and reach LNs as MigDCs.16,17 In steady-state LNs, cDCs are CD11chi MHC IIint (similar to cDCs in the spleen), whereas MigDCs are considered to be CD11cint MHC IIhi.8,16,17 Activated DCs also up-regulate MHC II,2 and whether conclusions on the migratory origin of DCs can be drawn from their phenotype in inflamed LNs remains to be determined. Here, we demonstrate that CDPs mobilized via the injection of AMD3100 increase in LNs after only 4 hours. In addition, TLR-stimulated CDPs efficiently migrated to LNs and gave rise to increased numbers of CD11c+ MHC IIint DCs 30 hours after adoptive transfer, whereas nonstimulated CDPs preferentially homed to the BM in the same steady-state recipient.
CD62L is expressed on steady-state CDPs, is essential for the rolling of lymphocytes on HEVs,43 and was demonstrated to be important for the entry of pre-DCs into LNs.8 On stimulation with TLR agonists, we found that CDPs drastically up-regulated CCR7. The recruitment of CDP-derived CD11cint MHC IIhi and CD11chi MHC IIint depended significantly on CCR7 on subcutaneous injection of CpG. This indicates that the TLR-induced up-regulation of CCR7 is relevant for the recruitment of both subsets of DCs or their progenitors to inflamed LNs. However, some CD11chi MHC IIint DCs were recruited in the absence of CCR7, when WT and CCR7−/− CDPs were competitively transferred. In line with our results, it has been demonstrated previously that CD11cint MHC IIhi DCs express higher levels of CCR7 compared with CD11chi MHC IIint DCs and that their migration is more dependent on faithful expression of CCR7.17 CCR7 ligands were further shown to be up-regulated by LN epithelial cells on inflammation,19,24 probably synergizing with the up-regulation of CCR7 on CDPs.
Recently, monocytes were shown to enter inflamed LNs from the blood on injection of TLR4 agonist LPS or E coli in a CD62L- and CCR7-dependent manner and to give rise to monocyte-derived DCs that efficiently primed T-cell responses.44,45 Here, we report a CCR7-dependent recruitment of CDP-derived DCs to inflamed LNs, that is, a differentiation pathway that is independent of monocytes.4,5 The effects we observed were induced via triggering of TLR2 and TLR9, whereas TLR4 stimulation led to less strong effects. Different classes of pathogens may thus lead to the recruitment of DCs from different sources. The expressed TLRs enable CDPs to sense components from the cell wall of gram-positive bacteria and lipoproteins from enveloped viruses via TLR2, LPS from the outer membrane of gram-negative bacteria via TLR4, and DNA from bacteria and DNA viruses via TLR9.31 We stimulated CDPs with purified TLR agonists and observed differences only in the strength of the response. During bacterial or viral infections, several TLRs are triggered in parallel and may induce synergistic effects. DCs that enter reactive LNs from infected tissues and LN-resident DCs should be the first antigen-presenting cells to prime naive T cells, followed by monocyte-derived DCs. In contrast, the recruitment of DC progenitors probably plays a role in DC replenishment.
In conclusion, we present the first report that the earliest BM DC-restricted progenitors, CDPs, express functional TLRs that regulate their chemokine receptor expression and their migratory behavior in vivo. In a physiologic context, once PAMPs from a spreading microbial infection reach the BM, CDPs are mobilized via down-regulation of CXCR4 and their offspring are recruited to inflamed LNs via up-regulation of CCR7. We speculate that this mechanism has evolved to sustain adequate numbers of DCs in reactive LNs during ongoing immune responses and to restore DC homeostasis once the inflammation has ceased.
The online version of the article contains a data supplement.
The publication costs of this article were defrayed in part by page charge payment. Therefore, and solely to indicate this fact, this article is hereby marked “advertisement” in accordance with 18 USC section 1734.
Acknowledgments
The authors thank David Jarrossay for cell sorting and Enrica Mira Catò, Andrea D'Ercole, Luana Perlini, Emanuele Cavadini, Walter Ettlin, and Gregor Kuenzi for animal care.
This work was supported by the Swiss National Science Foundation (grant 310030-116637, M.G.M.) and the DC-THERA European network “Dendritic cells and Novel Therapies” (M.G.M.).
Authorship
Contribution: M.A.S. designed and performed experiments, analyzed and interpreted data, and wrote the manuscript; H.T. designed and both H.T. and D.R.B. performed experiments, discussed data, and edited the manuscript; Y.S. performed experiments; and M.G.M. directed the study.
Conflict-of-interest disclosure: The authors declare no competing financial interests.
Correspondence: Markus G. Manz, Division of Hematology, University Hospital Zurich, Raemistrasse 100, 8091 Zurich, Switzerland; e-mail: markus.manz@usz.ch.

