Abstract
Haploinsufficiency for ribosomal protein genes has been implicated in the pathophysiology of Diamond-Blackfan anemia (DBA) and the 5q− syndrome, a subtype of myelodysplastic syndrome. The p53 pathway is activated by ribosome dysfunction, but the molecular basis for selective impairment of the erythroid lineage in disorders of ribosome function has not been determined. We found that p53 accumulates selectively in the erythroid lineage in primary human hematopoietic progenitor cells after expression of shRNAs targeting RPS14, the ribosomal protein gene deleted in the 5q− syndrome, or RPS19, the most commonly mutated gene in DBA. Induction of p53 led to lineage-specific accumulation of p21 and consequent cell cycle arrest in erythroid progenitor cells. Pharmacologic inhibition of p53 rescued the erythroid defect, whereas nutlin-3, a compound that activates p53 through inhibition of HDM2, selectively impaired erythropoiesis. In bone marrow biopsies from patients with DBA or del(5q) myelodysplastic syndrome, we found an accumulation of nuclear p53 staining in erythroid progenitor cells that was not present in control samples. Our findings indicate that the erythroid lineage has a low threshold for the induction of p53, providing a basis for the failure of erythropoiesis in the 5q− syndrome, DBA, and perhaps other bone marrow failure syndromes.
Introduction
Heterozygous deletions or mutations of ribosomal protein genes have been implicated in 2 human disorders, Diamond-Blackfan anemia (DBA)1-3 and the 5q− syndrome, a subtype of myelodysplastic syndrome (MDS).4,5 Both disorders are characterized by a severe macrocytic anemia.2,6 In DBA, a congenital disorder, approximately 25% of patients have mutations in the RPS19 gene,1 and mutations or deletions have been identified in at least 9 additional ribosomal protein genes.3,7 In the 5q− syndrome, somatic deletion of one allele of chromosome 5q causes haploinsufficiency for the RPS14 gene.5 A central outstanding question is how a defect in ribosomes, which are expressed in and are essential to all cells, causes a primarily erythroid phenotype.
Multiple animal models have demonstrated the effects of ribosomal dysfunction on erythropoiesis and the role of p53, which is known to monitor ribosome function.8 Morpholinos targeting RPS19 in zebrafish cause an accumulation of p53 and a block in erythropoiesis that is reversed in the absence of p53.9 Mice with germline mutations in the RPS19 or RPS20 genes have hyperpigmented foot pads with p53 accumulation in the epidermis, a decreased hematocrit, and an increased erythrocyte mean cell volume. Crossing the RPS19 mutant mice with p53 null mice rescued the skin and hematopoietic phenotypes.10 Finally, a conditional heterozygous deletion of the Cd74-Nid76 interval syntenic to human chromosome 5q, containing 6 genes, including RPS14, in mouse hematopoietic cells, causes a macrocytic anemia that is rescued by crossing to a p53 null background.11
Although p53 appears to play a critical role in these disorders, the molecular basis for the lineage-restricted effects of ribosome dysfunction remains unexplained. In this study, we examined the accumulation and activity of p53 in different hematopoietic lineages after partial knockdown of RPS14 and RPS19 in primary human hematopoietic progenitor cells. We found that p53 accumulates selectively in erythroid progenitor cells, resulting in lineage-specific p53 target gene expression, cell cycle arrest, and apoptosis. Pharmacologic inhibition of HDM2, an E3 ubiquitin ligase and central regulator of p53, phenocopies the consequences of allelic insufficiency for ribosomal genes, demonstrating an increased sensitivity of the erythroid lineage to p53 activation, even in the absence of ribosome dysfunction, and pharmacologic inhibition of p53 rescues the effects of ribosomal protein deficiencies. These findings provide insight into the pathophysiology of the anemia seen in DBA and the 5q− syndrome and suggest pharmacologic approaches to treating disorders of ribosome dysfunction.
Methods
Cell culture and drug treatment
Cryopreserved human bone marrow CD34+ cells were obtained from Lonza Walkersville. To induce erythroid differentiation, cells were cultured in serum-free expansion medium (StemCell Technologies) supplemented with 100 U/mL penicillin/streptomycin, 2mM glutamine, 40 g/mL lipids (Sigma-Aldrich), 100 ng/mL stem cell factor, 10 ng/mL interleukin-3 (IL-3), and 0.5 U/mL erythropoietin. The concentration of erythropoietin was increased to 3 U/mL on day 7. In experiments evaluating both erythroid and myeloid differentiation in a single liquid culture, 15 ng/mL granulocyte colony-stimulating factor (Neupogen; Amgen), and 40 ng/mL FLT3 ligand were added. To support megakaryocytic differentiation in the same culture, 10 ng/mL IL-6 and 50 ng/mL thrombopoietin were added, Cells were harvested for flow cytometric analysis after either 4 or 10 days of liquid culture as noted in “Results.” Nutlin-3 was obtained from Cayman Chemicals, and pifithrin-α (PFT-α) was obtained from Calbiochem.
Lentiviral vectors and infection
Lentiviral shRNAs in the pLKO.1 vector were obtained from Broad Institute of Harvard and MIT.12 Sequences targeted by each shRNA are listed in supplemental Table 2 (available on the Blood Web site; see the Supplemental Materials link at the top of the online article). Lentivirus was produced in 293T cells as described previously.12 Primary hematopoietic cells were infected with lentivirus one day after being thawed in the presence of 8 μg/mL polybrene (Sigma-Aldrich) and selected 24 hours later with 2 μg/mL puromycin (Sigma-Aldrich).
Flow cytometry
Lineage-specific differentiation was evaluated by flow cytometry. Approximately 5 × 10⁵ cells were incubated for 15 minutes on ice with phycoerythrin, phycoerythrin-Cy5, or fluorescein isothiocyanate-conjugated antibodies against glycophorin-A, CD71, CD11b, CD45, CD13, CD33, and CD41 (BD Biosciences PharMingen) to assess terminally differentiated erythroid cells, immature erythroid cells, myeloid cells, and megakaryocytic cells, respectively. Apoptosis was evaluated using an antibody against annexin V (BD Biosciences PharMingen). To assess the activation of intracellular proteins, cells were fixed with 2% paraformaldehyde for 15 minutes at 37°C and permeabilized with ice-cold methanol for 30 minutes at −20°C. Next, cells were incubated for 1 hour with either fluorochrome-labeled primary antibody against p53 (1C12; Cell Signaling) or primary antibody for p21 (2947; Cell Signaling) followed by FITC-conjugated anti–mouse secondary antibody (AlexaFluor, Invitrogen). Flow cytometry was performed on a FACSCalibur cytometer (BD Biosciences), and data were analyzed using FlowJo software Version 7.2.2 (TreeStar).
Cell-cycle analysis
For quantification of cell-cycle status, cells were pulse labeled with 10μM bromodeoxyuridine (BrdU) for 45 minutes. Cells were harvested, washed with phosphate-buffered saline, and stained for BrdU and 7-amino-actinomycin D (7-AAD) according to the instructions of the manufacturers (BrdU flow kits; BD Biosciences PharMingen). G0/G1, S, and G2/M phase cells were analyzed by flow cytometry.
Methylcellulose colony assays
Total mouse bone marrow cells from BALB/c mice were plated on methylcellulose containing stem cell factor, IL-3, IL-6, and erythropoietin (MethoCult GF M3434; StemCell Technologies). The number of burst-forming unit erythroid (BFU-E), colony-forming unit myeloid, and colony-forming unit granulocyte/erythrocyte/monocyte/megakaryocyte colonies were assessed after 7- to 10-day culture at 37°C in humidified atmosphere with 5% CO2 as per the manufacturer's instructions. For the assessment of colony-forming unit erythroid (CFU-E) and BFU-E, total mouse bone marrow cells from BALB/c mice were plated on methylcellulose-containing erythropoietin only (MethoCult M3334; StemCell Technologies). The number of CFU-E and BFU-E were counted after 2- and 4-day culture, respectively.
Quantitative real-time RT-PCR
RNA was purified using TRIzol (Invitrogen). First-strand cDNA was generated using 200 ng of total RNA and oligo dT primers with the Superscript III reverse transcription kit (Invitrogen). Quantitative reverse-transcribed polymerase chain reaction (RT–PCR) was performed using iQTM SYBR Green supermix (Bio-Rad) in an iQ5 Cycler (Bio-Rad). β-Actin was used as an internal control. Relative changes of mRNA amounts were calculated using the ΔΔCt method. A list of all primers used is provided in supplemental Table 3.
Western blot
Western blots were performed using 50 μg of protein and primary antibodies against p53 (7F5; cell signaling) at 1:1000 dilution, RPL11 (G-17; Santa Cruz Biotechnology) at 1:500 dilution, RPS19 (WW-4; Santa Cruz Biotechnology) at 1:200 dilution, RPS14 (A01; Abnova) at 1:500 dilution, and tubulin (Ab-2; Neomarkers) at 1:1000 dilution. Immunoreactive proteins were visualized using an enhanced chemiluminescence reagent (Pierce Chemical).
Coimmunoprecipitation
Whole cell lysates (∼ 1 mg) were harvested, and coimmunoprecipitation was performed as recommended by the manufacturer (Active Motif) using an anti-HDM2 antibody (sc-7918; Santa Cruz Biotechnology) at a dilution of 1:50 in a final volume of 300 μL for 4 hours at 40°C. Total cell lysates (input) and immunoprecipitated complexes were resolved on 4% to 12% Bis-Tris sodium dodecyl sulfate-polyacrylamide gel electrophoresis gels (Invitrogen, NuPAGE) and transferred to polyvinylidene difluoride membranes (IPVH15150, Millipore) for immunoblotting.
p53 immunohistochemistry
Bone marrow biopsies from patients were analyzed under an Institutional Review Board-approved protocol at Brigham and Women's Hospital. Immunohistochemistry was performed using 4-μm-thick formalin-fixed, paraffin-embedded tissue sections. Briefly, slides were soaked in xylene, passed through graded alcohols, and put in distilled water. Slides were then pretreated with 10mM citrate, pH 6.0 (Zymed), in a steam pressure cooker (Decloaking Chamber, BioCare Medical) as per the manufacturer's instructions followed by washing in distilled water. All further steps were performed at room temperature in a hydrated chamber. Slides were pretreated with Peroxidase Block (Dako North America) for 5 minutes to quench endogenous peroxidase activity. Anti–human p53 antibody (Beckman Coulter, clone DO-1, catalog no. 1767) was applied 1:50 in Dako diluent for 1 hour. Slides were washed in 50mM Tris-Cl, pH 7.4, and detected with antimouse Envision+ kit (Dako North America) as per the manufacturer's instructions. After further washing, immunoperoxidase staining was developed using a diaminobenzidine chromogen (Dako North America) and counterstained with hematoxylin.
For both p53/transferrin receptor and p53/glycophorin double staining, p53, monoclonal mouse anti–human p53 antibody (Beckman Coulter, clone DO-1, catalog no. 1767) was applied 1:50 in Dako diluent for 1 hour. Slides were washed and detected with anti–mouse Envision+ kit (Dako North America) for 1 hour. Slides were thoroughly washed again, and transferrin receptor, mouse anti–human transferrin receptor (Invitrogen, clone H68.4, catalog no. 13–6800), or glycophorin, mouse anti–human glycophorin (Dako North America, clone JC159, catalog no. M0819) was applied 1:500 or 1:1000, respectively in Dako diluent for 1 hour. The slides were washed and then labeled with Alexa-555-conjugated goat anti–mouse (diluted 1:200, Invitrogen) for 30 minutes. After washing, Cy5-tyramide Signal Amplification System (PerkinElmer Life and Analytical Sciences) was applied as per the manufacturer's instructions to couple Cy5 dyes to the horseradish peroxidase-conjugated Envision secondary antibody. Coverslips were sealed to slides with Prolong Gold Antifade Reagent with 4,6-diamidino-2-phenylindole (Invitrogen) to visualize nuclei. Slides were scanned using Imager.Z1 (Carl Zeiss) with TissueFaxs 1.3 software (TissueGnostics).
Immunofluorescent analysis of nucleoli
A549 cells were grown on coverslips. Cells were fixed for 10 minutes in methanol at −20°C followed by rehydration in phosphate-buffered saline (PBS) for 5 minutes. Cells were then permeabilized on ice for 5 minutes with 0.5% Triton in PBS. Coverslips were washed twice with PBS and blocked for 30 minutes in blocking solution (3% bovine serum albumin, 4 × saline sodium citrate, 0.1% Tween-20). Cells were then incubated with anti-nucleophosmin (32-5200; Zymed Laboratories; Invitrogen) diluted 1:200 in blocking solution for 1 hour at room temperature. After PBS washes, coverslips were incubated with FITC-conjugated secondary antibody (AlexaFluor, Invitrogen) for 45 minutes and washed 3 times, for 15 minutes each, in PBS. Cells were dehydrated consecutively in 70%, 90%, and 100% ethanol for 3 minutes each and were allowed to dry completely. Slides were mounted in Vectashield mounting medium containing 4,6-diamidino-2-phenylindole as counterstain for DNA. The staining was visualized using a fluorescent microscope (Olympus IX71) and analyzed with IPlab 3.6.5 software.
Statistics
Results
Decreased expression of RPS14 or RPS19 causes p53 activation and cell cycle arrest in human hematopoietic progenitor cells
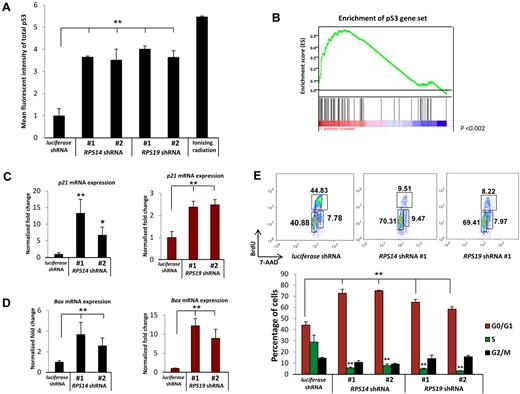
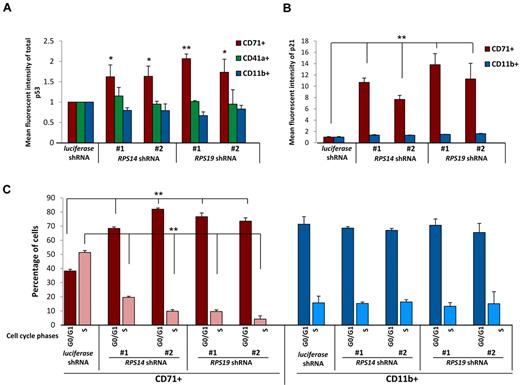
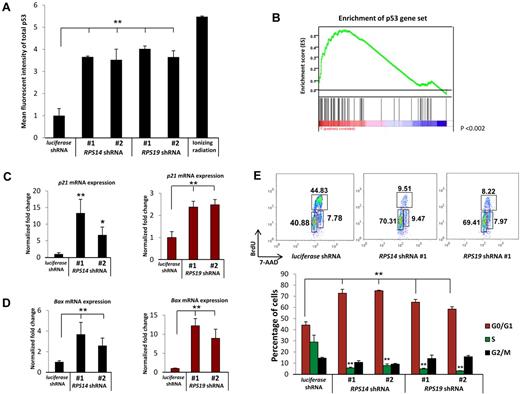
Given the evidence for p53 activation in animal models of ribosomal dysfunction,9-11,15 we examined the effects of decreased expression of RPS14 and RPS19 on p53 levels in primary human hematopoietic progenitor cells. To model haploinsufficiency rather than homozygous inactivation, we used short hairpin RNAs (shRNAs) that decrease expression of the RPS14 or RPS19 genes by 40% to 60% at mRNA and protein levels (supplemental Figure 1). In primary human bone marrow, CD34+ cells induced to differentiate along the erythroid lineage in vitro, 2 lentiviral shRNAs each for RPS14 and RPS19 powerfully increased levels of total p53 relative to a control shRNA, as assessed by intracellular flow cytometry 5 days after infection (Figure 1A). The induction of p53 caused by RPS14 or RPS19 knockdown approximated the levels of p53 induced by gamma irradiation, a positive control for p53 induction.
Decreased expression of RPS14 or RPS19 activates the p53 pathway. (A) Increased levels of total p53 protein in primary human bone marrow cells as analyzed by intracellular flow cytometry. (B) RPS14 shRNAs significantly increase the expression of downstream target genes of p53, as assessed by gene set enrichment analysis using a set of published p53 target genes.16 Genes are ranked according to their differential expression between cells expressing RPS14 shRNA and control shRNAs targeting the luciferase gene. Genes in the p53 gene set are marked with vertical bars, and the enrichment score is shown in green. (C-D) The mRNA expression of p21 and Bax in primary human bone marrow cells, relative to β-actin mRNA, was measured by quantitative real time PCR. (E) Cell cycle status was analyzed by flow cytometry using 7-AAD and BrdU. Numbers in the flow plot represent the percentage of cells in different phases of cell cycle. Results shown for each experiment are representative of 3 independent experiments performed in triplicate (mean ± SEM). *P < .05. **P < .01.
Decreased expression of RPS14 or RPS19 activates the p53 pathway. (A) Increased levels of total p53 protein in primary human bone marrow cells as analyzed by intracellular flow cytometry. (B) RPS14 shRNAs significantly increase the expression of downstream target genes of p53, as assessed by gene set enrichment analysis using a set of published p53 target genes.16 Genes are ranked according to their differential expression between cells expressing RPS14 shRNA and control shRNAs targeting the luciferase gene. Genes in the p53 gene set are marked with vertical bars, and the enrichment score is shown in green. (C-D) The mRNA expression of p21 and Bax in primary human bone marrow cells, relative to β-actin mRNA, was measured by quantitative real time PCR. (E) Cell cycle status was analyzed by flow cytometry using 7-AAD and BrdU. Numbers in the flow plot represent the percentage of cells in different phases of cell cycle. Results shown for each experiment are representative of 3 independent experiments performed in triplicate (mean ± SEM). *P < .05. **P < .01.
To investigate whether the accumulated p53 protein is transcriptionally active, we examined the expression of p53 target genes. Using gene set enrichment analysis,13 we found that an experimentally determined set of p53 target genes16 are coordinately induced by RPS14 shRNAs compared with control shRNAs in genome-wide gene expression profiling experiments (P < .001, Figure 1B).5 We validated that knockdown of either RPS14 or RPS19 induces the expression of 3 well-established p53 target genes, p21, BAX, and WIG-1, by quantitative RT-PCR (Figure 1C-D; supplemental Figure 2A). In contrast, p53 mRNA expression was not induced (supplemental Figure 2B). These results demonstrate that decreased expression of RPS14 or RPS19 causes an accumulation of transcriptionally active p53 protein, without an increase in p53 mRNA, leading to increased expression of p53 target genes.
Increased expression of the p53 target genes p21 and Bax is followed by cell cycle arrest and apoptosis. We therefore examined whether these downstream consequences of p53 activation occur in primary human hematopoietic progenitor cells in response to partial knockdown of RPS14 and RPS19. Using 7-AAD and BrdU labeling to evaluate cell cycle status, we found that the percentage of cells in S phase decreased from 30% in cells expressing a control shRNA to 5% to 10% in cells expressing either RPS14 or RPS19 shRNAs (Figure 1E). The percentage of cells restricted to G0/G1 increased from 40% in cells expressing the control shRNA to approximately 70% in cells expressing ribosomal gene shRNAs. The proportion of cells in M phase did not change. As we have reported previously for RPS14,5 decreased expression of the RPS14 and RPS19 genes increased apoptosis, as assessed by annexin V staining (supplemental Figure 3). In aggregate, these experiments demonstrate that partial knockdown of RPS14 or RPS19 in primary human hematopoietic progenitor cells induces p53 activity, leading to cell cycle arrest and apoptosis.
Erythroid lineage-specific accumulation of p53 and its downstream effects
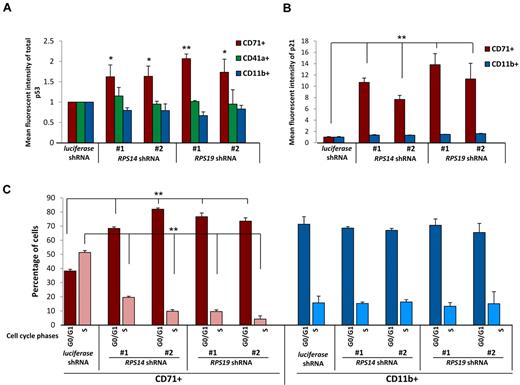
The hematopoietic phenotype of both the 5q− syndrome and DBA is notable for a severe impairment of erythropoiesis with relative preservation of neutrophil and platelet production.3,4,17,18 We therefore examined whether p53 accumulates differentially among lineages in response to decreased expression of RPS14 and RPS19. As shown in Figure 2A, a strong accumulation of p53 protein is evident in erythroid lineage cells. This increase was seen in both early (CD71+GlyA−) as well as later erythroid progenitor cells (CD71+GlyA+) expressing RPS14 or RPS19 shRNAs relative to erythroid lineage cells expressing a control shRNA (supplemental Figure 4A). In contrast, early myeloid (CD13+, CD33+, and CD45+) late myeloid (CD11b+) or megakaryocyte (CD41+) lineage cells did not have increased p53 levels relative to cells expressing the control shRNA (supplemental Figure 4B).
Lineage specificity of p53 accumulation, p21 levels, and cell cycle arrest. (A) Levels of p53 were determined by intracellular flow cytometry in cells expressing control (luciferase), RPS14, or RPS19 shRNAs. Lineage-specific activation of p53 protein was determined by staining for erythroid (CD71), megakaryocytic (CD41a), and myelomonocytic (CD11b) cell surface markers. (B) Levels of p21 were determined by intracellular flow cytometry in cells expressing control (luciferase), RPS14, or RPS19 shRNAs. Lineage-specific activation of p21 protein was determined by staining for erythroid (CD71) and myelomonocytic (CD11b) cell surface markers. (C) Primary human bone marrow cells were infected with control or ribosomal gene shRNAs and allowed to grow and differentiate over 5 days in the presence of cytokines supporting erythroid and myeloid differentiation. Cells were then labeled with BrdU, 7-AAD, and lineage markers (CD11b and CD71). Results in each bar graph are the composite data from 3 independent experiments performed in triplicate (mean ± SEM). *P < .05. **P < .01.
Lineage specificity of p53 accumulation, p21 levels, and cell cycle arrest. (A) Levels of p53 were determined by intracellular flow cytometry in cells expressing control (luciferase), RPS14, or RPS19 shRNAs. Lineage-specific activation of p53 protein was determined by staining for erythroid (CD71), megakaryocytic (CD41a), and myelomonocytic (CD11b) cell surface markers. (B) Levels of p21 were determined by intracellular flow cytometry in cells expressing control (luciferase), RPS14, or RPS19 shRNAs. Lineage-specific activation of p21 protein was determined by staining for erythroid (CD71) and myelomonocytic (CD11b) cell surface markers. (C) Primary human bone marrow cells were infected with control or ribosomal gene shRNAs and allowed to grow and differentiate over 5 days in the presence of cytokines supporting erythroid and myeloid differentiation. Cells were then labeled with BrdU, 7-AAD, and lineage markers (CD11b and CD71). Results in each bar graph are the composite data from 3 independent experiments performed in triplicate (mean ± SEM). *P < .05. **P < .01.
We next examined whether the downstream consequences of p53 activation, increased p21 expression, and cell cycle arrest are lineage restricted. Using flow cytometry, we simultaneously monitored p21 protein expression and lineage markers. Levels of p21 protein increased selectively in the erythroid lineage in cells expressing RPS14 or RPS19 shRNAs relative to the control shRNA (Figure 2B). Moreover, using BrdU and 7-AAD labeling to analyze cell cycle status, we observed a significant increase in cells in G0/G1 and a decrease in cells in S phase in the erythroid lineage in response to the ribosomal gene shRNAs (Figure 2C). The percentage of cells in S phase was lower in the myeloid lineage compared with the erythroid lineage in cells expressing the control shRNA, and the cell cycle status of myeloid lineage cells was not altered in response to RPS14 or RPS19 shRNAs.
RPS14 deficiency causes increased binding of RPL11 to HDM2 without nucleolar disruption
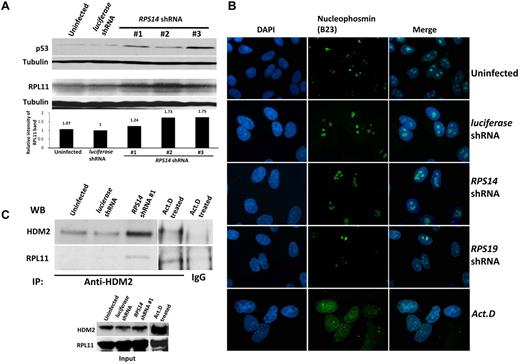
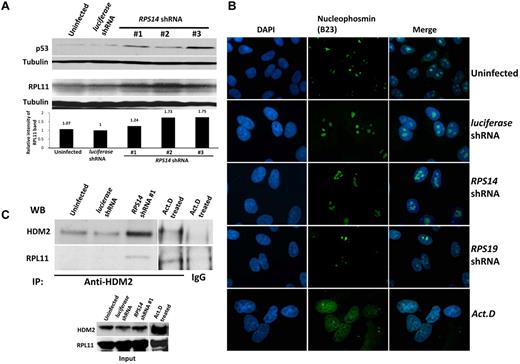
Activation of p53 by ribosomal dysfunction has been attributed either to nucleolar stress19,20 or to increased translation of RPL11 in the setting of intact nucleoli.21 To examine which of these hypotheses is relevant to RPS14 deficiency, we used the A549 cell line, a human cell line with an intact, unmutated p53 pathway, and an established model for studying the effects of ribosome dysfunction on p53 activation.21 As expected, RPS14 shRNAs increased p53 levels in A549 cells (Figure 3A). To evaluate nucleolar integrity, we used immunofluorescent microscopy with an antibody against nucleophosmin (B23). As a control, we examined actinomycin D-treated cells in which the integrity of nucleoli is completely lost, and there is a diffuse staining of B23 in the nucleus. In contrast, we found that cells expressing control, RPS14, or RPS19 shRNAs had discrete, intact nucleoli (Figure 3B). These findings indicate that RPS14 or RPS19 deficiency, like RPS6 deficiency,21 does not cause p53 activation via nucleolar disruption.
Partial knockdown of RPS14 leads to binding of RPL11 to HDM2. (A) Western blots showing the increased levels of p53 and RPL11 in A549 cells expressing the indicated shRNAs for 72 hours. Tubulin was used as a loading control. (B) Immunofluorescent images of discrete or disrupted nucleoli in A549 cells expressing the indicated shRNAs or cells treated with 10 ng/mL actinomycin D (Act. D) for 12 hours, respectively. Nucleoli were stained with an antibody against nucleophosmin (B23). Images were visualized with a fluorescent microscope (Olympus IX71) and with the 100× objective lens (Carl Zeiss) and analyzed using IPlab 3.6.5 software. Cells were mounted in Vectashield mounting medium containing 4,6-diamidino-2-phenylindole as counterstain for DNA. Images were visualized with Olympus PLanF1 using 100×/1.30 Oil objective (Carl Zeiss) and captured using SensiCam High Performance camera (The Cooke Corporation). (C) Immunoprecipitation of A549 cell lysates was performed using anti-HDM2 or normal rabbit IgG antibodies. Western blots show the levels of HDM2 and RPL11 in the immunoprecipitates.
Partial knockdown of RPS14 leads to binding of RPL11 to HDM2. (A) Western blots showing the increased levels of p53 and RPL11 in A549 cells expressing the indicated shRNAs for 72 hours. Tubulin was used as a loading control. (B) Immunofluorescent images of discrete or disrupted nucleoli in A549 cells expressing the indicated shRNAs or cells treated with 10 ng/mL actinomycin D (Act. D) for 12 hours, respectively. Nucleoli were stained with an antibody against nucleophosmin (B23). Images were visualized with a fluorescent microscope (Olympus IX71) and with the 100× objective lens (Carl Zeiss) and analyzed using IPlab 3.6.5 software. Cells were mounted in Vectashield mounting medium containing 4,6-diamidino-2-phenylindole as counterstain for DNA. Images were visualized with Olympus PLanF1 using 100×/1.30 Oil objective (Carl Zeiss) and captured using SensiCam High Performance camera (The Cooke Corporation). (C) Immunoprecipitation of A549 cell lysates was performed using anti-HDM2 or normal rabbit IgG antibodies. Western blots show the levels of HDM2 and RPL11 in the immunoprecipitates.
Multiple studies have demonstrated an interaction between HDM2 and key ribosomal proteins.8,20,22-24 RPS6 haploinsufficiency causes increased translation of RPL11 and increased binding of RPL11 to HDM2, an E3 ubiquitin ligase that targets p53 for destruction.21 We examined whether this mechanism is operative in RPS14-deficient cells and found that RPS14 shRNAs do increase RPL11 protein levels (Figure 3A). Moreover, we found that cells expressing RPS14 shRNAs have an increased level of RPL11 that coimmunoprecipitated with HDM2 (Figure 3C; supplemental Figure 5). These experiments indicate that RPS14 deficiency, like RPS6 deficiency, does not disrupt nucleoli, but instead causes an increase in RPL11 protein levels, increased binding of RPL11 to HDM2, and consequent increase in p53 levels.
Nutlin-3 phenocopies the hematopoietic effects of RPS14 and RPS19 shRNAs
Lineage-specific activation of p53 could be the result of functional differences in the biology of ribosomes in the erythroid lineage or to a particular sensitivity of the erythroid lineage to p53 activation. To address this question, we used a compound, nutlin-3, which binds to HDM2 and prevents the interaction between HDM2 and p53, as well as the interaction between HDM2 and p73, a protein that is structurally related to p53.25,26 Nutlin-3 thereby stabilizes p53 in cells with intact ribosome biogenesis, enabling the dissociation of p53 activation from the effects on ribosome function.
Treatment of primary human CD34+ cells with nutlin-3 for 3 days increased p53 levels in a dose-dependent fashion (Figure 4A). The induction of p53 was biased toward the erythroid lineage, with a significantly higher increase in p53 levels in erythroid cells compared with myeloid cells. As expected, nutlin-3 treatment caused a cell cycle arrest similar to that observed with RPS14 or RPS19 shRNAs (Figure 4B). When cells were allowed to differentiate in vitro for 10 days in the presence of increasing concentrations of nutlin-3, erythroid differentiation was markedly impaired relative to myeloid differentiation (Figure 4C). The more dramatic effect on differentiation is consistent with the compounded effect of lineage-biased cell cycle arrest across multiple cell divisions over the course of 10 days of treatment. These findings indicate that erythroid progenitor cells are more sensitive to p53 activation by chemical inhibition of HDM2 than myeloid progenitor cells, even in the absence of ribosome dysfunction.
Activation of p53 by nutlin-3 recapitulates the effects of RPS14 or RPS19 shRNAs. (A) Primary human CD34+ cells were treated with nutlin-3 for 72 hours and cultured in cytokines supporting erythroid and myeloid differentiation. Levels of p53 in erythroid and myeloid lineage cells were assessed by flow cytometry. (B) Cell cycle status of the nutlin-3-treated cells was analyzed by flow cytometry after labeling with BrdU and 7-AAD. (C) Primary human CD34+ cells were treated with nutlin-3 and cultured in cytokines supporting erythroid and myeloid differentiation for 10 days. The ratio of erythroid to myeloid cells was assessed by flow cytometric analysis GlyA (erythroid) and CD11b (myeloid) expression. (D) A total of 50 000 total bone marrow cells from mice injected with vehicle (dimethyl sulfoxide [DMSO]) or 93 mg/kg of nutlin-3 at alternate day for 5 days were plated on methylcellulose, and colonies were counted after 7 to 10 days in culture (mean ± SEM; n = 5 mice in each group). (E) Bone marrow cells from mice injected with vehicle (DMSO) or 93 mg/kg of nutlin-3 at alternate day for 5 days were plated on methylcellulose, and colonies were counted after 2 and 5 days in culture for CFU-E and BFU-E, respectively (mean ± SEM; n = 5 mice in each group). Results of all in vitro nutlin-3 treatment experiments are representative of 3 independent experiments performed in triplicate (mean ± SEM). *P < .05. **P < .01.
Activation of p53 by nutlin-3 recapitulates the effects of RPS14 or RPS19 shRNAs. (A) Primary human CD34+ cells were treated with nutlin-3 for 72 hours and cultured in cytokines supporting erythroid and myeloid differentiation. Levels of p53 in erythroid and myeloid lineage cells were assessed by flow cytometry. (B) Cell cycle status of the nutlin-3-treated cells was analyzed by flow cytometry after labeling with BrdU and 7-AAD. (C) Primary human CD34+ cells were treated with nutlin-3 and cultured in cytokines supporting erythroid and myeloid differentiation for 10 days. The ratio of erythroid to myeloid cells was assessed by flow cytometric analysis GlyA (erythroid) and CD11b (myeloid) expression. (D) A total of 50 000 total bone marrow cells from mice injected with vehicle (dimethyl sulfoxide [DMSO]) or 93 mg/kg of nutlin-3 at alternate day for 5 days were plated on methylcellulose, and colonies were counted after 7 to 10 days in culture (mean ± SEM; n = 5 mice in each group). (E) Bone marrow cells from mice injected with vehicle (DMSO) or 93 mg/kg of nutlin-3 at alternate day for 5 days were plated on methylcellulose, and colonies were counted after 2 and 5 days in culture for CFU-E and BFU-E, respectively (mean ± SEM; n = 5 mice in each group). Results of all in vitro nutlin-3 treatment experiments are representative of 3 independent experiments performed in triplicate (mean ± SEM). *P < .05. **P < .01.
To examine whether nutlin-3 causes a selective defect in erythropoiesis in vivo, we treated mice with nutlin-3 intraperitoneally at 93 mg/kg for 4 doses on alternate days. We examined the effects of the compound on hematopoietic progenitor cells using methylcellulose colony assays. Granulocyte, monocyte, and mixed colonies were not affected, but erythroid colony formation was significantly decreased in the nutlin-3-treated mice relative to mice treated with the vehicle control (Figure 4D). Both CFU-E and BFU-E colonies were significantly decreased by treatment of mice with nutlin-3 (Figure 4E). In combination, these experiments demonstrate that nutlin-3 causes activation of p53 and impairment of erythropoiesis both in vitro and in vivo, implying a selective sensitivity to p53 activation in erythroid progenitor cells.
Pifithrin-α rescues the hematopoietic effects of RPS14 and RPS19 shRNAs
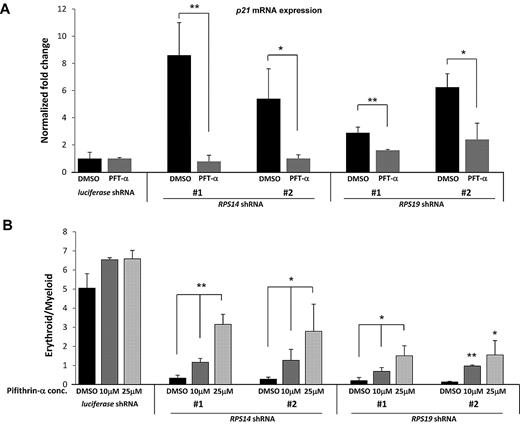
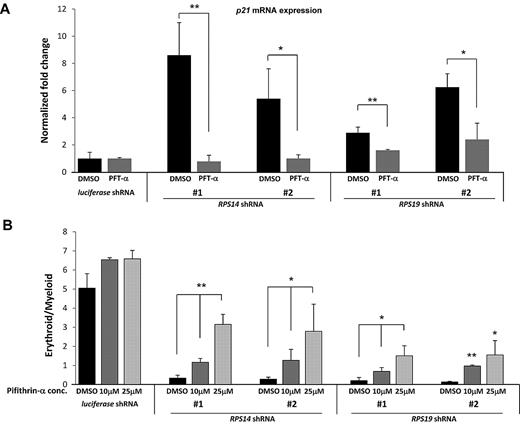
Having demonstrated that activation of p53 is sufficient to impair erythropoiesis, we examined whether inactivation of p53 could rescue the effects of RPS14 or RPS19 deficiency in human hematopoietic progenitor cells. We used a compound, PFT-α, which blocks the transcriptional transactivation activity of p53.27 In primary hematopoietic progenitor cells, we found that treatment with PFT-α blocked the induction of p21 gene expression in response to knockdown of RPS14 or RPS19 (Figure 5A). Similarly, PFT-α prevented the induction of apoptosis that occurs with knockdown of the ribosomal genes (supplemental Figure 6). Although PFT-α has also been shown to suppress heat shock response, glucocorticoid receptor signaling, and transcriptional activity of p73 (a protein that is structurally related to p53),28,29 our experiments demonstrate that PFT-α effectively blocks the effects of p53 activation in response to decreased expression of RPS14 or RPS19.
Treatment of cells with PFT-α rescues the erythroid phenotype of ribosomal gene shRNAs. (A) After infection of CD34+ cells with either a control (luciferase) gene or ribosomal gene shRNAs, cells were treated with different concentrations of PFT-α, an inhibitor of p53 function. After 72 hours, expression of p21 mRNA, relative to β-actin, was analyzed by quantitative RT-PCR. (B) The ratio of erythroid to myeloid lineage cells was also analyzed by flow cytometry using antibodies against surface markers GlyA (erythroid) and CD11b (myeloid) after 8 days in culture. Results of PFT-α experiments are representative of 2 independent experiments performed in triplicate (mean ± SEM). *P < .05. **P < .01.
Treatment of cells with PFT-α rescues the erythroid phenotype of ribosomal gene shRNAs. (A) After infection of CD34+ cells with either a control (luciferase) gene or ribosomal gene shRNAs, cells were treated with different concentrations of PFT-α, an inhibitor of p53 function. After 72 hours, expression of p21 mRNA, relative to β-actin, was analyzed by quantitative RT-PCR. (B) The ratio of erythroid to myeloid lineage cells was also analyzed by flow cytometry using antibodies against surface markers GlyA (erythroid) and CD11b (myeloid) after 8 days in culture. Results of PFT-α experiments are representative of 2 independent experiments performed in triplicate (mean ± SEM). *P < .05. **P < .01.
We next examined whether PFT-α mitigates the selective impairment of erythropoiesis resulting from deficiency of RPS14 or RPS19. Treatment with PFT-α caused a dose-dependent rescue of erythroid differentiation in cells expressing RPS14 or RPS19 shRNAs but did not alter differentiation in cells expressing a control shRNA (Figure 5B). Pharmacologic manipulation of the p53 pathway therefore has the potential to improve the erythropoietic defect seen in patients with DBA or the 5q− syndrome.
Nuclear p53 staining in erythroid progenitor cells of del(5q) MDS and DBA patients
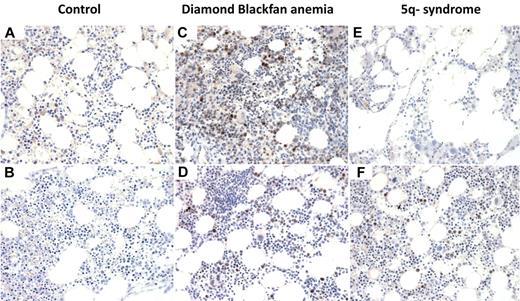
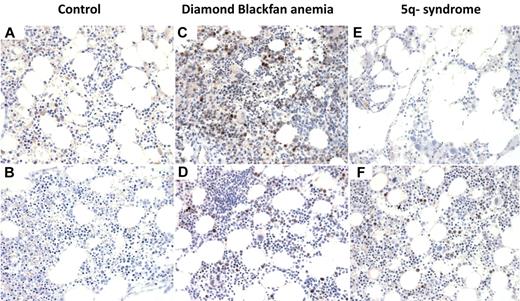
To examine directly whether p53 accumulation is operative in patients with ribosomal disorders, we performed immunohistochemistry on bone marrow biopsies from patients with del(5q) MDS and DBA. Bone marrow biopsies from patients with nonribosomal disorders of erythropoiesis, including aplastic anemia and autoimmune hemolytic anemia, did not have significant nuclear p53 staining (Figure 6). We analyzed bone marrow biopsies from 4 cases of patients with MDS and del(5q) and found strong nuclear p53 staining in 2 cases and absent staining in 2 cases. In biopsies from 8 patients with DBA, we found strong nuclear p53 staining in 2 cases and weak nuclear p53 staining in the remaining 6 cases (Figure 6; supplemental Table 1).
p53 staining of bone marrow biopsies. Immunohistochemistry for p53 on histologic sections of bone marrow biopsies from patients with (A) aplastic anemia, (B) autoimmune hemolytic anemia, (C-D) DBA, and (E-F) MDS with del(5q). (A-F) Original magnification ×400. The samples were analyzed using an Olympus BX41 microscope with the objective lens of 40×/0.75 Olympus UPlanFL (Olympus). The pictures were taken using Olympus QColor5 and analyzed with acquisition software QCapture Pro v6.0 (QImaging) and Adobe Photoshop 6.0.
p53 staining of bone marrow biopsies. Immunohistochemistry for p53 on histologic sections of bone marrow biopsies from patients with (A) aplastic anemia, (B) autoimmune hemolytic anemia, (C-D) DBA, and (E-F) MDS with del(5q). (A-F) Original magnification ×400. The samples were analyzed using an Olympus BX41 microscope with the objective lens of 40×/0.75 Olympus UPlanFL (Olympus). The pictures were taken using Olympus QColor5 and analyzed with acquisition software QCapture Pro v6.0 (QImaging) and Adobe Photoshop 6.0.
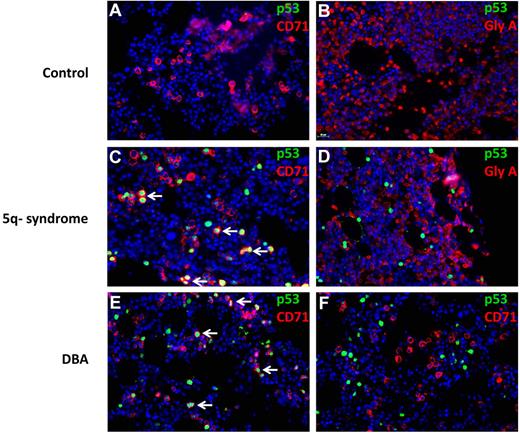
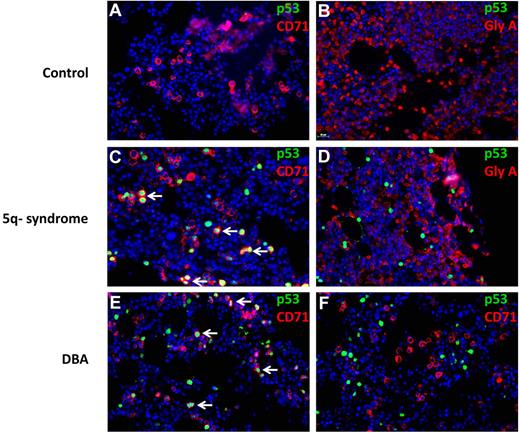
We analyzed the lineage specificity of p53 accumulation by simultaneously staining for p53 and lineage-specific cell surface antigens using fluorescently labeled antibodies (Figure 7). In del(5q) MDS, p53+ cells coexpress the CD71 antigen, expressed in immature erythroid progenitor cells. More terminally differentiated erythroid progenitor cells that express glycophorin A did not have evidence of nuclear p53 accumulation. In DBA, one patient had strong p53 staining in CD71+ cells (Figure 7E), whereas a second patient had p53 staining that was not in CD71+ cells (Figure 7F). In aggregate, these findings demonstrate that human disorders associated with ribosomal gene haploinsufficiency can cause selective activation of p53 in erythroid progenitor cells.
Colocalization of p53 and CD71 in 5q− and DBA patient samples. Histologic sections of bone marrow biopsies from patients were analyzed by double immunofluorescence for p53 and cell surface markers (CD71 or GlyA). The antibodies used are indicated in each panel. Bone marrow biopsies are shown from patients with hemolytic anemia (A-B), del(5q) MDS (C-D), and DBA (E-F). (A-F) Original magnification ×400. The stained slides were scanned using the TissueFAXS Plus automated microscopic workstation (Tissuegnostics) with a Zeiss Axiolmager Z1 using a 40× Zeiss objective using a high sensitivity digital monochrome camera for fluorescence microscopy (TissueGnostics), and captured using TissueFAXS 1.3 software (TissueGnostics). Final images were transferred into Adobe Photoshop 6.0 where TIF files were created. Scale bar represents 25 μm.
Colocalization of p53 and CD71 in 5q− and DBA patient samples. Histologic sections of bone marrow biopsies from patients were analyzed by double immunofluorescence for p53 and cell surface markers (CD71 or GlyA). The antibodies used are indicated in each panel. Bone marrow biopsies are shown from patients with hemolytic anemia (A-B), del(5q) MDS (C-D), and DBA (E-F). (A-F) Original magnification ×400. The stained slides were scanned using the TissueFAXS Plus automated microscopic workstation (Tissuegnostics) with a Zeiss Axiolmager Z1 using a 40× Zeiss objective using a high sensitivity digital monochrome camera for fluorescence microscopy (TissueGnostics), and captured using TissueFAXS 1.3 software (TissueGnostics). Final images were transferred into Adobe Photoshop 6.0 where TIF files were created. Scale bar represents 25 μm.
Discussion
Although ribosomes are active in all cell types, the predominant phenotype of ribosomal gene haploinsufficiency is a failure of erythropoiesis.3,7,30,31 We found that decreased expression of the RPS14 or RPS19 genes causes selective activation of the p53 pathway in erythroid progenitor cells compared with cells from other hematopoietic lineages. Activation of the p53 pathway results in erythroid-specific cell cycle arrest and apoptosis, consistent with the hematopoietic phenotypes of the 5q− syndrome and DBA. Moreover, we found an accumulation of p53 in erythroid progenitor cells in bone marrow biopsies from patients with del(5q) MDS and DBA.
We found that decreased expression of RPS14 increases the levels of RPL11, which binds to HDM2, as reported for RPS6 haploinsufficiency, providing a mechanism for p53 activation.21 In addition, we found selective impairment of erythropoiesis in response to nutlin-3, a compound that prevents HDM2-mediated destruction of p53 in an analogous manner to the effects of RPL11. This finding indicates that the sensitivity of erythroid progenitor cells to HDM2-mediated p53 induction can occur even in the absence of ribosome dysfunction.
Bone marrow pathology in MDS and other bone marrow failure states is often challenging to interpret, and immunohistochemistry for p53 may have diagnostic utility. Accumulation of nuclear p53 in erythroid progenitor cells of MDS and DBA patients corresponds with the results of our experimental studies. Our findings of p53 staining in del(5q) MDS is consistent with a recent report of strong p53 staining in all 3 bone marrow biopsies from patients with 5q− syndrome analyzed.32 Although striking in some cases, we found significant variability in p53 staining. In DBA, p53 levels may depend on the particular congenital mutation as well as disease status because some patients have spontaneous remissions.33 In MDS, variability in p53 staining may be the result of genetic or epigenetic silencing of the p53 pathway. Indeed, inactivation of the p53 pathway may be essential for clonal progression of the 5q− syndrome to acute myeloid leukemia. Examination of larger numbers of patient samples will inform the diagnostic utility of p53 immunohistochemistry in bone marrow failure states.
The p53 pathway may play a particularly important role in the erythroid lineage, improving the efficiency of erythropoiesis and preventing malignant transformation. Previous work has implicated the p53 pathway in erythroid maturation, potentially sensitizing this lineage to further activation of the pathway in the setting of ribosomal haploinsufficiency.34 Given the large number of cells produced from each erythroid progenitor cell,35 induction of p53 in erythroid progenitor cells with genetic or ribosomal abnormalities could prevent the needless expenditure of energy producing dysfunctional erythrocytes. Indeed, rapid proliferation may be important for the sensitivity of cells with ribosomal haploinsufficiency to p53 activation as stimulated but not resting T cells activate p53 in response to happloinsufficient RSP6 protein.36 Thus, the erythroid specific effects reported here probably include contributions from general effects arising from the enhanced sensitivity of proliferating cells to p53 activation as the lineages examined differ substantially in their proliferation potential. In addition, sensitivity of erythroid progenitor cells to p53 activation could prevent the development of leukemia in response to genotoxic stress. Indeed, despite the tremendous capacity for proliferation in erythroid cells, malignancies of the erythroid lineage are far less common than other myeloid leukemias.37,38
The reversal of p53 activity with the compound PFT-α indicates that pharmacologic manipulation of the p53 pathway could benefit patients with ribosome dysfunction. Although the elimination of p53 activity would result in genome instability,39,40 short pulses of treatments might have therapeutic utility given the long life span of erythrocytes. Careful clinical trials would be required to examine whether the risks of therapy exceed the potential benefits of reducing the morbidity and mortality resulting from chronic corticosteroid therapy and iron overload from chronic transfusions.
Our finding that erythroid progenitor cells have increased sensitivity to HDM2-mediated p53 accumulation has implications for the pathogenesis and treatment of human diseases beyond the 5q− syndrome and DBA. Other genetic abnormalities may activate p53, resulting in an analogous impairment of erythropoiesis. For example, failure of telomere maintenance or DNA damage response, the central abnormalities in dyskeratosis congenital and Fanconi anemia, respectively, activate the p53 pathway.41,42 Many MDS patients without 5q deletions have a macrocytic anemia and may activate p53 through different mechanisms. The p53 pathway may therefore play an important role in the pathogenesis of anemia in many congenital or acquired bone marrow failure syndromes.
An Inside Blood analysis of this article appears at the front of this issue.
The online version of this article contains a data supplement.
The publication costs of this article were defrayed in part by page charge payment. Therefore, and solely to indicate this fact, this article is hereby marked “advertisement” in accordance with 18 USC section 1734.
Acknowledgments
The authors thank Damien Wilpitz and Marie McConkey for general laboratory support.
This work was supported by the National Institutes of Health (grants 5R01 HL082945 and P01 CA108631) and the Burroughs-Wellcome Fund (Career Award for Medical Scientists; B.L.E.).
National Institutes of Health
Authorship
Contribution: S.D. and B.L.E. designed the experiments; S.D., A.N., K.L., A.M., N.A., C.M., F.H.W., J.L.K., and T.C. performed the experiments; S.D. and B.L.E. analyzed data; and S.D. and B.L.E. wrote the paper with input from N.B. and A.K.-G.
Conflict-of-interest disclosure: The authors declare no competing financial interests.
Correspondence: Benjamin L. Ebert, 1 Blackfan Circle, Karp 5.210, Boston, MA 02115; e-mail: bebert@partners.org.

![Figure 4. Activation of p53 by nutlin-3 recapitulates the effects of RPS14 or RPS19 shRNAs. (A) Primary human CD34+ cells were treated with nutlin-3 for 72 hours and cultured in cytokines supporting erythroid and myeloid differentiation. Levels of p53 in erythroid and myeloid lineage cells were assessed by flow cytometry. (B) Cell cycle status of the nutlin-3-treated cells was analyzed by flow cytometry after labeling with BrdU and 7-AAD. (C) Primary human CD34+ cells were treated with nutlin-3 and cultured in cytokines supporting erythroid and myeloid differentiation for 10 days. The ratio of erythroid to myeloid cells was assessed by flow cytometric analysis GlyA (erythroid) and CD11b (myeloid) expression. (D) A total of 50 000 total bone marrow cells from mice injected with vehicle (dimethyl sulfoxide [DMSO]) or 93 mg/kg of nutlin-3 at alternate day for 5 days were plated on methylcellulose, and colonies were counted after 7 to 10 days in culture (mean ± SEM; n = 5 mice in each group). (E) Bone marrow cells from mice injected with vehicle (DMSO) or 93 mg/kg of nutlin-3 at alternate day for 5 days were plated on methylcellulose, and colonies were counted after 2 and 5 days in culture for CFU-E and BFU-E, respectively (mean ± SEM; n = 5 mice in each group). Results of all in vitro nutlin-3 treatment experiments are representative of 3 independent experiments performed in triplicate (mean ± SEM). *P < .05. **P < .01.](https://ash.silverchair-cdn.com/ash/content_public/journal/blood/117/9/10.1182_blood-2010-07-295238/4/m_zh89991065000004.jpeg?Expires=1769346840&Signature=KmoJ5JDGtbSQB8~PR1h1vqVYjsj3DRqQvWeqh8ECQLU3yRYGng53Za-xzGCbA5xAmykYofwnDxqb7dxzirv2O-IAMqF8vuS3n25qH9TO~F318gB5gGim-2zWbwglxrBLzNZcI3HjLExQk2o028k71svhU0pR0VsTHyr1y6YLaAZkTCejE--9ee57uJRtrhPw2j~rmyXhgVjY16HxCv5CpblT7XcrVbF0Wz3LRTAgT3-4KEkwi~BH-UsPPa5NMD6gC5t1tqIp3r8GWeWqGZ7n~fSCWoZ4yf8Io3CmQTryZSXfcodPnD2Q5l6e8taMu~5V4AEujLEKLy2tYjKQFsRoSg__&Key-Pair-Id=APKAIE5G5CRDK6RD3PGA)

![Figure 4. Activation of p53 by nutlin-3 recapitulates the effects of RPS14 or RPS19 shRNAs. (A) Primary human CD34+ cells were treated with nutlin-3 for 72 hours and cultured in cytokines supporting erythroid and myeloid differentiation. Levels of p53 in erythroid and myeloid lineage cells were assessed by flow cytometry. (B) Cell cycle status of the nutlin-3-treated cells was analyzed by flow cytometry after labeling with BrdU and 7-AAD. (C) Primary human CD34+ cells were treated with nutlin-3 and cultured in cytokines supporting erythroid and myeloid differentiation for 10 days. The ratio of erythroid to myeloid cells was assessed by flow cytometric analysis GlyA (erythroid) and CD11b (myeloid) expression. (D) A total of 50 000 total bone marrow cells from mice injected with vehicle (dimethyl sulfoxide [DMSO]) or 93 mg/kg of nutlin-3 at alternate day for 5 days were plated on methylcellulose, and colonies were counted after 7 to 10 days in culture (mean ± SEM; n = 5 mice in each group). (E) Bone marrow cells from mice injected with vehicle (DMSO) or 93 mg/kg of nutlin-3 at alternate day for 5 days were plated on methylcellulose, and colonies were counted after 2 and 5 days in culture for CFU-E and BFU-E, respectively (mean ± SEM; n = 5 mice in each group). Results of all in vitro nutlin-3 treatment experiments are representative of 3 independent experiments performed in triplicate (mean ± SEM). *P < .05. **P < .01.](https://ash.silverchair-cdn.com/ash/content_public/journal/blood/117/9/10.1182_blood-2010-07-295238/4/m_zh89991065000004.jpeg?Expires=1769832638&Signature=du-MwzPx0Inf0Iy7o51DbJO7G3sS7euuoyVevvnRuXD35OF60dhrVmzt4jjh6YQk0sdx3PonRCkvRDJqXvFJWAUDNgKQOEOFl7zuPKVHdtNgWyt48yd-IHeMmIQu4WWGEYOd1J41TcfqNV2VF77LDEEuk7gVwKohal09vPCpfd50ziCN8U4cBiv3l7D75GbTcz~kAq6ixhjbuz8Ls7p6~qIW44145BhesOO5sb436fv7ztI4oXtoauvS~G8vTkUj9FKg45YfbKBcG~iNhBPLQVaVlXvbnBP6uPaScOo1r4l32ypwuKgfg-NJDST~qz4gz4ZvNGp1Ml6mmOSuaNG1RA__&Key-Pair-Id=APKAIE5G5CRDK6RD3PGA)
