Abstract
Abstract 53
Prior studies have demonstrated a graft-versus-malignancy effect following allogeneic HSCT that is variably linked to acute or chronic GVHD. Although a graft vs. Myeloma (MM) effect has been shown after myeloablative allogeneic HSCT, a higher treatment related mortality (TRM) risk leads to inferior survival compared with autologous HSCT. Non-myeloablative (NMA) and reduced intensity conditioning (RIC) approaches are used to reduce the risk of TRM while preserving the graft vs. MM effect. The clinical benefit of lower intensity conditioning regimens is thus especially dependent on the impact of acute or chronic GVHD on graft vs. MM effect and TRM. We analyzed the outcomes of 177 matched sibling allogeneic HSCT recipients reported to the CIBMTR between 1997 and 2005 following NMA (n=120) or RIC (n=57) performed within 18 months of diagnosis. Median age was 50 (range 24-69) years and 62% were Durie-Salmon Stage III. Tandem autologous followed by allogeneic HSCT (autologous+ allogeneic) recipients (n=105) were more likely to receive NMA conditioning vs. recipients of an upfront allogeneic HSCT (n=72). Majority (98%) received peripheral blood stem cell grafts. Outcomes at a median follow-up of 36 (3 - 98) months are summarized in table 1.
| Outcomes: . | Probability (95 % CI) . |
|---|---|
| Acute GVHD (aGVHD) @ 100 days, grades (I-IV) | 42 (35 – 49)% |
| Chronic GVHD (cGVHD) @ 3 years | 55 (47 – 64)% |
| TRM @ 3 years | 21 (15 – 28)% |
| Relapse @ 3 years | 44 (35 – 53)% |
| Progression-free survival (PFS) @ 3 years, % | 35 (27 – 44)% |
| Overall Survival (OS) @ 3 years | 56 (48 – 65)% |
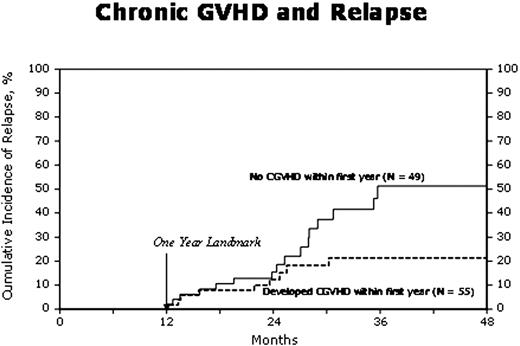
In order to assess the impact of GVHD on outcomes, Cox proportional hazards regression models were built with GVHD as the main effect treating it as a time dependent covariate (Table 2). Other covariates in the multivariate models included age, sex, performance status, IgG vs. non IgG myeloma, disease status and chemosensitivity, prior lines of chemotherapy, donor-recipient sex match, NMA vs. RIC and year of transplant. AGVHD was associated with an increased risk of TRM. Tandem autologous + allogeneic HSCT was associated with reduced relapse risk (RR= 0.49, p=0.008). AGVHD had no impact on relapse/progression of MM while cGVHD was associated with a reduced risk of relapse (Figure. 1). The protective effect of cGVHD on relapse was significant in the non IgG MM subgroup. AGVHD had no impact on PFS whereas cGVHD was associated with superior PFS and lower risk of treatment failure. Later year of HSCT was also associated with superior PFS. Overall survival was not affected by cGVHD while recipients of tandem autologous + allogeneic HSCT had a higher mortality in the presence of aGVHD (RR=3.60, p= 0.01). After matched sibling allogeneic HSCT for MM, aGVHD is associated with a higher risk of TRM whereas cGVHD decreases the risk of relapse and improves PFS. The effect of cGVHD may vary with the type of MM with greater impact in non IgG MM. Further study to identify subtypes of MM susceptible to an immune mediated graft vs. MM effect is suggested.
| Outcomes . | Relative risk (95% CI) . | |||
|---|---|---|---|---|
| TRM . | Relapse . | Treatment Failure (Inverse of PFS) . | Mortality . | |
| AGVHD | 2.38 (1.16 – 4.88) P=0.01 | 1.04 (0.61 – 1.77) P=NS | 1.25 (0.83 – 1.88) P= NS | 1.60 (0.98 – 2.62) P=NS |
| CGVHD | 1.17 (0.50 – 2.78) P=NS | 0.43 (0.22 – 0.83) P=0.01 | 0.60 (0.36 – 1.00) P=0.04 | 0.90 (0.52 – 1.57) P= NS |
CI=confidence interval; P=pvalue: NS=not significant
Lonial:Celgene: Consultancy; Millennium: Consultancy, Research Funding; BMS: Consultancy; Novartis: Consultancy; Gloucester: Research Funding.
Author notes
Asterisk with author names denotes non-ASH members.


