Abstract
Expression of Mpl is restricted to hematopoietic cells in the megakaryocyte lineage and to undifferentiated progenitors, where it initiates critical cell survival and proliferation signals after stimulation by its ligand, thrombopoietin (TPO). As a result, a deficiency in Mpl function in patients with congenital amegakaryocytic thrombocytopenia (CAMT) and in mpl−/− mice produces profound thrombocytopenia and a severe stem cell–repopulating defect. Gene therapy has the potential to correct the hematopoietic defects of CAMT by ectopic gene expression that restores normal Mpl receptor activity. We rescued the mpl−/− mouse with a transgenic vector expressing mpl from the promoter elements of the 2-kb region of DNA just proximal to the natural gene start site. Transgene rescued mice exhibit thrombocytosis but only partial correction of the stem cell defect. Furthermore, they show very low-level expression of Mpl on platelets and megakaryocytes, and the transgene-rescued megakaryocytes exhibit diminished TPO-dependent kinase phosphorylation and reduced platelet production in bone marrow chimeras. Thrombocytosis is an unexpected consequence of reduced Mpl expression and activity. However, impaired TPO homeostasis in the transgene-rescued mice produces elevated plasma TPO levels, which serves as an unchecked stimulus to drive the observed excessive megakaryocytopoiesis.
Introduction
Thrombopoietin (TPO) plays a dual role in hematopoiesis, acting as both the primary stimulus for megakaryocytopoiesis and as a critical factor supporting hematopoietic stem cell (HSC) survival and proliferation.1 TPO-induced homodimerization of its cognate receptor, Mpl, induces activation of the Jak/Stat family of tyrosine kinases, leading to the generation of multiple downstream proproliferative and antiapoptotic signals.2 Both TPO-deficient (Tpo−/−) and Mpl-deficient (mpl−/−) mice exhibit severe thrombocytopenia,3,4 and marrow cells transplanted from mpl−/− mice demonstrate a profound repopulating defect.5-8 In humans, loss-of-function mutations in Mpl are the cause for the clinical disorder congenital amegakaryocytic thrombocytopenia (CAMT).9,10 Individuals with CAMT present with isolated thrombocytopenia in early childhood and eventually develop marrow failure with pancytopenia. A more rapid progression has been described in patients who have complete loss of Mpl function than in those with missense mutations that permit some residual receptor activity.11,12 CAMT has the potential to be cured by gene therapy through the addition of a normal mpl transgene into the HSCs of affected individuals. Furthermore, because mpl-transduced stem cells would be endowed with proliferative and survival advantages, it should be possible to cure CAMT by correction of a small percentage of diseased stem cells and with submyeloablative conditioning.
One of the major challenges to the restoration of physiologic TPO/Mpl signaling is the development of vectors that will restrict Mpl expression to undifferentiated hematopoietic cells and those committed to the megakaryocyte lineage. TPO is constitutively produced, mainly by the liver and to a lesser extent by the kidneys and skeletal muscle.2 Its lineage-specific proliferative and survival effects are due to the tissue-restricted pattern of Mpl expression. Furthermore, because TPO is internalized and destroyed after binding to Mpl, plasma TPO levels are primarily regulated by megakaryocyte and platelet mass.13-20 In murine hematopoietic stem cell gene transfer studies, ectopic expression of an Mpl transgene under the direction of a constitutive promoter produced dyshematopoieses with both inappropriate expansion of erythroid cells and the development of thrombocytopenia due to depressed plasma TPO levels.21-24
Successful gene therapy of CAMT necessitates ectopic expression of Mpl in a manner that faithfully mimics its pattern in nature. Using a transgenic mouse model, Zieglar et al demonstrated that the 2-kb portion of noncoding DNA just upstream of the Mpl start site is capable of directing alkaline phosphatase reporter gene expression limited to platelets and megakaryocytes of adult mice and cells of early embryonic hematopoiesis in fetal mice.25 In this report, we describe rescue of the mpl−/− mouse by ectopic expression of an mpl transgene under control of the same 2-kb promoter. The transgene-rescued mice show low-level expression of Mpl in the megakaryocyte lineage and only partial recovery of the stem cell–repopulating defect. Surprisingly, the rescued mice also exhibit high peripheral blood platelet counts due to excessive megakaryocytopoiesis driven by elevated plasma TPO levels. These results demonstrate a paradoxical mechanism for the development of thrombocytosis. Decreased Mpl expression on platelets and megakaryocytes may be a more common etiology for idiopathic thrombocytosis than is currently recognized.
Methods
Mice
All mice were maintained in a specific pathogen–free facility and studied under a protocol approved by the University of Washington Institutional Animal Care and Use Committee. The mpl−/− mice backcrossed into the C57BL/6J background were generously provided by Dr Warren Alexander (The Walter and Eliza Hall Institute of Medical Research, Parkville, Australia).26 The wild-type (WT) congenic control mice used were C57BL/6J (Ly5.2), B6.SJL-Ptprca Pepcb/BoyJ (Ly5.1), and green fluorescent protein (GFP)–expressing C57BL/6-Tg(UBC-GFP)30Scha/J [Tg(GFP)], all purchased from The Jackson Laboratory (Bar Harbor, ME). The Mpl transgenic correction vector was generated by cloning an Mpl minigene, containing the murine mpl coding region with its first natural intron, into pBluescript just distal to the previously described 2-kb Mpl promoter (a gift from Radek Skoda, University Hospital Basel, Basel, Switzerland). The vector was linearized and microinjected into single-cell mouse embryos from a mpl−/− mouse, which were then implanted into pseudopregnant females.27 Offspring were screened by polymerase chain reaction (PCR) and Southern blot and mpl transgene–containing mice were initially bred with mpl−/− mice to generate a line of C57BL/6Jmpl−/−Tg(mpl) mice. In subsequent generations, these transgene-corrected [Tg(mpl)] mice were interbred.
DNA preparation/Southern blotting
DNA was prepared from the splenocytes of WT and Tg(mpl)–corrected mice using the Puregene DNA isolation kit (QIAGEN, Valencia, CA) per manufacturer's instructions. Southern blots were performed using standard techniques on 10 μg NspI-digested genomic DNA from Tg(mpl) mice and control samples made by dilution of the transgenic vector into genomic mpl−/− DNA.28 Blots were probed with a 562-bp EcoRI/XhoI fragment containing sequence from exons 3 to 5 of mpl, generated by PCR of the mpl cDNA with the primers CATACAGAATTCCTTTGGAACCCGGTATGTGT and TCACATCTCGAGATCCACAGTCACAGGGAAGG and cloning of the amplicon in pBluescript. Vector copy numbers were quantified by PhosphorImager analysis (GE Healthcare, Little Chalfont, United Kingdom).
RNA preparation and quantitave real-time PCR
Total RNA was isolated using TRIzol Reagent (Invitrogen, Carlsbad, CA) per the manufacturer's instructions. Reverse transcription was performed with the SuperScript III First-Strand Synthesis System (Invitrogen) using 1 μg RNA in a 20-μL reaction per manufacturer's instructions. Quantitative real-time PCR (qPCR) was performed on a Light Cycler 2.0 machine (Roche Applied Science, Indianapolis, IN) using LightCycler FastStart DNA MasterPLUS SYBR Green I. The following primer pairs were used to detect: (1) murine mpl—TGCTTCTGGGATGAGGAAG (located in exon 2) and AGGCCCACACTATCCAC (located in exon 3) and (2) murine Gapdh—AGAGCTGAACGGGAAG and CTGTTGAATGCGCAGG. Results were normalized using a standard curve generated by dilutions of a plasmid containing murine Gapdh.
Western blot analysis
For platelet lysate preparation, mice were anesthetized and blood was drawn from the retro-orbital sinus. Blood was diluted with 3.2% Na3C6H5O7 (sodium citrate) and centrifuged at 300g for 15 minutes. Platelet-rich plasma (PRP) was isolated and centrifuged at 1550g for 10 minutes. Liquid culture megakaryocyte progenitors were washed once with ice-cold PBS; megakaryocytes and platelets were lysed in a buffer composed of 50 mM HEPES (pH 7.4), 150 mM NaCl, 10% glycerol, 1% Triton X-100, 1.5 mM MgCl2 1 mM EGTA, 100 mM NaF, 1 mM phenylmethylsulfonyl fluoride, 1 mM NaVO4, 1 μg/mL leupeptin, and 1 μg/mL aprotinin. Whole-cell lysates were obtained by centrifugation at 14 000g for 15 minutes at 4°C. The protein concentrations were determined using the Protein/DC Assay (Bio-Rad, Hercules, CA) to assure equal loading between lanes. For each sample, 45 μg total protein was denatured by boiling for 10 minutes in loading buffer containing a final concentration of 63 mM Tris/base (pH 6.8), 1% β-mercaptoethanol, 1% sodium dodecyl sulfate, and 10% glycerol. Proteins were size-separated on a 4% to 20% denaturing polyacrylamide gel, transferred to nitrocellulose, blocked with PBS containing 6% BSA, probed with antibodies, and visualized by chemiluminescence as previously described.29 Membranes were probed with the following primary antibodies: polyclonal anti–phospho-Stat3 (Tyr705), polyclonal anti-Stat3, polyclonal anti–phospho-Stat5 (Tyr694), polyclonal anti-Stat5, polyclonal anti–phospho–mitogen-activated protein kinase (MAPK; Thr202/Tyr204), and polyclonal anti-MAPK (Cell Signaling Technology, Beverly, MA); polycolonal anti–phospho-Jak2 (Tyr1007/1008) and polyclonal anti-Jak2 (Upstate Biotechnology, Lake Placid, NY); and polyclonal Mpl antiserum (kindly provided by Amgen, Thousand Oaks, CA). Secondary antibodies, horseradish peroxidase–coupled goat anti–mouse IgG or goat anti–rabbit IgG, were purchased from Bio-Rad. Quantitation of immunoreactive bands was performed by using the Kodak Image Station 440cf (Kodak, Rochester, NY).
Flow cytometric analysis
All studies on peripheral blood and marrow samples were performed on single-cell suspensions stained in cold fluorescence-activated cell sorter (FACS) buffer (PBS supplemented with 1% FBS) with the indicated anti–mouse antibodies and appropriate isotype-matched controls used at concentrations recommended by the manufacturer. After staining on ice for 30 minutes, cells were washed twice in FACS buffer and fluorescence was analyzed using a FACSCalibur flow cytometer and CellQuest software (Becton Dickinson, San Jose, CA). Analysis of peripheral blood cells was performed with gates set to identify platelets, white blood cells (WBCs), and red blood cells (RBCs) according to their forward scatter (FSC) and side scatter (SSC) characteristics.
Peripheral blood counts and TPO levels
In determining peripheral blood counts, platelet activation and clumping were minimized by drawing blood from the inferior vena cavas of anesthetized mice into syringes containing 1.5% EDTA (pH 8.0) at a final ratio of 1 part anticoagulant to 9 parts blood. Platelet counts were determined on a flow cytometer on samples diluted 1:600 in PBS by quantitating the number of particles falling into a FSC and SSC platelet gate in the volume of fluid analyzed in 20 seconds. To validate the platelet gate, some blood samples were diluted 1:50 in PBS and stained with anti-GPIb–FITC (clone Xia.G5; EMFRET Analytics, Eibelstadt, Germany) prior to making a 1:600 dilution in PBS and analysis of GPIb+ particles by flow cytometry. Hemoglobin concentrations and WBC counts were determined using a Coulter T890 (Beckman Coulter, Fullerton, CA). TPO assays were performed on 1:5 diluted platelet-poor plasma from inferior cava–drawn blood using a TPO ELISA kit (R&D Systems, Minneapolis, MN) per the manufacturer's instructions.
Bone marrow cell isolation, progenitor cell culture, and purification
Bone marrow cells were flushed from the femurs and tibias of 6- to 10-week-old mice with Iscove-modified Dulbecco medium (IMDM) containing 5% heat-inactivated FBS. The dilute bone marrow was filtered through 70-μm mesh to remove bone particles; RBCs were lysed in hypotonic buffer (155 mM NH4Cl, 7.3 mM NaHCO3, and 126 μM EDTA), and nucleated cells were resuspended in growth media. Marrow mononuclear cells were stained with anti-CD41–FITC (BD Pharmingen) and analyzed by flow cytometry. Erythroid (E) and granulocyte-macrophage (GM) progenitors (burst-forming unit [BFU]–E, colony-forming unit [CFU]–GM, and CFU–granulocyte, erythroid, macrophage, megakaryocyte [GEMM]) were cultured in methylcellulose-based media (Methocult GF M3434; StemCell Technologies, Vancouver, BC) and megakaryocyte progenitors (CFU-Mk) were cultured in collagen-based media (MegaCult-C; StemCell Technologies) supplemented with 50 ng/mL recombinant murine TPO and 10 ng/mL recombinant murine IL-3 (PeproTech, Rocky Hill, NJ) per the manufacturer's instructions. Liquid culture megakaryocyte progenitors were generated by culturing bone marrow mononuclear cells in IMDM supplemented with 1% Nutridoma-SP (Roche Molecular Biochemicals), 2 mM l-glutamine, and 37.5 ng/mL mTPO as previously described.30 After 72 hours in culture (37°C; 5% CO2, humidified incubator) megakaryocyte lineage differentiation and cell ploidy was evaluated by flow cytometry by staining with anti-CD41–FITC (BD Pharmingen) and propidium iodide (Sigma-Aldrich, St Louis, MO) as described.31 Simultaneously, unstained cells were harvested by low-speed centrifugation (400 rpm for 10 minutes) and purified by unit gravity sedimentation on a discontinuous bovine serum albumin (BSA) density gradient for RNA isolation and cell lysis for Western blot analysis.30
LSK cell isolation
After harvesting bone marrow cells, RBCs were lysed and committed hematopoietic cells were removed using a lineage cell depletion kit (Miltenyi Biotec, Auburn, CA) per the manufacturer's instructions. The remaining cells were subsequently stained with anti–Sca-1–PE (eBioscience, San Diego, CA) and anti-CD117 (c-Kit)–APC (eBioscience), and then the double-positive lineage-negative/Sca-1+/c-Kit+ (LSK) cells were sorted using a FACSVantage SE II cell sorter (Becton Dickinson, San Jose, CA).
Transplantation studies
Transplant recipients were 6- to 10-week-old mice irradiated using a Mark I-68 137Cs irradiator (J. L. Shepherd & Associates, San Fernando, CA). In studies comparing Ly5.1 and Ly5.2 repopulating cells, 3 × 10⁵ marrow mononuclear cells from each donor source were transplanted into 1070 cGy–irradiated B6.SJL-Ptprca Pepcb/BoyJ (Ly5.1) recipients.7,32 Flow cytometric evaluation of repopulating ability was performed on peripheral blood cells at 16 weeks after transplantation by staining buffy coat cells with anti-CD45.1–PE (BD Pharmingen) and anti-CD45.2–FITC (BD Pharmingen).7,32 The repopulating ability for all Ly5.2 donors was reported as a percentage of the normal Ly5.1 competitor cell repopulating ability (% Ly5.2+ peripheral blood leukocytes/% Ly5.1+ peripheral blood leukocytes × 100). In the other repopulating studies, 3 × 10⁵ marrow mononuclear cells from Tg(mpl) mice and 105 marrow mononuclear cells from Tg(GFP) mice were transplanted into 850 cGy–irradiated Tg(mpl) recipients. GFP expression on peripheral blood cells was performed at 16 weeks after transplantation. Platelets were analyzed by flow cytometry on FSC- and SSC-defined platelet populations of anticoagulated whole blood, and leukocytes were analyzed after staining buffy coat cells with anti-CD45.2–PerCP-Cy5.5 (BD Pharmingen).
Histologic analysis
Femurs harvested from mice were fixed in buffered formalin and embedded in paraffin. Sections (4-μm thickness) were stained with hematoxylin-eosin and examined by light microscopy. Samples were visualized using a Leica DMLS microscope (Bannockburn, IL) with a 20× objective (∞/0.17/B), and images were captured using a QImaging camera (Retiga 1300R) and Qcapture Pro 60 imaging software (QImaging, Surrey, BC). Images were imported into and processed using Photoshop 4.6 software (Adobe, San Jose, CA).
Statistics
Data are reported as mean plus or minus standard error (SE). Comparisons of interest were made via t test, paired and unpaired, as appropriate.
Results
Transgene copy number, peripheral blood, and marrow
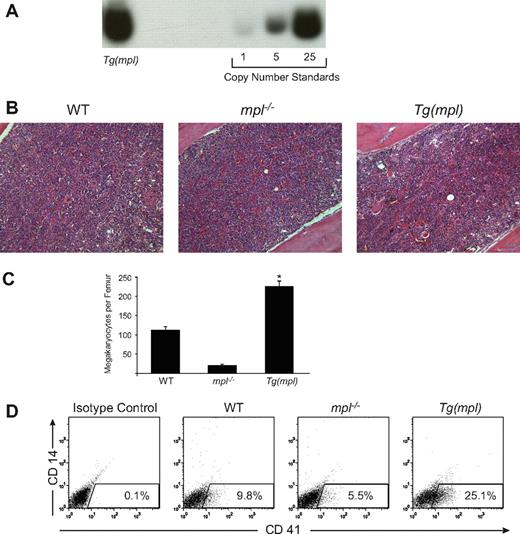
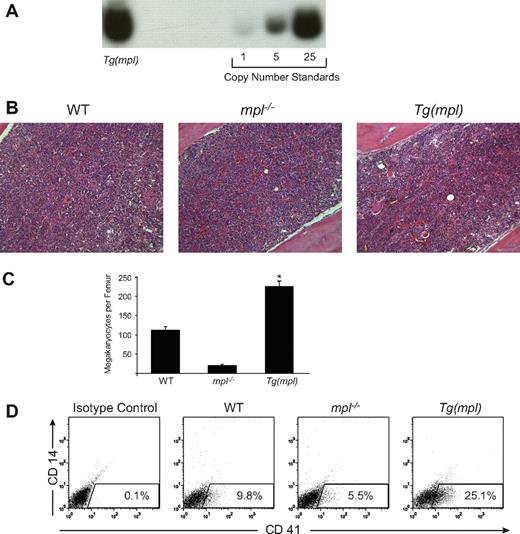
We have maintained a colony of Tg(mpl) mice for more than 7 years. They breed normally, show no gross pathology, and have a normal life expectancy. By Southern blotting they are shown to carry 38 copies of the ectopic Mpl transgene (Figure 1A). WT, mpl−/−, and Tg(mpl) mice have equivalent peripheral blood hemoglobin levels and WBC counts (Table 1). Platelet counts in the mpl−/− mice are 15% of WT levels, a finding that is consistent with other reports.4,26 In contrast, Tg(mpl) mice exhibit thrombocytosis, with platelet counts that are approximately double those of WT mice (Table 1). The relative numbers of morphologically recognizable megakaryocytes in histologic femur sections parallels the peripheral blood platelet counts (Figure 1B,C). Furthermore, quantitation of the percentage of CD41+/CD14− cells in the marrows of all 3 mouse strains (Figure 1D) confirmed an increase in the percentage of megakaryocyte lineage-committed cells in the Tg(mpl) mice. These results demonstrate an increase in marrow megakaryocytopoiesis in the Tg(mpl) mice.
Transgene copy number and increased marrow megakaryocytosis in the Tg(mpl) mouse. (A) Southern blot determination of transgene copy number in DNA isolated from the marrows of Tg(mpl) mice and copy number standards generated by dilution of plasmid containing the mpl transgene into genomic DNA from the marrows of mpl−/− mice. Transgene copy number in Tg(mpl) mice was determined to be 38 based on band intensities quantitated by PhosphorImager. (B) Hematoxylin-eosin–stained sections of femurs from WT (C57BL/6J), mpl−/−, and Tg(mpl) mice were examined by light microscopy (original magnification, × 200). (C) Morphologically recognizable megakaryocytes were counted in whole femur sections from each strain. Numbers represent the mean plus or minus SE of 6 femurs taken from 3 mice in each group. *P ≤ .003, Tg(mpl) versus WT and Tg(mpl) versus mpl−/−. (D) Representative 2-color flow cytometric analysis of indirect immunofluorescence staining of 8- to 10-week-old WT, mpl−/−, and Tg(mpl) mice bone marrow populations stained with anti-CD41–FITC, anti-CD14–PE, and isotype-matched control antibodies. The percentage of cells staining CD41+/CD14− is shown in the bottom right of each histogram and is representative of 3 independent experiments (4 mice from each strain were pooled in each experiment).
Transgene copy number and increased marrow megakaryocytosis in the Tg(mpl) mouse. (A) Southern blot determination of transgene copy number in DNA isolated from the marrows of Tg(mpl) mice and copy number standards generated by dilution of plasmid containing the mpl transgene into genomic DNA from the marrows of mpl−/− mice. Transgene copy number in Tg(mpl) mice was determined to be 38 based on band intensities quantitated by PhosphorImager. (B) Hematoxylin-eosin–stained sections of femurs from WT (C57BL/6J), mpl−/−, and Tg(mpl) mice were examined by light microscopy (original magnification, × 200). (C) Morphologically recognizable megakaryocytes were counted in whole femur sections from each strain. Numbers represent the mean plus or minus SE of 6 femurs taken from 3 mice in each group. *P ≤ .003, Tg(mpl) versus WT and Tg(mpl) versus mpl−/−. (D) Representative 2-color flow cytometric analysis of indirect immunofluorescence staining of 8- to 10-week-old WT, mpl−/−, and Tg(mpl) mice bone marrow populations stained with anti-CD41–FITC, anti-CD14–PE, and isotype-matched control antibodies. The percentage of cells staining CD41+/CD14− is shown in the bottom right of each histogram and is representative of 3 independent experiments (4 mice from each strain were pooled in each experiment).
Hematopoietic progenitors and repopulating cells
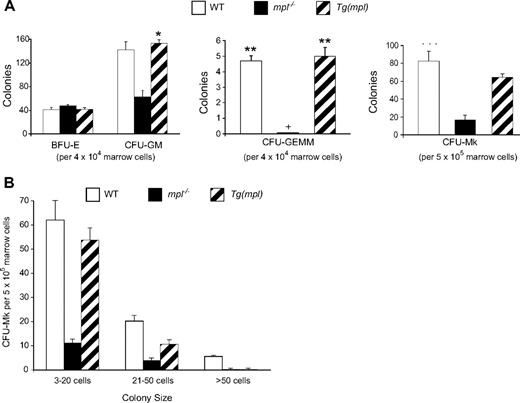
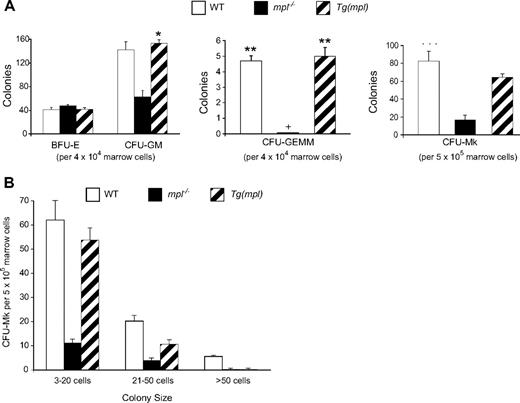
As expected, an examination of bone marrow progenitors revealed a more generalized defect in hematopoiesis in the mpl−/− mice.4,26 Compared with WT mice, they have reduced numbers of marrow CFU-GM, CFU-GEMM, and CFU-Mk progenitors (Figure 2A). Though all progenitor numbers are restored to normal in the Tg(mpl) mice (Figure 2A), they still show evidence of a megakaryocyte maturation defect. Compared with WT mice, the marrows of Tg(mpl) mice contain significantly fewer large (> 20 cells) CFU-Mks (Figure 2B; P < .005) and Tg(mpl) megakaryocyte progenitors grown in liquid culture showed a degree of maturation arrest, with almost no cells reaching a DNA content of 32N or greater (Figure S1, available on the Blood website; see the Supplemental Materials link at the top of the online article).
Comparison of hematopoietic progenitors in the marrows of WT, mpl−/−, and Tg(mpl) mice. (A) BFU-E, CFU-GM, CFU-GEMM, and CFU-Mk progenitors were grown in methylcellulose and collagen–based media and enumerated; + indicates no CFU-GEMM colonies grew from mpl−/− marrow; n = 3 mice from each strain. *P = .006 versus mpl−/−; **P ≤ .013 for WT versus mpl−/− and for Tg(mpl) versus mpl−/−; ***P ≤ .014 for WT versus mpl−/− and for Tg(mpl) versus mpl−/−. (B) Size of CFU-Mk colonies. The CFU-Mk colonies (total counts shown in panel A) were further characterized by size. There were significantly fewer large (> 20-cell) colonies in Tg(mpl) than WT marrow (P < .005). Means plus or minus SE are shown.
Comparison of hematopoietic progenitors in the marrows of WT, mpl−/−, and Tg(mpl) mice. (A) BFU-E, CFU-GM, CFU-GEMM, and CFU-Mk progenitors were grown in methylcellulose and collagen–based media and enumerated; + indicates no CFU-GEMM colonies grew from mpl−/− marrow; n = 3 mice from each strain. *P = .006 versus mpl−/−; **P ≤ .013 for WT versus mpl−/− and for Tg(mpl) versus mpl−/−; ***P ≤ .014 for WT versus mpl−/− and for Tg(mpl) versus mpl−/−. (B) Size of CFU-Mk colonies. The CFU-Mk colonies (total counts shown in panel A) were further characterized by size. There were significantly fewer large (> 20-cell) colonies in Tg(mpl) than WT marrow (P < .005). Means plus or minus SE are shown.
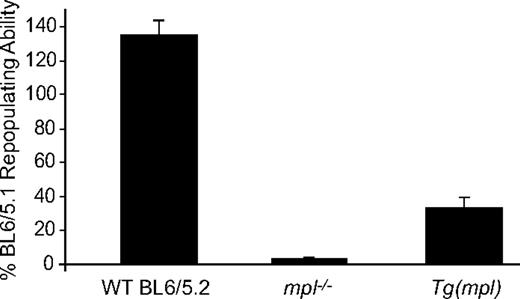
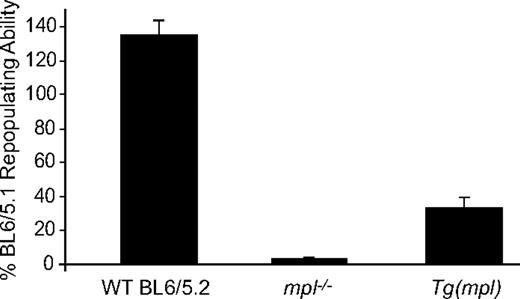
To see whether transgene rescue had also reconstituted hematopoietic stem cell–repopulating ability we performed competitive repopulation assays transplanting WT C57BL/6, mpl−/−, or Tg(mpl) marrow cells (all Ly5.2) mixed with an equal number of WT Ly5.1 competitor marrow cells into lethally irradiated WT Ly5.1 recipients. Irradiated WT Ly5.1 mice that received transplants of only WT Ly5.2 or Tg(mpl) marrow demonstrated endogenous reconstitution of less than 10%, indicating that nearly all contributing stem cells came from donor marrow (data not shown). As expected, the repopulating ability of the mpl−/− marrow was severely impaired at only 3.6% plus or minus 0.8% of WT marrow (Figure 3).5-8 In comparison, the Tg(mpl) mice demonstrated a nearly 10-fold increase in marrow-repopulating activity, though the recovery was still not complete, reaching 33.5% plus or minus 5.6% of the WT Ly5.1 level. Thus, the transgenic vector used to restore mpl expression in the mpl−/− mouse generates overcorrection of the platelet count but incomplete recovery of stem cell–repopulating activity.
Hematopoietic stem cell repopulating ability of WT, mpl−/−, and Tg(mpl) marrow. WT (Ly5.2), mpl−/−, and Tg(mpl) marrow competed 1:1 with WT (Ly5.1) marrow cells in lethally irradiated WT (Ly5.1) recipients. The repopulating activity was determined at 16 weeks after transplantation from the percentage of peripheral blood leukocytes in reconstituted chimeras staining for each of the CD45 alloantigens, CD45.1 and CD45.2. Repopulating activity is normalized to the WT (Ly5.1) control marrow; n = 8 to 9 mice for each strain. Means plus or minus SE are shown.
Hematopoietic stem cell repopulating ability of WT, mpl−/−, and Tg(mpl) marrow. WT (Ly5.2), mpl−/−, and Tg(mpl) marrow competed 1:1 with WT (Ly5.1) marrow cells in lethally irradiated WT (Ly5.1) recipients. The repopulating activity was determined at 16 weeks after transplantation from the percentage of peripheral blood leukocytes in reconstituted chimeras staining for each of the CD45 alloantigens, CD45.1 and CD45.2. Repopulating activity is normalized to the WT (Ly5.1) control marrow; n = 8 to 9 mice for each strain. Means plus or minus SE are shown.
Impaired TPO homeostasis drives the increased megakaryocytopoiesis
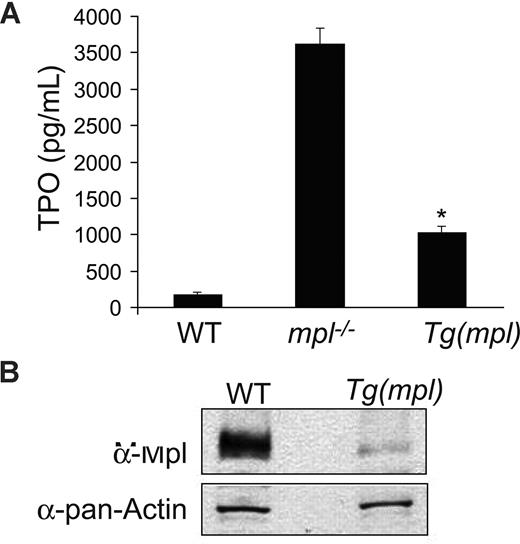
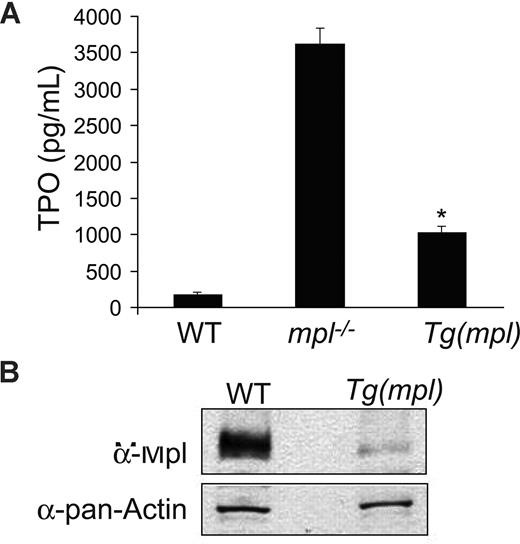
As expected, plasma TPO levels in mpl−/− mice were found to be significantly elevated. Plasma Tpo levels were also elevated in Tg(mpl) mice (Figure 4A), in spite of their high platelet counts. However, by Western blotting, the Tg(mpl) mice also showed a 9-fold lower level of Mpl protein expression in their platelets (Figure 4B). The reduced expression of Mpl in platelets accounts for the high plasma TPO levels seen in the Tg(mpl) mice. Even in the setting of marked thrombocytosis the total number of Mpl receptors available to bind TPO was diminished. However, high plasma TPO levels and low expression of Mpl do not exclude the possibility that megakaryocytopoiesis in Tg(mpl) marrow is less dependent on TPO stimulation than in WT marrow.
Plasma TPO levels and platelet Mpl expression. (A) TPO levels determined by ELISA on peripheral blood plasma from WT, mpl−/−, and Tg(mpl) mice; n = 3 to 4 mice for each strain. *P ≤ .003, Tg(mpl) versus WT and Tg(mpl) versus mpl−/−. Means plus or minus SE are shown. (B) Expression of Mpl on platelet lysates analyzed by Western blot probed with Mpl antiserum (top panel). The blot was stripped and reprobed with anti–pan-actin antibody to ensure equal amount of protein in each lane (bottom panel). Levels of Mpl in Tg(mpl) platelets are 9-fold lower than that in WT.
Plasma TPO levels and platelet Mpl expression. (A) TPO levels determined by ELISA on peripheral blood plasma from WT, mpl−/−, and Tg(mpl) mice; n = 3 to 4 mice for each strain. *P ≤ .003, Tg(mpl) versus WT and Tg(mpl) versus mpl−/−. Means plus or minus SE are shown. (B) Expression of Mpl on platelet lysates analyzed by Western blot probed with Mpl antiserum (top panel). The blot was stripped and reprobed with anti–pan-actin antibody to ensure equal amount of protein in each lane (bottom panel). Levels of Mpl in Tg(mpl) platelets are 9-fold lower than that in WT.
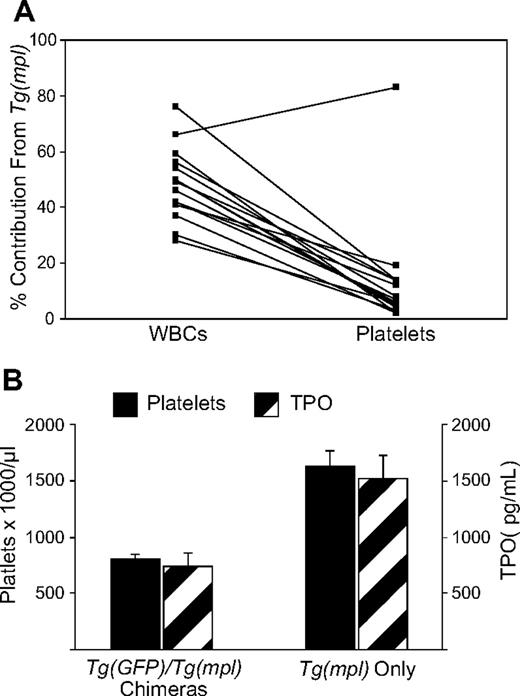
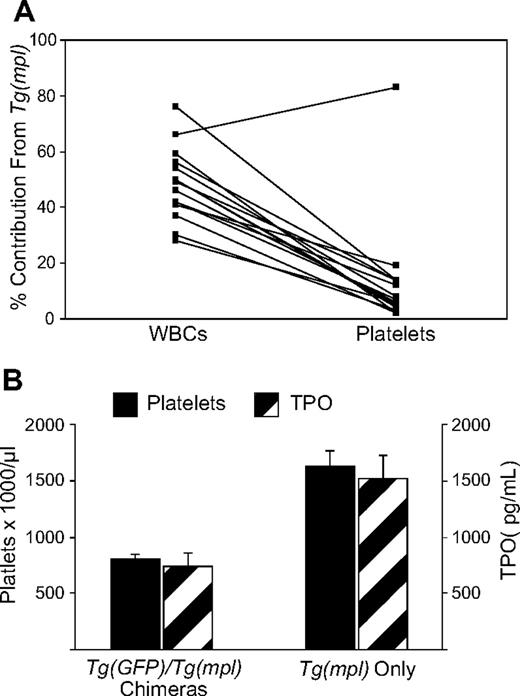
To compare the relative megakaryocytopoietic response of WT and Tg(mpl) marrow to an equivalent TPO stimulus, we tracked the stem cell sources of both peripheral blood platelets and leukocytes in chimeric mice. For these experiments, we used Tg(GFP) mice as WT donors because they exhibit normal hematopoiesis and express GFP in all lineages, including platelets.33 A determination of the relative donor contribution to megakaryocytopoiesis was not possible in the prior competitive repopulation assays because CD45 is not expressed on platelets. We used a 3:1 ratio of Tg(mpl)/Tg(GFP) marrow cells because of the lower repopulating activity shown in Tg(mpl) marrow. At 4 months after transplantation, peripheral blood was analyzed and 15 of the 19 mice that received transplants were chimeras, with each donor graft contributing 2% or more of peripheral blood leukocytes. In chimeras, the mean contribution of leukocytes coming from Tg(mpl) marrow was 48.4% plus or minus 3.2%; for platelets, it was 13.3% plus or minus 5.0%. Furthermore, in the peripheral blood, of 14 of the 15 chimeras there was a higher percentage contribution of Tg(mpl) cells in circulating leukocytes than in platelets (Figures 5A, S2; P < .001). Because of the low number of marrow cells transplanted from the Tg(GFP) donors, 4 of the 19 recipient mice did not end up as stable chimeras and instead were repopulated with only Tg(mpl) marrow. We compared the platelet counts and TPO levels in the 15 chimeras to the 4 mice repopulated by only Tg(mpl) stem cells. The chimeric mice had normal platelet counts and lower TPO levels than the mice engrafted with only Tg(mpl) marrow cells (Figure 5B). These results demonstrate that megakaryocytopoiesis from Tg(mpl) marrow is not only TPO dependent, but actually requires a greater stimulus for platelet production than WT marrow. Therefore, the thrombocytosis found in Tg(mpl) mice is solely due to an increased stimulus to megakaryocytopoiesis from high plasma TPO levels. Furthermore, the imbalance in TPO homeostasis in Tg(mpl) mice can be reversed by the engraftment of a small number of WT stem cells that generate megakaryocytes and platelets with normal expression of Mpl.
WBC and platelet reconstitution in chimeric mice. (A) Irradiated Tg(mpl) recipients were reconstituted with a 1:3 ratio of marrow cells from Tg(GFP) and Tg(mpl) donors. At 16 weeks after transplantation, the contribution of peripheral blood leukocytes and platelets coming from each of the engrafted donor marrow stem cells in chimeric mice was determined by flow cytometry; n = 15 mice. (B) A comparison of platelet counts and TPO levels in mice that received transplants that resulted in bone marrow chimeras (n = 15) and from mice that were reconstituted with only Tg(mpl) stem cells (n = 4). Means plus or minus SE are shown.
WBC and platelet reconstitution in chimeric mice. (A) Irradiated Tg(mpl) recipients were reconstituted with a 1:3 ratio of marrow cells from Tg(GFP) and Tg(mpl) donors. At 16 weeks after transplantation, the contribution of peripheral blood leukocytes and platelets coming from each of the engrafted donor marrow stem cells in chimeric mice was determined by flow cytometry; n = 15 mice. (B) A comparison of platelet counts and TPO levels in mice that received transplants that resulted in bone marrow chimeras (n = 15) and from mice that were reconstituted with only Tg(mpl) stem cells (n = 4). Means plus or minus SE are shown.
TPO-mediated signaling in megakaryocytes
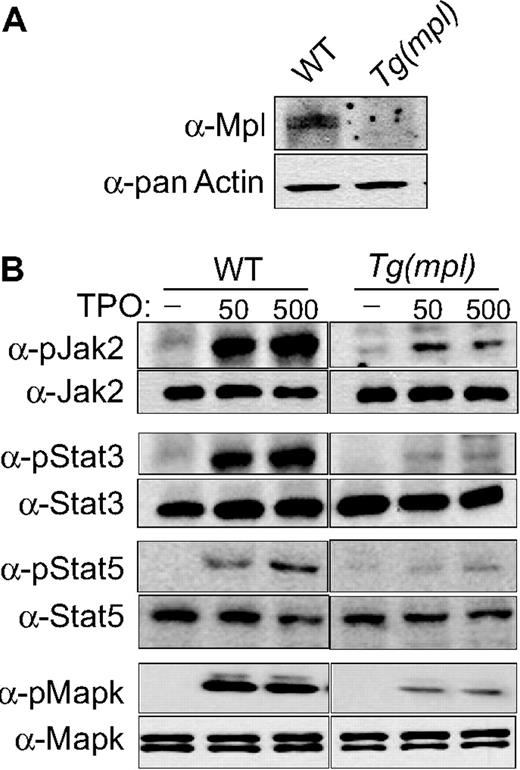
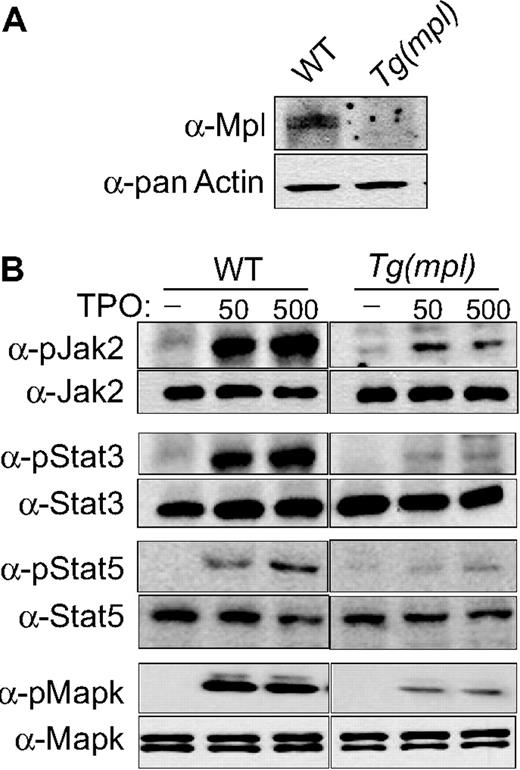
We examined the phosphorylation of Jak2, Stat3, Stat5, and MAPK in megakaryocyte progenitors grown in liquid culture. The Tg(mpl) megakaryocytes stimulated by TPO showed significantly less tyrosine phosphorylation of all 4 signaling proteins when compared with WT cells (Figure 6B). Phosphorylation of Jak2 was more robust in WT cells, with a 7.2- and 8.1-fold increase over Jak2 phosphorylation in Tg(mpl) cells in response to TPO stimulation at 50 and 500 ng/mL, respectively (Figure 6B). Similarly, phosphorylation of Stat3 and Stat5 was more pronounced in WT cells, with 6.8-fold (50 ng/mL) to 7.5-fold (500 ng/mL) greater Stat3 phosphorylation and 5.1-fold (50 ng/mL) to 6.3-fold (500 ng/mL) fold greater Stat5 phosphorylation than in Tg(mpl) cells. Phosphorylation of MAPK was 4.1-fold (50 ng/mL) to 4.3-fold (500 ng/mL) greater in WT megakaryocytes (Figure 6B). In contrast, the total protein levels of Jak2, Stat3/5, and MAPK were similar in megakaryocytes from both WT and Tg(mpl) mice. However, as in our earlier studies with platelets, Mpl expression was markedly reduced in the Tg(mpl) megakaryocytes (Figures 4B,6A). The reduced expression of Mpl in the Tg(mpl) mouse correlated with the observed lower levels of TPO-induced kinase phosphorylation in megakaryocytes and explains the lower contribution of platelet production from Tg(mpl) megakaryocytes in the Tg(mpl)/Tg(GFP) chimeras (Figure 5A,B).
TPO-induced signaling in WT and Tg(mpl) megakaryocytes. Bone marrow cells were harvested from mice and grown in serum-free medium with 37.5 ng/mL mTPO for 3 days; megakaryocytes were then purified using an albumin density-gradient column achieving a final enrichment of greater than 90%. (A) Western blots using Mpl antiserum demonstrates the relative Mpl expression in both WT and Tg(mpl) megakaryocytes. (B) Isolated megakaryocytes were incubated in a serum-free, cytokine-free medium for 10 hours and then stimulated with 50 ng/mL or 500 ng/mL mTpo for 12 minutes. Total cell lysates, normalized for protein concentration, were separated by 4% to 20% SDS-PAGE and immunoblotted with the indicated phosphospecific antibodies (Jak2, Stat3, Stat5, and MAPK; “Methods”). Blots were then stripped and reprobed with appropriate antibodies to ensure equal amounts of protein in each lane (bottom panels). Relative phosphorylation levels were quantitated by densitometry. Results are representative of 2 independent experiments.
TPO-induced signaling in WT and Tg(mpl) megakaryocytes. Bone marrow cells were harvested from mice and grown in serum-free medium with 37.5 ng/mL mTPO for 3 days; megakaryocytes were then purified using an albumin density-gradient column achieving a final enrichment of greater than 90%. (A) Western blots using Mpl antiserum demonstrates the relative Mpl expression in both WT and Tg(mpl) megakaryocytes. (B) Isolated megakaryocytes were incubated in a serum-free, cytokine-free medium for 10 hours and then stimulated with 50 ng/mL or 500 ng/mL mTpo for 12 minutes. Total cell lysates, normalized for protein concentration, were separated by 4% to 20% SDS-PAGE and immunoblotted with the indicated phosphospecific antibodies (Jak2, Stat3, Stat5, and MAPK; “Methods”). Blots were then stripped and reprobed with appropriate antibodies to ensure equal amounts of protein in each lane (bottom panels). Relative phosphorylation levels were quantitated by densitometry. Results are representative of 2 independent experiments.
Mpl message levels in megakaryocytes and undifferentiated progenitors
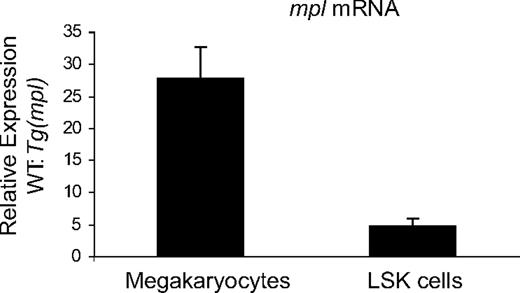
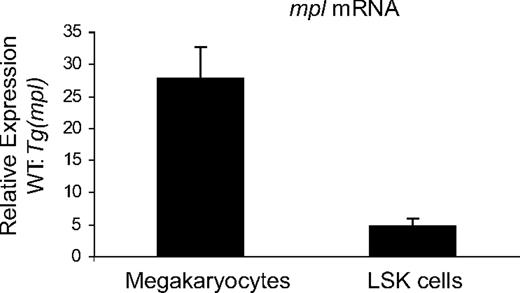
We performed qPCR to determine relative expression levels of Mpl mRNA in WT and Tg(mpl) liquid culture–generated megakaryocytes and LSK cells. LSK cells are a population of primitive marrow progenitors highly enriched for HSCs.34-36 Relative mpl message levels were significantly higher in both megakaryocytes and LSK cells from WT mice (Figure 7). However, the difference in mpl mRNA levels between WT and Tg(mpl) mice was more pronounced in megakaryocytes (27.8 ± 4.7-fold change) than in LSK cells (4.7 ± 1.1-fold change). Furthermore, the markedly reduced level of mpl message in Tg(mpl) megakaryocytes paralleled the Western blot results on megakaryocytes and platelets (Figures 4B,6A), indicating that the message coming from the ectopic transgene is efficiently translated. Moreover, the discrepancy in relative mpl mRNA expression patterns in Tg(mpl) megakaryocytes and LSK cells is consistent with the functional results that showed a greater contribution to the leukocyte than platelet compartment by Tg(mpl)–repopulating cells in chimeric mice (Figure 5A).
Expression levels of mpl in megakaryocytes and LSK cells. Expression levels of mpl mRNA, normalized to Gapdh levels, was determined in megakaryocytes and LSK cells from WT and Tg(mpl) mice. Results shown were compiled from 3 separate experiments using pooled samples from 3 mice in each strain per experiment. Means plus or minus SE are shown.
Expression levels of mpl in megakaryocytes and LSK cells. Expression levels of mpl mRNA, normalized to Gapdh levels, was determined in megakaryocytes and LSK cells from WT and Tg(mpl) mice. Results shown were compiled from 3 separate experiments using pooled samples from 3 mice in each strain per experiment. Means plus or minus SE are shown.
Discussion
TPO-induced proliferation and survival effects are limited to cells that express Mpl: immature multipotent progenitors and cells in the megakaryocyte lineage.7,37,38 Furthermore, plasma TPO levels are inversely proportional to the total number of Mpl receptors available for binding. Because most of Mpl is expressed on platelets and megakaryocytes, plasma TPO levels fluctuate in response to the physiologic demand for megakaryocytopoiesis.13-15,19 Studies that induced dyshematopoiesis from forced overexpression of Mpl in WT mice demonstrate that TPO effects are tightly regulated by the location and level of Mpl expression.21,24
At the present time, stem cell transplantation is the only modality available to cure CAMT, which is an otherwise lethal disease. However, not all patients with CAMT will have access to an HLA-compatible donor and, even in cases of closely matched transplants, there remains the risk for graft rejection, regimen-related toxicities, and acute and chronic graft-versus-host disease. HSC gene therapy offers a potential cure for CAMT but only if vector gene addition restores normal Mpl expression patterns. The 2-kb noncoding region just upstream from the Mpl start site has shown promoter activity with the ability to direct appropriate lineage-restricted transgene expression.25 Here, we have demonstrated that ectopic expression of an mpl transgene by this same promoter can correct platelet, progenitor, and stem cell defects found in the mpl−/− mouse without also inappropriately expanding erythroid or myeloid lineage-committed cells. However, in the Tg(mpl) mice there was a disparity in the degree of correction. The platelet counts were overcorrected, a finding also reported by another group that used an Mpl transgenic expression vector with the same 2-kb promoter to rescue the mpl−/− mouse.39 In contrast, the stem cell–repopulating ability of the marrow compartment in the Tg(mpl) mice was restored to only about 25% to 35% of the level found in congenic WT controls.
There are 2 possible causes for the thrombocytosis seen in the transgene-rescued mice: (1) an inherent defect in function of the transgenic Mpl receptor leading to excessive megakaryocyte lineage proliferation or (2) dysregulation of TPO homeostasis. Excessive signal transduction from the transgenic Mpl receptor would raise concerns about an increased risk for the development of a myeloproliferative disorder. It was recently demonstrated that expression of a constitutively active mutant Mpl in mice produces a myeloproliferative disorder with myelofibrosis.23 In our study, the Mpl transgene expressed the WT protein and therefore should not be subject to activation without stimulation by TPO. Furthermore, we looked at some of the common downstream targets of TPO-induced phosphorylation to determine the activity of the Mpl receptor in Tg(mpl) megakaryocytes and discovered a marked reduction in signaling that paralleled the decreased Mpl protein expression.
Paradoxically, the cause for thrombocytosis in the Tg(mpl) mouse is low expression of Mpl on platelets and megakaryocytes. Disruption of the normal receptor/ligand interaction that dynamically regulates megakaryocytopoiesis results in higher plasma TPO levels and excessive platelet production. Using circulating leukocytes as a measure for repopulating cell engraftment in chimeric mice (Figure 5A), we determined that under an equivalent TPO stimulus, the relative degree of megakaryocytopoiesis derived from Tg(mpl) marrow was actually much less than from WT marrow. Furthermore, in vitro studies demonstrated both maturation and signaling defects in Tg(mpl) megakaryocytes, even with stimulation by saturating levels of TPO (Figures 2B, 6, and S1). Therefore, the thrombocytosis seen in the Tg(mpl) mice is most likely the result of persistent unchecked signaling in the megakaryocyte compartment rather than the restoration of normal megakaryocyte physiology that has been adjusted to a higher TPO set point.
Reduced Mpl expression in HSCs of the Tg(mpl) mouse probably accounts for the failure of the transgene to fully restore hematopoietic-repopulating ability. In fact, our studies found that the relative restoration of mpl mRNA levels in the Tg(mpl) LSK cells closely matched the degree to which stem cell–repopulating ability was corrected. Because the mpl−/− mouse does not show progression to bone marrow failure, it is hard to predict from this model how much restoration of stem cell function would be needed to durably correct the hematopoietic defects in patients with CAMT. The difference in the hematopoietic phenotype of human and mouse Mpl deficiency could be due to the relative excess in stem cell residual capacity in mice,40 or because other cytokine pathways are more able to compensate for the loss of Mpl signaling in the mouse system. However, it was recently demonstrated that Tpo−/− mice undergo progressive loss of both phenotypically defined HSCs and functionally determined marrow-repopulating cells as they age.41 We would expect the same to be true for mpl−/− mice. Our competitive repopulation studies were performed at 4 months after transplantation. It would be interesting to serially follow chimeric mice for up at least 1 year after transplantation to see if the contribution of the graft from Tg(mpl) HSCs remains stable over time.
Though we did not observe thrombotic or hemorrhagic complications in the Tg(mpl) mice, it is unclear whether this mechanism for thrombocytosis could predispose to these pathologic outcomes. In general, nonclonal causes of thrombocytosis are asymptomatic.42 However, there have been 2 reports of autosomal dominant familial essential thrombocythemia caused by high serum TPO levels resulting from mutations in the 5′ untranslated region of the TPO gene that produced alterations in posttranscriptional mRNA processing.43,44 In one of these families, an increased incidence of both thrombotic and hemorrhagic complications was described.44,45
Nonclonal thrombocytosis in the setting of reduced Mpl expression has been described in a couple of clinical settings. Mpl Baltimore is a single-nucleotide polymorphism that results in a defect in posttranslational receptor processing.46 Patients homozygous for this polymorphism exhibit marked thrombocytosis and decreased Mpl protein levels on their platelets. In their description of Mpl Baltimore, Moliterno et al speculated that the thrombocytosis was caused either by an hyperfunctional Mpl receptor or by a mechanism independent of TPO/Mpl signaling. However, plasma TPO levels and an evaluation of Mpl signal transduction pathways in megakaryocytes were not reported in their study. We hypothesize that the decrease in platelet and megakaryocyte expression of Mpl in individuals with Mpl Baltimore leads to high plasma TPO levels that drives excessive megakaryocytopoiesis, like in the Tg(mpl) mice. At birth, preterm infants exhibit both elevated serum TPO levels and reduced expression of platelet Mpl mRNA. Over the first month of life, these infants develop a relative thrombocytosis which then resolves at ages 2 to 6 months in association with a decrease in serum TPO levels and an increase in platelet MPL mRNA expression.47 Reduced expression of Mpl disrupts TPO homeostasis and can induce states of thrombocytosis if enough residual receptor function remains to respond to the resultant high TPO levels. States of low Mpl expression may be an unrecognized mechanism for explaining thrombocytosis in patients with idiopathic nonclonal thrombocytosis.
We found a discrepancy in the degree of restoration of mpl mRNA expression in LSK cells and megakaryocytes in the Tg(mpl) mouse, a result that suggested the 2-kb promoter had greater relative activity in HSCs than megakaryocytes. However, one limitation of our study is that we only examined expression levels in mature megakaryocyte progenitors that had been kept in culture for 72 hours. Tiedt et al recently found that mpl mRNA expression directed by the same 2-kb promoter decreased over the course of megakaryocyte maturation.39 Thus, the apparent differences in the restoration of mpl mRNA expression between the 2 hematopoietic compartments may have been significantly influenced by the maturation state of the megakaryocyte progenitors we studied.
To fully correct both the stem cell and platelet compartments of the mpl−/− mice, transgenes that can accurately restore normal Mpl expression patterns are needed. It is likely that some regulatory elements important for the control of native mpl expression were not included in the 2-kb promoter used in the Tg(mpl) mouse. As shown in Figure S3, there are regions of significant homology between the human and murine noncoding regions out to 9 kb upstream of the mpl start site. By incorporating more of these homologous sequences into new promoters, we hope to generate vectors that will be capable of restoring physiologic Mpl signaling and TPO regulation in the mpl−/− mouse, with the eventual goal of generating human Mpl expressing retroviral vectors to treat patients with CAMT.
An Inside Blood analysis of this article appears at the front of this issue.
The online version of this article contains a data supplement.
The publication costs of this article were defrayed in part by page charge payment. Therefore, and solely to indicate this fact, this article is hereby marked “advertisement” in accordance with 18 USC section 1734.
Acknowledgments
The authors thank Jonathan Drachman for his help in preparation of this manuscript and Doug Bolgiano for advice regarding statistical analysis of data.
This work was supported by grants from the National Institutes of Health (NIH; P50 HL081015 and K01DK065129), the Leukemia Research Foundation, and the Cuyamaca Foundation.
National Institutes of Health
Authorship
Contribution: B.J.L. designed and performed research, analyzed data, and wrote portions of the manuscript; A.E. performed research; J.R. designed and performed research; J.C. performed research; and N.C.J. designed research, analyzed data, and wrote the manuscript.
Conflict-of-interest disclosure: The authors declare no competing financial interests.
Correspondence: Neil C. Josephson, Puget Sound Blood Center, BRI Rm 3014, 921 Terry Avenue, Seattle, WA 98104-1256; e-mail: njoseph@u.washington.edu.

