Abstract
The acute-phase protein serum amyloid A (SAA) is commonly considered a marker for inflammatory diseases; however, its precise role in inflammation and infection, which often result in neutrophilia, remains ambiguous. In this study, we demonstrate that SAA is a potent endogenous stimulator of granulocyte colony-stimulated factor (G-CSF), a principal cytokine-regulating granulocytosis. This effect of SAA is dependent on Toll-like receptor 2 (TLR2). Our data demonstrate that, in mouse macrophages, both G-CSF mRNA and protein were significantly increased after SAA stimulation. The induction of G-CSF was blocked by an anti-TLR2 antibody and markedly decreased in the TLR2-deficient macrophages. SAA stimulation results in the activation of nuclear factor–κB and binding activity to the CK-1 element of the G-CSF promoter region. In vitro reconstitution experiments also support that TLR2 mediates SAA-induced G-CSF expression. In addition, SAA-induced secretion of G-CSF was sensitive to heat and proteinase K treatment, yet insensitive to polymyxin B treatment, indicating that the induction is a direct effect of SAA. Finally, our in vivo studies confirmed that SAA treatment results in a significant increase in plasma G-CSF and neutrophilia, whereas these responses are ablated in G-CSF– or TLR2-deficient mice.
Introduction
Serum amyloid A (SAA) is one of the major acute-phase proteins. Its plasma concentration can increase 1000-fold, reaching as high as 80 μM or 1 mg/mL during the acute-phase response.1,2 Many studies have shown that SAA plasma levels are also significantly elevated in patients with a broad spectrum of chronic inflammatory diseases, such as atherosclerosis,3,4 rheumatoid arthritis,5 Crohn disease,6 diabetes,7,8 and ankylosing spondylitis.9 However, the precise role of SAA in inflammation remains unclear.
In humans, the acute-phase or inducible SAA is encoded by the SAA1 and SAA2 alleles.1 Bacterial products, such as lipopolysaccharide (LPS-del), and inflammatory cytokines, including interleukin-1β (IL-1β), IL-6, and tumor necrosis factor-α (TNF-α), induce acute-phase SAA expression in hepatocytes as well as in tissue macrophages and synoviocytes.10-13 In circulation, the newly synthesized SAA is incorporated into high-density lipoprotein (HDL).14 Increased SAA can displace apolipoprotein A–I (ApoA-I) and change HDL composition. This change may be associated with a loss of HDL's atheroprotective properties and fundamentally alter the function of HDL.15 At elevated concentrations, SAA may also dissociate from HDL, generating lipoprotein fractions that contain primarily lipid-poor ApoA-I and SAA.16,17 At sites of inflammation, SAA produced by inflammatory macrophages and synoviocytes is in the lipid-poor form.11,12 This form of SAA has numerous proinflammatory actions: it is chemotactic to neutrophils, monocytes, and T lymphocytes, causing leukocyte infiltration and promoting neutrophil adhesion to endothelial cells,18-20 and it stimulates neutrophils and monocytes to release cytokines,21,22 tissue factor,23 and matrix metalloproteinases.24 These findings suggest a key role for SAA in the establishment and maintenance of inflammation.
There are 3 receptors involved in SAA's proinflammatory effects: formyl peptide receptor like–1 (FPRL1/ALX), which was shown to be responsible for SAA-induced chemotaxis, IL-8 secretion, and matrix metalloproteinase–9 production20,22,24 ; receptor for advanced glycation end products, which was reported to mediate SAA-induced tissue factor expression23 ; and CLA-1 (CD36 and LIMPII analogous–1, a human ortholog of rodent scavenger receptor BI), which was found to facilitate SAA-triggered proinflammatory downstream signaling pathways, such as extracellular signal-regulated kinase (ERK) and p38 activation.25 In addition, there are several proteins and molecules to which SAA binds: Tanis, heparin, heparan sulfate, and certain glycoproteins, although whether these interactions lead to transmembrane signaling remains to be tested.26-28 The Toll-like receptors (TLRs) are key players of the innate immune system, functioning as pattern recognition receptors that recognize a wide range of microbial pathogens. In addition to microbial products, there are several endogenous TLR ligands that have been identified.29 For instance, high-mobility group box 1 is a ubiquitous, host-derived protein that interacts with multiple TLRs and plays a role in inflammation.30 The presence of endogenous TLR ligands supports the notion that TLRs play an important role in the detection of danger signals.31,32 The acute-phase proteins, such as SAA, could be danger-signaling molecules31 which, when recognized by the host, may initiate tissue-controlled immune response.32 In this study, we explore the role of TLRs in inflammatory responses to SAA.
Neutrophils are emerging as key players in the pathogenesis of several inflammatory diseases.33 They are an essential component of the acute-phase response and a major contributor to inflammation. Granulocytosis or neutrophilia often results from infection and inflammation and is a feature of several autoimmune diseases, such as rheumatoid arthritis. One of the key regulators for granulocytosis is granulocyte colony-stimulated factor (G-CSF), which plays a central role in the dynamic regulation of neutrophil production and release from the bone marrow.34 Normally, G-CSF serum levels are less than 30 pg/mL in healthy persons but increase up to several nanograms per milliliter during trauma, sepsis, and acute infection.35 The association between neutrophilia and increased serum G-CSF values during the acute-phase response has been well documented. Leukocytes express G-CSF in the presence of appropriate stimuli, including LPS, lipoteichoic acid (LTA), phorbol-12-myristate-13-acetate, and phytohemagglutinin.35 G-CSF secretion also occurs in response to endogenous signals, such as cytokines, including TNF-α, IL-1β, IL-4, and IL-17 and other hematopoietic growth factors, such as IL-3, granulocyte-macrophage colony-stimulating factor, and macrophage-colony stimulating factor.35,36 However, a correlation between G-CSF and acute-phase proteins, such as SAA in health and diseases, has not been reported. The fact that SAA is a chemoattractant for neutrophils20 and stimulates the secretion of IL-8,22 an important chemokine for neutrophils, suggests that SAA produced at the sites of inflammation may be involved in neutrophil infiltration, but whether it plays a role in the systemic increase in neutrophils has never been investigated. Our current study demonstrates that SAA stimulates G-CSF production and induces neutrophilia in mice, suggesting an important role for SAA in the pathogenesis of chronic inflammatory diseases. In addition, we found that TLR2 is critically required for SAA-stimulated G-CSF production and neutrophilia, supporting the notion that TLR2 acts as a receptor for SAA.
Methods
Reagents
Recombinant human SAA was purchased from PeproTech (Rocky Hill, NJ). The endotoxin level is less than 0.1 ng/μg protein. Polymyxin B, W peptide (WKYMVm), and endotoxin-low human serum albumin (HSA) were obtained from Sigma-Aldrich (St Louis, MO). Pertussis toxin (PTX) and LPS from Escherichia coli 0111:B4 were from Calbiochem (San Diego, CA). Pam3CSK4, FSL-1, peptidoglycan (PGN) from E coli, LTA, and zymosan were obtained from InVivoGen (San Diego, CA). The SLP Reagent Set for PGN detection was obtained from Wako Bioproducts (Richmond, VA). The lipoprotein lipase from Pseudomonas sp (L9656) was from Sigma-Aldrich. Double-stranded consensus oligonucleotides for nuclear factor–κB (NF-κB) were purchased from Promega (Madison, WI), and complementary oligonucleotides for the CK-1 site within the mouse G-CSF promoter region (mGcsf3-166: 5′-AGGAACAGAGATTCCCCGATTTCAC-3′) were synthesized and purified by Integrated DNA Technologies (Coralville, IA), and annealed before use. The peptide WRW4 (WRWWWW; > 90% purity) was synthesized and purified by Macromolecular Resources (Fort Collins, CO). Proteinase K was from Invitrogen (Carlsbad, CA). The anti-p65 antibody was obtained from Santa Cruz Biotechnology (Santa Cruz, CA). The functional grade anti-TLR2 (clone T2.5), anti-TLR4 (clone MTS510) antibodies, and their isotype control IgG (mouse IgG1 and rat IgG2a) were from eBioscience (San Diego, CA). All the enzyme-linked immunosorbent assay (ELISA) kits were purchased from Invitrogen. The Limulus Amebocyte Lysate Kit (QCL-1000) was from Cambrex (East Rutherford, NJ). The cDNA constructs for human TLR1, TLR2, and TLR6 were generated by polymerase chain reaction (PCR) and cloned into the pUNO vector (InVivoGen). The G-CSF luciferase reporter construct was generated by cloning a 329-bp fragment of the G-CSF promoter into the pGL3–basic luciferase reporter vector (Promega). The promoter fragment was generated from C57BL/6 mouse genomic DNA using primers anchored at −303 and +26 bases from the TATA box. All constructs were verified by DNA sequencing.
Knockout mice
All knockout mice were obtained from The Jackson Laboratory (Bar Harbor, ME) and include the G-CSF–knockout mice (Csf3−/+; stock number 002398), the TLR2-knockout mice (Tlr2−/−; B6.129-Tlr2tm1Kir/J, stock number 004650), and the TLR4-deficient mice (Tlr4lps-del; stock number 003752). C57BL/6 mice, also purchased from The Jackson Laboratory, were used as wild-type (WT) controls. Age- and sex-matched littermates were used in the experiments. The procedures involving mice were carried out using protocols approved by the Animal Care Committee at the University of Illinois at Chicago.
Cell preparation and culture
Human peripheral blood monocytes (PBMCs) were prepared from fresh, heparinized venous blood by Ficoll-Hypaque density-gradient centrifugation. Blood drawing followed a protocol approved by the Institutional Review Board at University of Illinois, and informed consent was obtained in accordance with the Declaration of Helsinki. Purified monocytes (> 93% CD14+ by flow cytometry) were kept in nonadherent condition in RPMI 1640 containing 0.5% fetal bovine serum (FBS) and maintained at 37°C. Mouse macrophages were differentiated from bone marrow cells. Mouse bone marrow cells were aspirated from the femurs of 8- to 12-week-old mice and cultured at 37°C in 5% CO2 in RPMI 1640 medium containing 10% FBS, 15% L-cell conditional medium, 10 mM N-2-hydroxyethylpiperazine-N′-2-ethanesulfonic acid, 2 mM l-glutamine, 100 IU/mL penicillin, and 50 μg/mL streptomycin. The medium was changed every 3 days. Pure macrophages (∼ 98% of them were F4/80+ by flow cytometry) were obtained after 7 days of culture. Mouse macrophage cell line RAW264.7 cells were maintained in Dulbecco modified Eagle medium supplemented with 10% FBS, 10 mM N-2-hydroxyethylpiperazine-N′-2-ethanesulfonic acid, 2 mM l-glutamine, 100 IU/mL penicillin, and 50 μg/mL streptomycin. HeLa/TLR2 cells were generated by transfection of HeLa cells with the expression construct pUNO-hTLR2 (InVivoGen). Stable transfectants were selected with blasticidin at 20 μg/mL for 2 weeks. Mock-transfected HeLa cells were generated with the empty vector.
Measurement of G-CSF expression
G-CSF from human and mouse cells and in the plasma was measured with ELISA (Invitrogen). To measure mouse G-CSF transcripts, bone marrow–derived macrophages (BMDMs; 106 cells/mL, 5 mL/sample) were stimulated with 1 μM SAA, and total RNA was isolated and reverse transcribed. PCR amplification of G-CSF transcripts resulted in a 634-bp fragment. The β-actin gene (a 469-bp fragment) was used as a control. Real-time quantitative PCR was performed as described previously.37 Relative level of mRNA for G-CSF was determined by normalizing with the β-actin mRNA level.
Electrophoresis mobility shift assay
Chromatin immunoprecipitation assay
Reagents were obtained from Upstate Biotechnology (Charlottesville, VA), and chromatin immunoprecipitation assay was performed as per the manufacturer's specifications with minor modifications. Briefly, a total of 107 RAW264.7 cells were harvested and resuspended in a serum-free Dulbecco modified Eagle medium medium in the absence or presence of 1 μM SAA or 50 ng/mL TNF-α and incubated for 30 or 60 minutes at 37°C. After stimulation, cells were cross-linked and then washed and resuspended in sodium dodecyl sulfate–lysis buffer, and were sonicated (4 times for 10 seconds each, setting at “4” scale on the Fisher Sonic 60 dismembrenator). After centrifugation at 4°C for 10 minutes, supernatants were diluted 1:10 with dilution buffer and were precleared with salmon-sperm DNA-saturated Protein A beads for 30 minutes. Immunoprecipitation was performed by adding 3 μg polyclonal p65-specific antibody to the cell lysate overnight at 4°C. Specificity of interaction was verified via peptide competition for the antibody using a commercially available blocking peptide (72 μg) obtained from Santa Cruz Biotechnology. Immune complexes were precipitated by the addition of 50 μL salmon-sperm DNA–saturated protein A and were washed with low-salt buffer, high-salt buffer, LiCl buffer, and Tris–ethylenediaminetetra-acetic acid. The complex was extracted with elution buffer, and the formaldehyde cross-linking was reversed by heat. The samples were then treated with proteinase K and purified using a PCR purification kit (QIAGEN, Valencia, CA). Input control DNA was prepared as well. PCR was then performed on the purified DNA. The primers used cover the region of murine Csf3 promoter from −346 to +26, which contains the CK-1 element. The PCR products were analyzed on a 2.5% agarose gel.
SAA-induced neutrophilia
SAA was injected subcutaneously into both G-CSF–deficient (Csf3−/−) (n = 5) and Csf3+/+ (n = 5), age- and sex-matched littermates (8-9 weeks, male), at doses of 120 μg/kg per day in 200 μL phosphate-buffered saline. SAA was administered daily for 7 consecutive days (168 hours). Blood samples were collected before and at 48, 120, and 168 hours after the initial SAA injection. Age- and sex-matched mice of both Tlr2−/− (n = 7) and C57BL/6 (n = 7) were also examined with this protocol. Blood was collected by eye puncture using heparinized capillaries and placed into ethylenediaminetetraacetic acid-treated tubes. Total white blood cell (WBC) count and WBC differential count were determined using a Hemavet 950FS multispecies hematology analyzer (Drew Scientific, Dallas, TX).
Calcium mobilization assay
Calcium mobilization was detected with Fluo-3/AM–labeled mouse neutrophils, according to a previously described procedure.39 Intracellular Ca2+ level was measured in a spectrofluorometer (Photon Technology International, Lawrenceville, NJ) with excitation wavelength at 488 nm and emission wavelength at 525 nm.
Luciferase report assay
HeLa/TLR2 and HeLa/vector cells were transfected with G-CSF luciferase reporter construct, pCMVβ vector DNA (Promega), and/or other expression constructs as indicated, using LipofectAmine Plus reagent (Invitrogen). Twenty-four hours after transfection, cells were serum-starved for 16 to 18 hours and assayed with or without agonist stimulation for 5 hours. All luciferase assays were performed with duplicate or triplicate samples, in 2 to 4 independent experiments. Data were normalized against β-galactosidase activity.
Statistical analysis
Data analysis was carried out using the paired Student t test, with P values less than .05 considered statistically significant. The Prism software (version 4.0; GraphPad Software, San Diego, CA) was used.
Results
SAA induces G-CSF expression in monocytes and macrophages
To determine whether SAA plays a role in neutrophilia, we investigated the ability of SAA to stimulate G-CSF expression. Human PBMCs were incubated with SAA, and the concentration of secreted G-CSF in the culture medium was determined at various time points after stimulation. The concentration of SAA used (1 μM) was well within its physiologic range (0.08-80 μM). As shown in Figure 1A, SAA induced a robust production of G-CSF in PBMCs. By 24 hours, the secreted G-CSF reached 7340 pg/mL per 106 cells. Because subsequent studies used mice for measurement of G-CSF secretion and neutrophilia, we determined SAA-induced G-CSF expression in mouse BMDMs (98% F4/80+ and CD14+). Figure 1B shows that BMDMs responded to SAA with a significant increase in mouse G-CSF secretion that reached 155 pg/mL per 106 cells after 8 hours and 965 pg/mL per 106 cells after 24 hours. The basal level of G-CSF remained stable at approximately 42 pg/mL per 106 cells over the course of cell incubation. Similarly, SAA stimulation of the mouse macrophage cell line RAW264.7 resulted in a time-dependent induction of G-CSF secretion (Figure 1C).
SAA induces G-CSF secretion in monocytes and macrophages. Freshly prepared human PBMCs (A), mouse BMDMs (B), and mouse RAW264.7 cells (C) were stimulated with SAA (1 μM) or buffer (NS), and the secreted G-CSF was determined with ELISA at the indicated time points. Data shown are mean plus or minus SEM from 3 experiments.
SAA induces G-CSF secretion in monocytes and macrophages. Freshly prepared human PBMCs (A), mouse BMDMs (B), and mouse RAW264.7 cells (C) were stimulated with SAA (1 μM) or buffer (NS), and the secreted G-CSF was determined with ELISA at the indicated time points. Data shown are mean plus or minus SEM from 3 experiments.
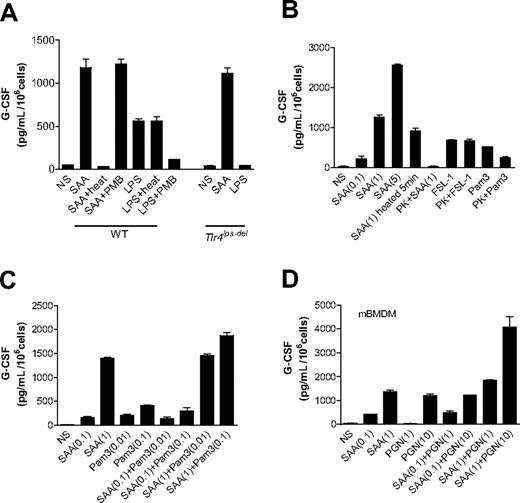
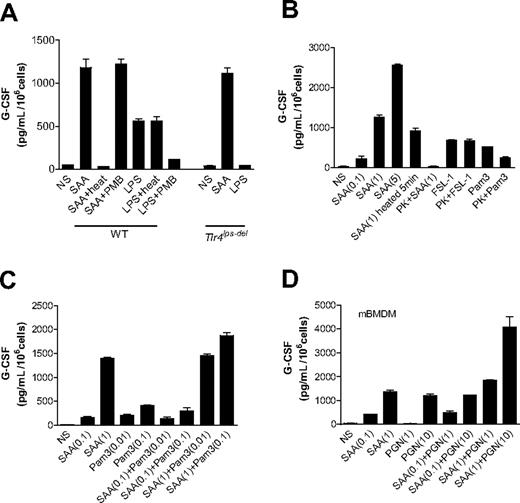
We next determined whether induction of G-CSF expression is a direct effect of SAA or results from contaminating LPS, lipopeptides, or PGN in the SAA preparation. The LPS content in the recombinant SAA preparation is less than or equal to 0.1 ng/μg protein, translating into less than or equal to 1.14 ng/mL LPS for 1 μM or 11.4 μg/mL SAA. LPS at this or a 10-fold higher concentration was unable to induce G-CSF secretion in BMDMs (data not shown). Only when used at 100 ng/mL did LPS induce a moderate production of G-CSF (Figure 2A). Given that most proteins are heat-labile whereas LPS is heat-resistant, we examined the ability of heat-treated SAA (1 μM) and LPS (100 ng/mL) to stimulate G-CSF secretion in mouse BMDMs. As shown in Figure 2A, after heating at 100°C for 25 minutes, LPS retained its ability to induce G-CSF production by approximately 83%. In contrast, SAA exposed at 100°C for 25 minutes could no longer stimulate G-CSF secretion. In parallel experiments, polymyxin B, an amphiphilic cyclic polycationic peptide that specifically binds to LPS and blocks its cytokine-inducing effect,40 had a minimal effect on the potency of SAA in stimulating G-CSF expression. Under the same experimental conditions, polymyxin B (50 μg/mL) reduced LPS-stimulated G-CSF secretion by more than 70%. Furthermore, BMDMs from Tlr4lps-del mice responded to SAA, but not LPS, to produce G-CSF at levels similar to that in WT cells (Figure 2A; Figure S1, available on the Blood website; see the Supplemental Materials link at the top of the online article). These results indicate that the trace amount of LPS in the SAA preparation cannot account for the robust induction of G-CSF secretion.
Endotoxin contamination does not contribute to SAA-induced G-CSF secretion. Mouse BMDMs were stimulated with different reagents for 24 hours, and secretion of G-CSF was measured using ELISA. (A) Both C57BL/6 (WT) and Tlr4lps-del BMDMs were used and incubated with LPS (1 μg/mL), SAA (1 μM), heat-treated LPS and SAA (100°C for 25 minutes), or polymyxin B (50 μg/mL, 1 hour)–treated SAA and LPS. (B) Mouse BMDMs were stimulated with the lipopeptides FSL-1 (1 μg/mL), Pam3CSK4 (1 μg/mL), or SAA (0.1, 1, and 5 μM, as indicated in parentheses), or with the same ligands treated with proteinase K (PK, 50 μg/mL) for 1 hour at 37°C and then heated at 100°C for 5 minutes for inactivating proteinase K. Short exposure of SAA to heat (100°C for 5 minutes), which caused only a small decrease on SAA activity, was used as a control. (C, D) Different concentrations of SAA (0.1 and 1 μM), Pam3CSK4 (0.01 and 0.1 μg/mL), PGN (1 and 10 μg/mL), and their mixtures were added to the cells. All data shown are mean plus or minus SEM from 3 experiments.
Endotoxin contamination does not contribute to SAA-induced G-CSF secretion. Mouse BMDMs were stimulated with different reagents for 24 hours, and secretion of G-CSF was measured using ELISA. (A) Both C57BL/6 (WT) and Tlr4lps-del BMDMs were used and incubated with LPS (1 μg/mL), SAA (1 μM), heat-treated LPS and SAA (100°C for 25 minutes), or polymyxin B (50 μg/mL, 1 hour)–treated SAA and LPS. (B) Mouse BMDMs were stimulated with the lipopeptides FSL-1 (1 μg/mL), Pam3CSK4 (1 μg/mL), or SAA (0.1, 1, and 5 μM, as indicated in parentheses), or with the same ligands treated with proteinase K (PK, 50 μg/mL) for 1 hour at 37°C and then heated at 100°C for 5 minutes for inactivating proteinase K. Short exposure of SAA to heat (100°C for 5 minutes), which caused only a small decrease on SAA activity, was used as a control. (C, D) Different concentrations of SAA (0.1 and 1 μM), Pam3CSK4 (0.01 and 0.1 μg/mL), PGN (1 and 10 μg/mL), and their mixtures were added to the cells. All data shown are mean plus or minus SEM from 3 experiments.
We also used proteinase K, which digests proteins but not lipopeptides, for pretreatment of SAA and lipopeptides. As shown in Figure 2B, the proteinase K treatment (PK + SAA) completely abolished SAA-induced G-CSF secretion but did not reduce the bioactivity of FSL-1. These results indicate that the SAA protein, but not contaminating lipoproteins in the SAA sample, is responsible for the induction of G-CSF secretion. Proteinase K decreased the bioactivity of Pam3CSK4 resulting from cleavage at Ser residues. We also conducted dose-response experiments to determine whether SAA cooperates with lipopeptides in G-CSF production. As shown in Figure 2C, SAA did not synergistically enhance the Pam3CSK4-induced G-CSF secretion. Similar results were observed with FSL-1 (Figure S2). Therefore, lipopeptide contaminant in the SAA preparation probably does not contribute significantly to the robust G-CSF secretion seen in these experiments. To determine whether PGN contamination causes the secretion of G-CSF, we first determined the level of contaminating PGN in the recombinant SAA using an SLP Reagent Set (Wako Chemicals, Richmond, VA). We found that the PGN content is less than or equal to 0.8 ng per μg SAA protein, or approximately 8 ng/mL PGN in our assay condition using SAA at 1 μM (11.4 μg/mL). PGN used at this concentration did not induce G-CSF detectable production from BMDMs (Figure 2D). We next conducted dose-response experiments and found that SAA cannot synergistically stimulate the PGN-induced G-CSF secretion (Figure 2D), indicating that the low level of PGN in the SAA preparation cannot be responsible for the induction of G-CSF secretion. Taken together, these results illustrated that the observed induction of G-CSF production is a direct effect of SAA.
The SAA-induced G-CSF secretion involves an increase of G-CSF mRNA in BMDMs. Elevation of G-CSF mRNA level was observed within 2 hours after SAA stimulation (Figure 3A), a response time suggesting that SAA-induced G-CSF expression is not secondary to another cytokine. Induction of G-CSF mRNA peaked at 4 hours after SAA stimulation (data not shown). Because transcription of the G-CSF gene involves NF-κB binding to the RelA/p65 consensus element in the CK-1 site of the G-CSF promoter,35,41 we determined the role of NF-κB in SAA-stimulated G-CSF expression. An electrophoretic mobility shift assay showed that SAA stimulated binding activity to a consensus NF-κB site in 30 minutes, which was effectively competed off with the unlabeled NF-κB probe (Figures 3B,S5). According to the manufacturer's protocol, the nonspecific complexes (NS bands) may either remain in the presence of specific competitor or decrease with the addition of any type of DNA (Promega Technical Bulletin TB110). Using the sequence of the CK-1 site from the G-CSF promoter (position −161 to −152 relative to the transcription start site) as an oligonucleotide probe, we also identified binding activity after a 30-minute SAA stimulation (Figure 3C). Chromatin immunoprecipitation analysis using a specific anti-RelA/p65 antibody confirmed that NF-κB was binding the CK-1 site in cells treated with SAA or TNF-α (50 ng/mL). Inclusion of a RelA/p65 antibody-blocking peptide in the assay abrogated the immunoprecipitation (Figure 3D).
SAA stimulates NF-κB activation and G-CSF transcript accumulation. (A) RT-PCR detection of G-CSF transcript in SAA-stimulated mouse BMDMs. β-Actin was used as a PCR and sample loading control. (B,C) Electrophoretic mobility shift assays showing SAA-induced binding of NF-κB (B) and CK-1 (C) to the respective DNA sequence in the promoter region of G-CSF, using nuclear extracts prepared from SAA- or buffer (CTL)–stimulated BMDMs. (D) A chromatin immunoprecipitation assay was conducted with SAA- or TNF-α (50 ng/mL)–stimulated RAW264.7 cells. An anti-p65/RelA antibody was used together with or without a specific blocking peptide. The immunoprecipitated DNA fragment was purified and amplified with PCR. DNA in total cell lysate was also amplified with PCR and used as a control. One representative experiment of a total of 3 is shown.
SAA stimulates NF-κB activation and G-CSF transcript accumulation. (A) RT-PCR detection of G-CSF transcript in SAA-stimulated mouse BMDMs. β-Actin was used as a PCR and sample loading control. (B,C) Electrophoretic mobility shift assays showing SAA-induced binding of NF-κB (B) and CK-1 (C) to the respective DNA sequence in the promoter region of G-CSF, using nuclear extracts prepared from SAA- or buffer (CTL)–stimulated BMDMs. (D) A chromatin immunoprecipitation assay was conducted with SAA- or TNF-α (50 ng/mL)–stimulated RAW264.7 cells. An anti-p65/RelA antibody was used together with or without a specific blocking peptide. The immunoprecipitated DNA fragment was purified and amplified with PCR. DNA in total cell lysate was also amplified with PCR and used as a control. One representative experiment of a total of 3 is shown.
SAA induces neutrophilia in mice
To investigate whether SAA-induced G-CSF secretion contributes to neutrophilia, we conducted in vivo studies in mice using daily administration of SAA. C57BL/6 mice were injected subcutaneously with a dose of 120 μg SAA/kg per day (∼ 3 μg SAA per mouse per day) for 7 consecutive days. Blood neutrophil numbers were determined daily, and the results were compared with neutrophil count in HSA-injected mice as controls. Compared with the 0-hour time point, the blood neutrophil numbers went up significantly after the injection in both groups of mice, and injection of SAA caused much more increase in neutrophils than HSA injection (Figure 4A). The plasma G-CSF levels in both groups were elevated significantly at 168 hours, suggesting that the procedures used on mice may cause stress that could trigger low levels of endogenous inflammatory mediators, such as G-CSF. Nevertheless, the SAA treatment group had a much higher plasma G-CSF level than the HSA group (Figure 4B), indicating that SAA stimulates G-CSF production in vivo. To establish a causal relationship between SAA-induced G-CSF production and neutrophilia in mice, we compared WT (C57BL/6) mice with mice lacking the gene for G-CSF (Csf3−/−). As shown in Figure 4C, Csf3−/− mice exhibited a significantly reduced response to SAA based on peripheral blood neutrophil count at the end of 48, 120, and 168 hours. These results establish that SAA induces neutrophilia in mice through stimulation of G-CSF production.
SAA-induced G-CSF production correlates with neutrophilia in mice. (A) SAA or HSA was injected subcutaneously into C57BL/6 mice (n = 8) at a dose of 120 μg/kg per day in 0.2 mL phosphate-buffered saline at 24-hour intervals. Blood samples were collected before (0 hours) and at 48, 120, and 168 hours after the initial SAA injection. Neutrophil numbers in whole blood were determined and presented as fold changes. (B) The plasma concentration of G-CSF in SAA-injected mice was determined using ELISA at 0 hours and 168 hours after the initial administration as in panel A, and shown as fold changes (maximum, 97 pg/mL). (C) SAA was injected subcutaneously into age- and sex-matched WT and Csf3−/− mice (n = 5), and peripheral blood neutrophil count was determined at the indicated time points as described in panel A. Statistical analysis was performed to compare neutrophil counts in Csf3−/− mice with those in WT mice and marked whenever there is a statistically significant difference. *P < .05, **P < .005, ***P < .001, compared with control mice (A,B) or WT mice (C). In all panels, there is a significant difference between treatment and pretreatment samples at each time point (P < .05).
SAA-induced G-CSF production correlates with neutrophilia in mice. (A) SAA or HSA was injected subcutaneously into C57BL/6 mice (n = 8) at a dose of 120 μg/kg per day in 0.2 mL phosphate-buffered saline at 24-hour intervals. Blood samples were collected before (0 hours) and at 48, 120, and 168 hours after the initial SAA injection. Neutrophil numbers in whole blood were determined and presented as fold changes. (B) The plasma concentration of G-CSF in SAA-injected mice was determined using ELISA at 0 hours and 168 hours after the initial administration as in panel A, and shown as fold changes (maximum, 97 pg/mL). (C) SAA was injected subcutaneously into age- and sex-matched WT and Csf3−/− mice (n = 5), and peripheral blood neutrophil count was determined at the indicated time points as described in panel A. Statistical analysis was performed to compare neutrophil counts in Csf3−/− mice with those in WT mice and marked whenever there is a statistically significant difference. *P < .05, **P < .005, ***P < .001, compared with control mice (A,B) or WT mice (C). In all panels, there is a significant difference between treatment and pretreatment samples at each time point (P < .05).
The SAA-stimulated G-CSF secretion and neutrophilia are critically dependent on TLR2
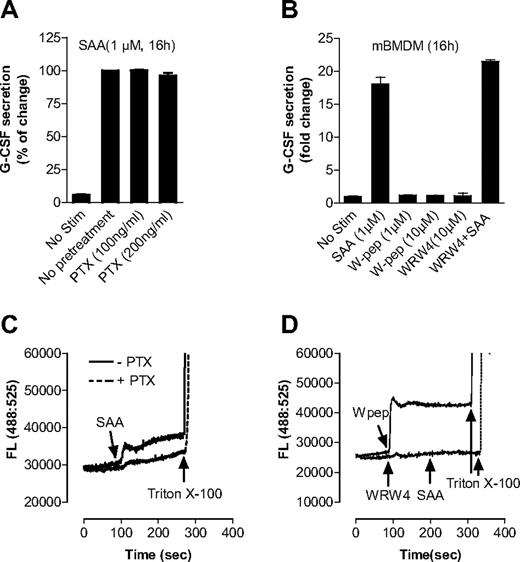
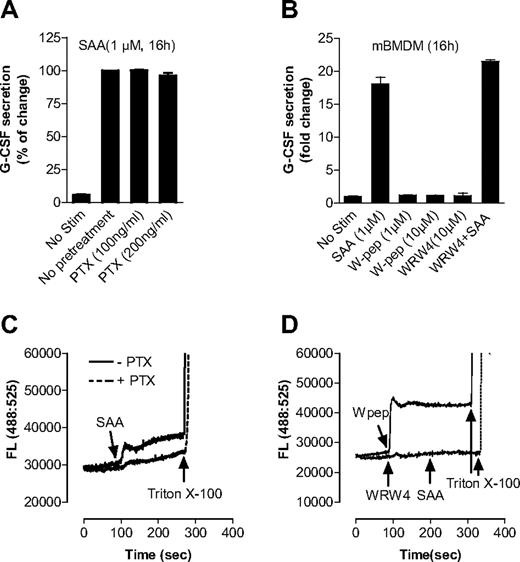
SAA has been known as a ligand for human FPRL1,20,42 which is coupled to the Gαi proteins for transmembrane signaling. FPRL1 is involved in SAA-induced production of IL-822 and matrix metalloproteinase.43 In this study, we found that pretreatment of BMDMs with PTX of up to 200 ng/mL, which effectively blocks Gαi interaction with chemoattractant receptors,44 had no significant effect on SAA-induced G-CSF secretion (Figure 5A). Moreover, the FPRL1 agonist WKYMVm (W peptide) was unable to stimulate G-CSF secretion in BMDMs, and its antagonist WRW4 had no inhibitory effect on SAA-induced G-CSF secretion (Figure 5B). Calcium mobilization assays using Fluo-3/AM–labeled C57BL/6 mouse neutrophils showed that both SAA and W peptide, as ligands of FPRL1, could trigger intracellular Ca2+ mobilization, and both PTX and WRW4 could effectively block SAA-induced Ca2+ signaling (Figure 5C,D), indicating that PTX, W peptide, and WRW4 were working properly. These results suggest that FPRL1 is not required for G-CSF secretion and neutrophilia in response to SAA.
SAA-induced G-CSF secretion in macrophages is not dependent on FPRL1. (A) Effect of PTX on SAA-induced G-CSF secretion. Mouse BMDMs were treated overnight either with PTX at indicted concentrations or with buffer control and then stimulated with SAA for 16 hours. The secreted G-CSF was determined with ELISA. (B) Mouse BMDMs were stimulated with SAA, WKYMVm (W-pep), WRW4 peptide, or SAA after pretreatment with WRW4 for 30 minutes at the indicated concentrations. After 16 hours, secreted G-CSF was determined with ELISA and presented as percentage of change, with maximal G-CSF (446 pg/mL/106 cells) set as 100%. Data are mean plus or minus SEM of 3 experiments, each performed in duplicate. To ensure that PTX, W-pep, and WRW4 were working properly through FPRL1, Fluo-3/AM–labeled mouse bone marrow neutrophils were used to measure the intracellular calcium mobilization with different FPRL1 ligands and antagonists. (C) Cells were pretreated with or without PTX (500 ng/mL, 1 hour) and then stimulated with 0.1 μM SAA. (D) Cells were stimulated with W pep (0.1 μM) or WRW4 (10 μM), and then SAA (0.1 μM). One representative experiment of a total of 3 is shown.
SAA-induced G-CSF secretion in macrophages is not dependent on FPRL1. (A) Effect of PTX on SAA-induced G-CSF secretion. Mouse BMDMs were treated overnight either with PTX at indicted concentrations or with buffer control and then stimulated with SAA for 16 hours. The secreted G-CSF was determined with ELISA. (B) Mouse BMDMs were stimulated with SAA, WKYMVm (W-pep), WRW4 peptide, or SAA after pretreatment with WRW4 for 30 minutes at the indicated concentrations. After 16 hours, secreted G-CSF was determined with ELISA and presented as percentage of change, with maximal G-CSF (446 pg/mL/106 cells) set as 100%. Data are mean plus or minus SEM of 3 experiments, each performed in duplicate. To ensure that PTX, W-pep, and WRW4 were working properly through FPRL1, Fluo-3/AM–labeled mouse bone marrow neutrophils were used to measure the intracellular calcium mobilization with different FPRL1 ligands and antagonists. (C) Cells were pretreated with or without PTX (500 ng/mL, 1 hour) and then stimulated with 0.1 μM SAA. (D) Cells were stimulated with W pep (0.1 μM) or WRW4 (10 μM), and then SAA (0.1 μM). One representative experiment of a total of 3 is shown.
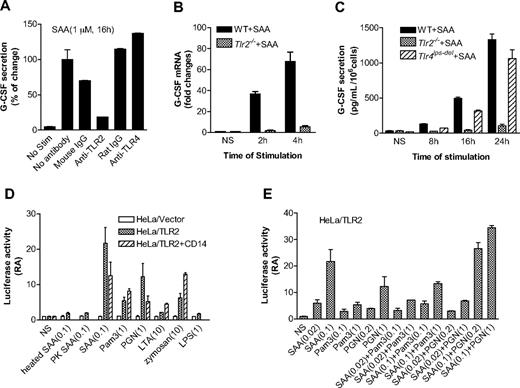
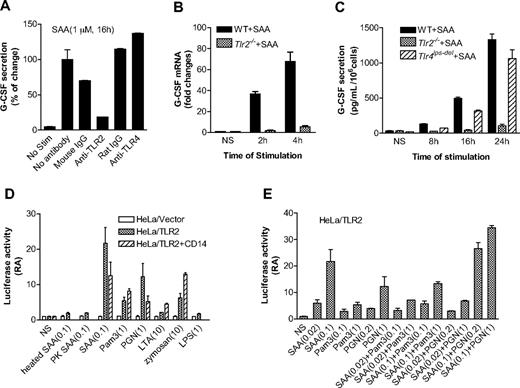
We recently reported that SAA preferentially induces IL-23 expression.37 Therefore, SAA may be upstream of the IL-23 pathway that leads to IL-17–stimulated G-CSF secretion.45 Published reports indicate that TLR2 activation leads to IL-23 production, whereas TLR4 activation results in the synthesis of both IL-23 and IL-12.46,47 We speculated that TLR2 might be involved in SAA-stimulated G-CSF expression. This possibility was first examined using neutralizing antibodies against TLR2 and TLR4 in SAA-induced G-CSF expression assay. The anti-TLR2 antibody (clone T2.5), but not the anti-TLR4 antibody (clone MTS510), causes a marked reduction (∼ 80% compared with samples that had no antibody and ∼ 70% compared with samples having mouse IgG) in G-CSF secretion (Figure 6A).
TLR2 is necessary for SAA-induced G-CSF expression. (A) Inhibition of SAA-induced G-CSF secretion in mouse BMDM by an anti-TLR2 mouse antibody but not an anti-TLR4 rat antibody (5 μg/mL each). Antibody treatment was for 1 hour. Isotype-matching IgG controls for the mouse and rat antibodies were included. The secreted G-CSF (591 pg/mL/106 cells) by SAA without antibody pretreatment was set as 100%. (B) The G-CSF mRNA level was determined by real-time PCR using RNA prepared from SAA (1 μM)-stimulated or unstimulated (NS) BMDM from WT C57BL/6 and Tlr2−/− mice. The relative concentrations of the G-CSF transcript are presented as fold changes over unstimulated sample (mean plus or minus SEM from 4 experiments, each in duplicate). (C) BMDMs from WT C57BL/6, Tlr2−/−, and Tlr4lps-del mice were stimulated with 1 μM SAA, and the secreted G-CSF was determined at the indicated time points using ELISA. Data are presented as mean plus or minus SEM of 3 experiments, each performed in duplicate. (D,E) The TLR2-overexpressed HeLa cells (HeLa/TLR2) or mock-transfected HeLa cells (HeLa/vector) were transiently transfected with G-CSF luciferase reporter cDNA and then stimulated with different reagents for 5 hours. The luciferase activity was measured as described in “Luciferase report assay.” Data are mean plus or minus SEM of 2 to 4 experiments, each performed in triplicate. In panel D, cells were stimulated with SAA (0.1 μM), Pam3CSK4 (1 μg/mL), PGN (1 μg/mL), LTA (10 μg/mL), zymosan (10 μg/mL), and LPS (1 μg/mL). Heat-treated (100°C, 25 minutes) and proteinase K- (50 μg/mL, 1 hour) treated SAA were also used in the study. In panel E, cells were stimulated with different concentrations of SAA (0.02 and 0.1 μM), Pam3CSK4 (0.1 and 1 μg/mL), and PGN (0.2 and 1 μg/mL), either alone or in combination.
TLR2 is necessary for SAA-induced G-CSF expression. (A) Inhibition of SAA-induced G-CSF secretion in mouse BMDM by an anti-TLR2 mouse antibody but not an anti-TLR4 rat antibody (5 μg/mL each). Antibody treatment was for 1 hour. Isotype-matching IgG controls for the mouse and rat antibodies were included. The secreted G-CSF (591 pg/mL/106 cells) by SAA without antibody pretreatment was set as 100%. (B) The G-CSF mRNA level was determined by real-time PCR using RNA prepared from SAA (1 μM)-stimulated or unstimulated (NS) BMDM from WT C57BL/6 and Tlr2−/− mice. The relative concentrations of the G-CSF transcript are presented as fold changes over unstimulated sample (mean plus or minus SEM from 4 experiments, each in duplicate). (C) BMDMs from WT C57BL/6, Tlr2−/−, and Tlr4lps-del mice were stimulated with 1 μM SAA, and the secreted G-CSF was determined at the indicated time points using ELISA. Data are presented as mean plus or minus SEM of 3 experiments, each performed in duplicate. (D,E) The TLR2-overexpressed HeLa cells (HeLa/TLR2) or mock-transfected HeLa cells (HeLa/vector) were transiently transfected with G-CSF luciferase reporter cDNA and then stimulated with different reagents for 5 hours. The luciferase activity was measured as described in “Luciferase report assay.” Data are mean plus or minus SEM of 2 to 4 experiments, each performed in triplicate. In panel D, cells were stimulated with SAA (0.1 μM), Pam3CSK4 (1 μg/mL), PGN (1 μg/mL), LTA (10 μg/mL), zymosan (10 μg/mL), and LPS (1 μg/mL). Heat-treated (100°C, 25 minutes) and proteinase K- (50 μg/mL, 1 hour) treated SAA were also used in the study. In panel E, cells were stimulated with different concentrations of SAA (0.02 and 0.1 μM), Pam3CSK4 (0.1 and 1 μg/mL), and PGN (0.2 and 1 μg/mL), either alone or in combination.
We next stimulated WT and Tlr2−/− BMDMs with SAA (1 μM) and determined the level of G-CSF transcript (Figure 6B). SAA induced a 37-fold increase in G-CSF transcript within 2 hours of stimulation, whereas the response of Tlr2−/− BMDMs to SAA was nearly ablated (6% of control). At the protein level, the ability of SAA to induce G-CSF secretion was markedly reduced in TLR2-deficient BMDMs but only slightly reduced in TLR4-deficient BMDMs (Figure 6C). These results demonstrate that TLR2 is critically involved for SAA-induced expression of G-CSF in vitro.
To further establish a direct role for TLR2 in SAA-induced G-CSF expression, we prepared TLR2-expressing HeLa cells, which contain very low level of endogenous TLR2 (data not shown). Stable transfection of HeLa with a TLR2 cDNA expression construct resulted in abundant cell-surface expression of TLR2.48 We also generated a G-CSF luciferase reporter construct that contains the CK-1 site of the G-CSF promoter region and conducted luciferase reporter assay in HeLa/TLR2 cells. The HeLa/TLR2 cell line responded to SAA with a significantly increased G-CSF promoter-driven luciferase activity compared with mock-transfected HeLa cells (P < .01). In comparison, heat-denatured or proteinase K–treated SAA could not stimulate the luciferase activity (Figure 6D). Compared with other microbial TLR2 agonists, SAA induced relatively high luciferase activity and CD14 did not enhance this activity (Figure 6D). We also performed dose-response experiments and showed that SAA could not synergistically increase either Pam3CSK4 or PGN-induced G-CSF luciferase activity (Figure 6E). These results confirmed that SAA stimulates G-CSF expression through TLR2; the stimulation is a direct effect of SAA and not from contaminating lipopeptides or PGN in the SAA preparation.
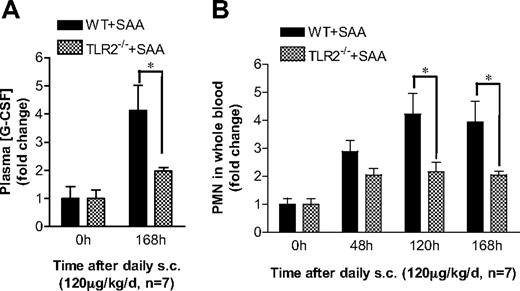
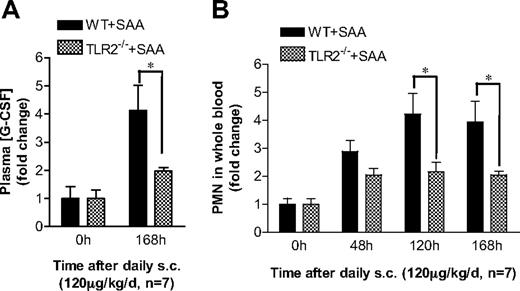
Finally, we determined the in vivo effects of TLR2 gene deletion on SAA-induced G-CSF production and neutrophilia. Subcutaneous injection of SAA was carried out in Tlr2−/− mice and WT controls for 7 days. Both WT and Tlr2−/− mice responded to SAA treatment with significant increases on the plasma G-CSF levels and peripheral blood neutrophil counts (Figure 7). As shown in Figure 7A, Tlr2−/− mice produced significantly less plasma G-CSF than the WT mice. Consistent with this observation, the SAA-stimulated increase in peripheral blood neutrophil count was significantly lower in Tlr2−/− mice than in WT mice (Figure 7B). These data demonstrate a critical role of TLR2 in mediating SAA-induced G-CSF production and neutrophilia in mice.
TLR2 is required for SAA-induced neutrophilia in mice. (A) SAA was injected subcutaneously into age- and sex-matched C57BL/6 and Tlr2−/− mice (n = 7). The plasma concentration of G-CSF was determined at the end of the study (168 hours). (B) SAA was injected into these mice as in panel A. Blood samples were collected before injection (0 hours) and at 48, 120, and 168 hours after the initial injection. Neutrophil counts in the whole blood were obtained from WBC differential counts and presented as fold changes. *P < .05 compared with WT mice. In both types of mice, there is a significant difference (P < .05) between 0 hours and other time points in all panels.
TLR2 is required for SAA-induced neutrophilia in mice. (A) SAA was injected subcutaneously into age- and sex-matched C57BL/6 and Tlr2−/− mice (n = 7). The plasma concentration of G-CSF was determined at the end of the study (168 hours). (B) SAA was injected into these mice as in panel A. Blood samples were collected before injection (0 hours) and at 48, 120, and 168 hours after the initial injection. Neutrophil counts in the whole blood were obtained from WBC differential counts and presented as fold changes. *P < .05 compared with WT mice. In both types of mice, there is a significant difference (P < .05) between 0 hours and other time points in all panels.
Discussion
Results from this study demonstrate that SAA is an endogenous factor that stimulates G-CSF expression in isolated macrophages and induces neutrophilia in mice. These findings provide, for the first time, a mechanism underlying the correlation between elevation of acute-phase SAA and a contemporaneous neutrophilia. Neutrophils provide the first line of host defense against bacterial and fungal infections.49 Continual production of neutrophils is critical to host protection from invading bacteria and fungi. Our findings indicate that, on one hand, SAA secreted during the acute-phase response can enhance innate immune response to pathogens in part through expansion of the neutrophil compartment. On the other hand, neutrophil accumulation and activation can cause tissue damage in the context of autoimmunity, and the resulting inflammation can amplify and sustain disease activity.33 G-CSF itself might also directly exacerbate inflammation in peripheral tissues, as well as driving enhanced granulopoiesis.33 Based on our results, the high levels of plasma SAA observed in many inflammatory diseases, such as atherosclerosis,3,4 rheumatoid arthritis,5 and Crohn disease,6 can possibly contribute to the progression of these diseases through induction of G-CSF and sustained neutrophilia.
In this paper, we have also shown that TLR2 mediates SAA-induced G-CSF production and neutrophilia. In Tlr2−/− mice, SAA-stimulated G-CSF production is significantly decreased, and SAA-induced neutrophilia is drastically reduced. Furthermore, the in vitro reconstitution experiments using the HeLa/TLR2 cell line demonstrate that SAA can induce TLR2-dependent, G-CSF promoter-driven luciferase reporter activity. Therefore, there is a causal relationship between SAA, TLR2-dependent G-CSF production, and neutrophilia. We have recently conducted a more detailed study on SAA interaction with TLR2.48 In that study, we showed that SAA could bind to the ectodomain of TLR2 and induce the expression of selected cytokine genes. Moreover, SAA activation of TLR2 requires an intact N-terminal region, as deletion of the first 14 amino acids from SAA drastically reduced its bioactivity. Among all the TLRs, TLR2 is found to recognize the broadest spectrum of microbial components, including the cell wall structures of Gram-positive bacteria, yeast, parasites, and viruses, partially because it cooperates with other TLRs, including TLR6 and TLR1.50 In addition to microbial pathogens, endogenous proteins, such as heat shock proteins Hsp60, Hsp70, and Gp96, have been found to activate TLR2 as well.51 More recently, polysaccharide fragments of hyaluronan, which is produced after tissue injury, were reported to stimulate macrophage chemokine production in a TLR2-dependent manner.52 High-mobility group box 1, a host-derived ubiquitous protein, was also reported to interact with TLR2 and play a role in inflammation.30 Our finding that the acute-phase protein SAA induces G-CSF secretion and increases neutrophil numbers in the whole blood via TLR2 provides yet another example that TLR2 can recognize an endogenous “danger signals” and can help explain the granulopoiesis seen with sterile inflammation. These results also suggest that TLR2 plays a role in the pathogenesis of several autoimmune diseases, such as rheumatoid arthritis and atherosclerosis.53
In previous studies, bacterial contamination of recombinant proteins has complicated data interpretation when evaluating endogenous TLR ligands. We have taken precautions in the determination of whether SAA or the contaminating bacterial products such as LPS and lipoproteins are responsible for the G-CSF–inducing effect. Based on the observations that the anti-TLR4 antibody had no inhibitory effect on SAA-stimulated G-CSF secretion and Tlr4lps-del BMDMs responded to SAA to produce similar levels of G-CSF as WT BMDMs did, we concluded that the contaminating TLR4 ligand LPS cannot account for the potent induction of G-CSF stimulated by SAA. To determine whether bacterial lipoprotein contamination could significantly contribute to the SAA-induced G-CSF secretion, we treated SAA samples with proteinase K, which destroys proteins but not bacterial lipoproteins. As expected, the proteinase K–treated SAA lost its bioactivity, indicating that the G-CSF response to SAA cannot be attributed to lipoprotein contamination in the SAA preparation. The same conclusion can be drawn from experiments using lipoprotein lipase from Pseudomonas sp, which did not affect the SAA-induced G-CSF secretion at concentrations ranging from 0.025 to 0.1 mg/mL but inhibited Pam3CSK4-induced G-CSF production (Figures S6,S7). We have also shown that SAA does not synergistically enhance the effect of either lipopeptides or PGN (Figures 2C,D, 6E), and CD14 is not necessary for SAA to activate TLR2, although it is important for optimal activation by microbial TLR2 agonists (Figures 6D,S4). These data further demonstrate that the SAA protein is largely responsible for the observed TLR2-dependent G-CSF induction activity. To further exclude bacterial contaminants as a cause of the bioactivity of SAA through TLR2, we produced recombinant SAA in mammalian cells under sterile culture conditions. The potency of the mammalian cell-derived SAA at least equals (and even surpasses) that of the E coli–derived recombinant SAA when tested on a TLR2-transfected cell line.48 These results strongly support the conclusion that SAA is an endogenous ligand for TLR2.
In addition to TLR2, SAA can also activate the chemoattractant receptor FPRL1/ALX,20 resulting in recruitment of neutrophils and inhibition of neutrophil apoptosis.42,54 However, in this study, we did not observe any FPRL1-dependent SAA-triggered neutrophil increase. The injection of HSA alone caused a small but statistically significant increase in blood neutrophils, but there was no significant difference between HSA-injected WT mice and SAA-injected Csf3−/− or Tlr2−/− mice at each time point (Figures 4A,C, 7B). Therefore, the effects of SAA in Csf3−/− or Tlr2−/− mice may be a nonspecific response to an injection protocol. We also found that, although SAA stimulates a very low level of G-CSF production in Tlr2−/− BMDMs (Figure 6B,C), this induction cannot be inhibited by FPRL1/ALX antagonists (Figure S3). More recently, Sandri et al reported that SAA can activate TLR4 and subsequently stimulate NO production in murine peritoneal macrophages.55 These findings are intriguing. However, we found no statistically significant differences in the G-CSF secretion between SAA-stimulated WT and Tlr4lps-del BMDMs (P < .05; Figure 6C). Although the current study was not designed to determine whether TLR4 is a receptor for SAA, our results demonstrate that TLR4 is not responsible for the SAA-induced G-CSF secretion. Further studies will be necessary to compare TLR2 with TLR4 and other potential SAA receptors for their signaling properties.
In conclusion, the current study establishes a causal relationship between increased production of SAA and G-CSF–mediated neutrophilia in mice. This study also shows that the SAA-induced G-CSF expression and neutrophilia are critically dependent on TLR2. Our results provide direct evidence for a novel function of SAA in inflammation and immunity, demonstrating that the widely recognized biomarker for inflammatory diseases is not just a byproduct of inflammation but plays an active role in the regulation of inflammation and innate immunity.
The online version of this article contains a data supplement.
The publication costs of this article were defrayed in part by page charge payment. Therefore, and solely to indicate this fact, this article is hereby marked “advertisement” in accordance with 18 USC section 1734.
Acknowledgments
We thank Dr Benjamin Gantner for helpful discussions and critical reading of the manuscript and Dr Mathew Fenton for suggestions.
National Institutes of Health
Authorship
Contribution: R.L.H. developed the concept, designed and performed experiments, analyzed data, and prepared the manuscript; J.Z., C.Z.H., and J.C. performed experiments; N.C. generated the HeLa/TLR2 cell line and helped troubleshoot the experiments; and R.D.Y. developed the concept and contributed to manuscript preparation.
Conflict-of-interest disclosure: The authors declare no competing financial interests.
Correspondence: Rong Lucy He, Department of Pharmacology, University of Illinois at Chicago, 835 South Wolcott Avenue, M/C 868, Chicago, IL 60612; e-mail: ronghe@uic.edu.


