Inactivation of the CDKN2 genes that encode the p16INK4A and p14ARF proteins occurs in the majority of human T-cell acute lymphoblastic leukemias (T-ALLs). Ectopic expression of TAL1 and LMO1 genes is linked to the development of T-ALL in humans. In TAL1xLMO1 mice, leukemia develops in 100% of mice at 5 months. To identify the molecular events crucial to leukemic transformation, we produced several mouse models. We report here that expression of P16INK4A in developing TAL1xLMO1 thymocytes blocks leukemogenesis in the majority of the mice, and the leukemias that eventually develop show P16INK4A loss of expression. Events related to the T-cell receptor β selection process are thought to be important for leukemic transformation. We show here that the absence of the pTα chain only slightly delays the appearance of TAL1xLMO1-induced T-ALL, which indicates a minor role of the pTα chain. We also show that the CD3ϵ-mediated signal transduction pathway is essential for this transformation process, since the TAL1xLMO1xCD3ϵ-deficient mice do not develop T-ALL for up to 1 year.
Introduction
T-cell acute lymphoblastic leukemias (T-ALLs) are considered to be due to the neoplastic transformation of thymocytes.1,,–4 During normal ontogeny, the immature thymocytes proceed through 4 double-negative (DN1 to DN4) stages. At the DN3 stage, thymocytes rearrange the β chain of the T-cell receptor (TCR) and assemble together with the pre-T alpha chain (pTα) and then with the CD3 complex to constitute the pre-TCR. The proliferation of thymocytes, first driven by various interleukins and c-Kit, becomes driven by the pre-TCR/CD3. Pre-TCR signaling depends on the SRC-family kinase LCK, the SYK-family kinase ZAP70, and the adaptor proteins SLP76 and LAT (reviewed in von Boehmer5 ). Then, the phospholipase C–γ and MAPK pathways are activated, which regulates some transcription factors required for the differentiation, proliferation, and survival of immature thymocytes. This activation leads to DN4 expansion followed by differentiation into double-positive (DP) CD4+CD8+ thymocytes that do not proliferate. DP thymocytes are subjected to thymic selection and differentiate into CD4 or CD8 single-positive (SP) thymocytes that leave the thymus.5 Although leukemic thymocytes present phenotypic similarities, it is not clear that they proceed through the same steps as normal thymocytes.
Among the chromosomal abnormalities associated with T-ALL, the most frequent implicate the TAL1 and CDKN2 (INK4A and ARF) genes. The TAL1 gene (also known as SCL6 ) encodes a transcription factor essential during erythroid lineage differentiation.7,8 Chromosomal translocation or microdeletion next to the TAL1 locus were found in about 30% of the T-ALL cases leading to unscheduled TAL1 expression, and recent studies have noted TAL1 expression in about 49% of the pediatric T-ALL cases.6,9,–11 In most cases, expression of the TAL1 gene was associated with expression of one of the LIM domain-only genes LMO1 or LMO2.1,12,13 Furthermore, using a global gene expression analysis with the U133A microarray for 92 T-ALL cases, we previously identified 2 stable subgroups of T-ALL expressing the TAL1 gene, which cluster with normal thymocyte subpopulations expressing the phenotype of the post–β-selection stages.14(Fig 4; Fig S1)
The TAL1 gene expression alone induces leukemia only after a year in less than 30% of the transgenic mice.15,–17 In parallel, LMO1 or LMO2 transgenic mice also develop leukemia at low frequency after more than 1 year.16,,–19 Thus, the marked increase in the tumor incidence and the reduction of the asymptomatic period observed in more complex transgenic mouse models such as TAL1xMO1 and TAL1xLMO1xp16INK4A+/− indicate that several genetic events in addition to TAL1 expression are necessary for leukemogenesis.17,20,–22
CDKN2 inactivation is observed in more than 80% of human T-ALL cases. Analysis of the locus revealed frequent homozygous deletion of exon 2 that leads to the loss of both proteins p16ink4a and p14Arf.23,,–26 In contrast, other patients exhibit alterations that only affect 1 gene, either p16ink4a or p14ARF. Specifically, in rare patients, T-ALL cells exhibit p16 promoter hypermethylation.26,–28 We previously showed that p16INK4A promoter is activated in T-ALL cells that had not deleted the INKA4-ARF locus.26 Recently, it has been shown that P16INK4A loss contributes to TAL1-induced leukemogenesis in mice.22 p16INK4A is a tumor suppressor gene that can be triggered during telomere attrition-induced senescence and during oncogene-induced senescence (for reviews see Ortega et al,29 Ben-Porath and Weinberg,30 and Campisi31 ). Thus, its activation in thymocytes could be part of the resistance mechanisms against malignant transformation.
To determine the overall contribution of p16INK4A expression and pre-TCR/CD3 molecules to the development of TAL1-LMO1–induced leukemia, we generated cohorts of TAL1+/−xLMO1+/−xp16+/− mice, TAL1+/−xLMO1+/−xpTαko mice, and TAL1+/−xLMO1+/−xCD3ϵko mice. We observed that p16INK4A transgene expression in mouse thymocytes has a dominant tumor suppression effect over TAL1 and LMO1 oncogenic effects. Interestingly, the loss of the p16INK4A transgene occurs later in the majority of the mice and leads to T-ALL. Finally, we show here that the absence of the CD3ϵ molecule in TAL1xLMO1-expressing thymocytes protects them from oncogenic transformation, whereas the absence of the pTα chain only delays the onset of disease.
Patients, materials, and methods
This study was approved by the Hôpital Saint-Louis and the Institut Universitaire d'Hématologie institutional review boards.
Human samples and analyses
For the human samples, T-ALL patients were diagnosed and treated at Saint-Louis hospital, Paris, France. Informed consent was obtained from the patients and/or relatives in accordance with the Declaration of Helsinki. Eighty-three leukemic samples were used; 82 of them, classified for oncogenic groups and previously included in a study of large-scale mRNA expression using microarrays,14 were characterized for CDKN2A locus deletion using Southern blotting and multiple probes (38 cases25,26,32 ) or array-based comparative genomic hybridization (aCGH) using a BAC/PAC 4K array33 (30 cases, relevant CDKN2A clone: RP11–149I2) or high-density oligonucleotide aCGH (14 cases; Agilent Technology, Palo Alto, CA). In addition to the 82 leukemic samples, leukemic cells from the T109 case and Jurkat and Hela cell lines were used in some experiments. Unsorted and sorted thymocytes described in Soulier et al14 were also analyzed. Microarray and reverse quantitative–polymerase chain reaction (RQ-PCR) analyses of CDKN2A expression were performed according to standard methods (Document S1, available on the Blood website; see the Supplemental Materials link at the top of the online article).
Mice construction and analyses
TAL1 and LMO1 transgenic mice were generated as described.17 P16INK4A mice were generated as described.34 pTα-deficient mice35 and CD3ϵ-deficient mice36 were provided by Centre de Distribution, Typage et Archivage Animale-Centre National de la Recherche Scientifique (CDTA-CNRS; Orléans, France). TAL1 mice were crossed to P16INK4A mice and LMO1 mice were crossed to P16INK4A mice. F1 mice were crossed to generate TAL1+/−xLMO1+/−xP16 mice. These mice were not tested for p16 homozygote and heterozygote.
TAL1 mice and LMO1 mice were also crossed and then backcrossed separately to pTα-deficient mice and to CD3ϵ-deficient mice to generate pTαkoxTAL1+/− mice, pTαkoxLMO1+/− mice, CD3ϵkoxTAL1+/− mice, and CD3ϵkoxLMO1+/− mice that were then crossed to generate the pTαkoxTAL1+/−xLMO1+/− mice and CD3ϵkoxTAL1+/−xLMO1+/− mice. All animal manipulations and housing were in accordance with our Research Institute Animal Care Committee guidelines. Genotyping of mice and analyses of mice tissues and cells were performed using standard methods (Document S1).
Results
CDKN2A mRNA expression is high in some human T-ALL cases but not in normal thymic subpopulations
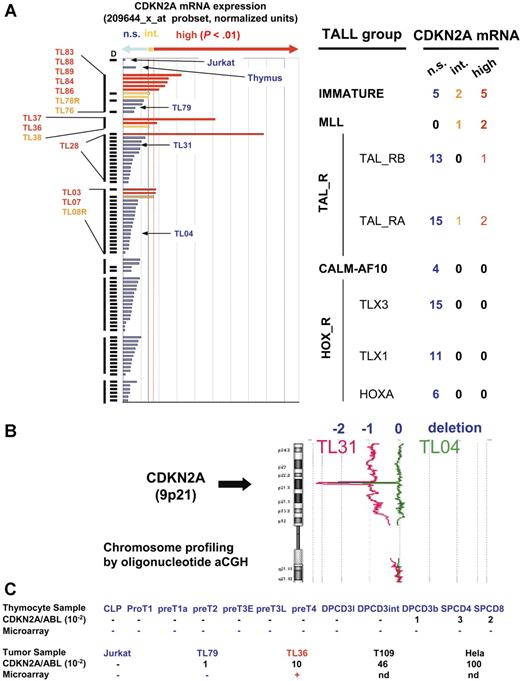
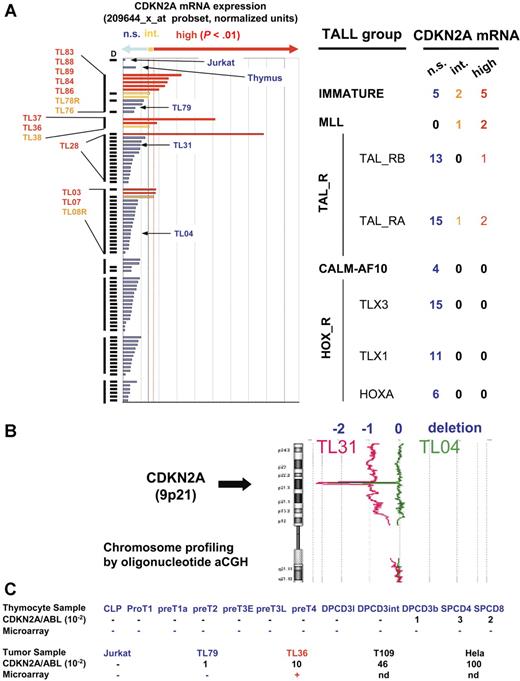
A series of 82 T-ALL cases was characterized for the deletion of the CDKN2A locus (see “Patients, materials, and methods, Human samples and analysis”), showing a deletion of at least 1 locus allele in 83% of cases (Figure 1A). These cases were evaluated for expression of the CDKN2A mRNA using microarray analysis. No significant CDKN2A expression could be detected in 68 of 82 T-ALL cases, and the expression was intermediate in 4 samples and high in 10 cases. In the cases with CDKN2A expression, at least 1 CDKN2A allele was detected as nondeleted by genomic analyses. Interestingly, significant CDKN2A expression was correlated with the oncogenic groups defining the samples (P < .001, extended Fisher test; Figure 1A). CDKN2A expression was not detected in HOX-R cases (TLX1, 11 cases; TLX3, 15 cases; HOXA, 6 cases) or in cases expressing CALM-AF10 fusion transcripts (4 cases). A significant expression was observed in 4 of the 28 TAL-R samples. Strikingly, CDKN2A mRNA expression was detected in all 3 MLL cases and in 7 of the 12 cases of the immature group. By contrast, no significant expression was detected in the thymus sample (Figure 1A) or in the sorted thymocyte subsets (not shown).
CDKN2A (p16ink4a) mRNA expression in human samples. (A) Study of CDKN2A mRNA expression using microarrays (U133A, 209644_x_at probe set; Affymetrix Technology, Santa Clara, CA). Evaluation was done as described14 on the 84 T-ALL samples (including Jurkat cell line) in which the status of the CDKN2A locus has been studied by Southern-blotting experiments, BAC array CGH, or oligonucleotide array CGH. D indicates that at least 1 of the CDKN2A alleles has been deleted. Expression is expressed in arbitrary units and classified according to the distribution of the noise (see “Patients, materials, and methods, Human samples and analyses” for details). P values less than .025 were considered as significant (alpha risk). NS indicates no significant expression (blue); Int, intermediate expression significant but P values greater than .01 (orange); high, high expression (P < .01; red). Cases were grouped according to oncogenic groups previously defined.14 T-ALL cases expressing significant levels of CDKN2A mRNA are identified by their unique patient number and printed with the color code defined by the level of CDKN2A expression. The order of the labels is identical to that shown in histograms. No significant expression was detected in thymocyte subsets (not shown). (B) Study of CDKN2A locus deletion by oligonucleotide aCGH. Two representative cases (TL04 and TL31) with CDKN2A locus biallelic deletions are shown. Values (−1) and (−2) represent ratio corresponding to the deletion of 1 allele and 2 alleles, respectively. TL04 shows a short deletion on both alleles, whereas TL31 shows a short deletion of 1 allele and a large 9p deletion (encompassing the second CDKN2A allele). (C) Study of CDKN2A mRNA expression by RQ-PCR and comparison with microarray data. Color code is identical to that used in panel A. RQ-PCR was performed using standard procedures. Efficiency and specificity of the p16INK4A RQ-PCR system was assessed on Hela DNA (50 ng/μL) serially diluted from 10−1 to 10−5. Calibration curves were performed using 10-fold serial dilutions of diagnostic DNA. ABL gene was used to normalize the samples. No template controls (H2O) as well as nonamplification controls (Jurkat leukemia cell-line DNA) were included in each assay. Expression lower than 10−2 was considered as not significant (ns) and not detailed in the figure.
CDKN2A (p16ink4a) mRNA expression in human samples. (A) Study of CDKN2A mRNA expression using microarrays (U133A, 209644_x_at probe set; Affymetrix Technology, Santa Clara, CA). Evaluation was done as described14 on the 84 T-ALL samples (including Jurkat cell line) in which the status of the CDKN2A locus has been studied by Southern-blotting experiments, BAC array CGH, or oligonucleotide array CGH. D indicates that at least 1 of the CDKN2A alleles has been deleted. Expression is expressed in arbitrary units and classified according to the distribution of the noise (see “Patients, materials, and methods, Human samples and analyses” for details). P values less than .025 were considered as significant (alpha risk). NS indicates no significant expression (blue); Int, intermediate expression significant but P values greater than .01 (orange); high, high expression (P < .01; red). Cases were grouped according to oncogenic groups previously defined.14 T-ALL cases expressing significant levels of CDKN2A mRNA are identified by their unique patient number and printed with the color code defined by the level of CDKN2A expression. The order of the labels is identical to that shown in histograms. No significant expression was detected in thymocyte subsets (not shown). (B) Study of CDKN2A locus deletion by oligonucleotide aCGH. Two representative cases (TL04 and TL31) with CDKN2A locus biallelic deletions are shown. Values (−1) and (−2) represent ratio corresponding to the deletion of 1 allele and 2 alleles, respectively. TL04 shows a short deletion on both alleles, whereas TL31 shows a short deletion of 1 allele and a large 9p deletion (encompassing the second CDKN2A allele). (C) Study of CDKN2A mRNA expression by RQ-PCR and comparison with microarray data. Color code is identical to that used in panel A. RQ-PCR was performed using standard procedures. Efficiency and specificity of the p16INK4A RQ-PCR system was assessed on Hela DNA (50 ng/μL) serially diluted from 10−1 to 10−5. Calibration curves were performed using 10-fold serial dilutions of diagnostic DNA. ABL gene was used to normalize the samples. No template controls (H2O) as well as nonamplification controls (Jurkat leukemia cell-line DNA) were included in each assay. Expression lower than 10−2 was considered as not significant (ns) and not detailed in the figure.
Quantitative RQ-PCR experiments were performed on the sorted thymocyte subsets and on 3 selected T-ALL cases (TL36, TL79, and T109) and cell lines. Concordant results of the microarray and RQ-PCR experiments were observed, although RQ-PCR appears more sensitive than microarray to detect a very low level of CDKN2A mRNA expression (Figure 1B). CDKN2A transcripts were detected by RQ-PCR at a very low level in the TL79 case and at a moderate and high level in cases TL36 and T109, respectively. The CDKN2A locus status, characterized by Southern blot in these 3 cases, was as follows: TL36 (MLL oncogenic group) had 2 alleles in germ line configuration (and the p16INK4a protein was detectable by Western blot; not shown), TL79 (immature group) had 2 alleles in germ-line configuration, and T109 (oncogenic group not assigned) had a monoallelic deletion and a point mutation leading to a stop codon in exon 2 on the remaining allele.32 As expected, no expression could be detected in the Jurkat cell line in which both CDKN2A alleles are deleted. Concordant with microarray experiments,14 CDKN2A mRNA expression was not detected at a significant level (ie, higher than 10−2 compared with ABL expression) in 9 sorted normal human thymic subpopulations and was detected at a very low level in the 3 last subpopulations (Figure 1B).
p16INK4A, TAL1, and LMO1 coexpression results in 2 different cell-differentiation patterns
In our TAL1xLMO1 transgenic mouse model, TAL1 is driven by the SIL promoter whereas LMO1 is driven by the p56LCK proximal promoter.17 In these mice, thymic differentiation is altered at birth and mice die of leukemia before 5 months whereas TAL1 mice and LMO1 mice do not.17 In contrast, human p16INK4A expression in the normal mouse thymus, which is driven by the p56LCK promoter, has been shown to drastically reduce T-cell differentiation.34
To compare T-cell development in TAL1xLMO1 mice and in p16INK4AxTAL1xLMO1 mice, we generated p16INK4AxTAL1xLMO1 mice, named p16TLM thereafter.
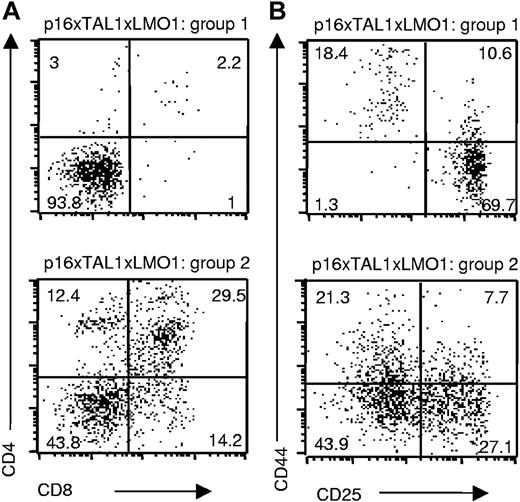
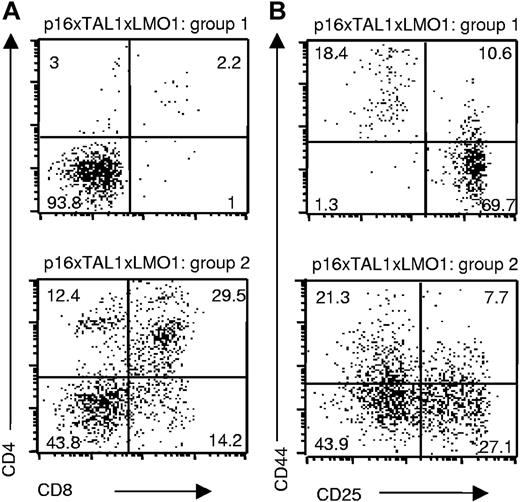
When we compared 4-week-old p16TLM with TAL1xLMO1 littermates, we observed an 8-fold reduction in the thymic cellularity in the presence of p16INK4A. We observed 2 different patterns of thymocyte differentiation, probably reflecting the homozygous and heterozygous status for p16INK4A that we could not clearly separate by RQ-PCR. In group 1 (3 mice), the main population was DN with rare DP, CD4 SP, and CD8 SP, whereas in group 2 (3 mice), DP, CD4 SP, and CD8 SP thymocytes were present (Figure 2A). In group 1, the p16TLM thymocyte differentiation was mainly blocked at the DN3 stage (Figure 2B). This immunostaining profile correlated with p16INK4A transgene expression level by RQ-PCR, since p16TLM thymocytes from group 1 expressed 10 times more than in group 2 (Table 1). Individual mice were also tested (group 1, 1 mouse; group 2, 4 mice), showing the same results (not shown). In contrast, endogenous murine p16INK4A gene expression did not vary significantly between the 2 groups (Table 1).
Thymocyte differentiation arrest induced by p16inka in TAL1xLMO1 mice depends on p16INK4A expression level. Example of flow-cytometry analysis of cell-surface markers on TAL1xLMO1xp16inka thymocytes stained with (A) anti-CD4 and anti-CD8 antibodies or (B) anti-CD25 and anti-CD44 gated on CD3−, CD4−, and CD8− cells. Percentages are indicated in the quadrants.
Thymocyte differentiation arrest induced by p16inka in TAL1xLMO1 mice depends on p16INK4A expression level. Example of flow-cytometry analysis of cell-surface markers on TAL1xLMO1xp16inka thymocytes stained with (A) anti-CD4 and anti-CD8 antibodies or (B) anti-CD25 and anti-CD44 gated on CD3−, CD4−, and CD8− cells. Percentages are indicated in the quadrants.
Forced P16INK4A expression inhibits T-ALL development
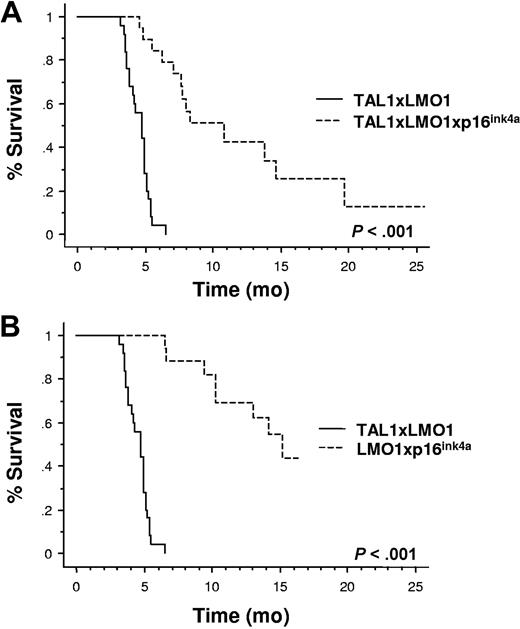
To evaluate the consequences of human p16INK4A expression in tumor protection, we compared the survival rate of p16TLM with that of TAL1xLMO1 littermates.17 Through 2 years of breeding, 25 of 25 TAL1xLMO1 mice developed T-ALL (mean, 4.7 months; range, 3.1-6.5 months; Figure 3A,B). During the same breeding period, we followed 15 p16TLM mice. Two (13%) of 15 mice survived up to 2 years and 13 of 15 developed acute T-cell tumors but with a dramatic delay compared with the TAL1xLMO1 mice (10.6 months; range, 4.5-19.7 months; Figure 3A). Upon dissection, p16TLM mice that developed tumors showed an enlarged thymus that was readily visible inside the rib cage, but lymph nodes (LNs) were not macroscopically invaded as in the TAL1xLMO1 mice17 (not shown). Thus far, T-ALLs that occurred in p16TLM animals were mainly either DP or CD4 SP. All expressed CD3ϵ molecules but variable amounts of CD25 and CD44 molecules (Table 2).
p16INK4A expression inhibits the TAL1xLMO1-induced leukemogenesis. (A) Comparison of tumor susceptibility between TAL1xLMO1 mice (n = 25) and p16TLM mice (n = 15) and (B) between TAL1xLMO1 mice (n = 25) and LMO1xp16INKA mice (n = 23). Kaplan-Meier representations are shown. Survival rates are compared by the log rank test.
p16INK4A expression inhibits the TAL1xLMO1-induced leukemogenesis. (A) Comparison of tumor susceptibility between TAL1xLMO1 mice (n = 25) and p16TLM mice (n = 15) and (B) between TAL1xLMO1 mice (n = 25) and LMO1xp16INKA mice (n = 23). Kaplan-Meier representations are shown. Survival rates are compared by the log rank test.
Tumor development in p16TLM and p16LMO1 mice is associated with P16INK4A loss in leukemic cells
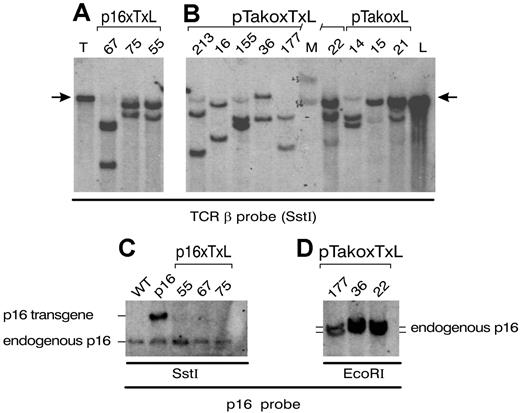
To further analyze the chromosomal events that had occurred in these p16TLM (Figure 4A), TLMpTαko, and LMO1xpTαko tumors (Figure 4B), we first demonstrated that all T-ALL tumors had clonal or oligoclonal TCRβ gene rearrangements. Moreover, Vα-Jα gene segment rearrangements were detected by PCR in 7 of 8 tumors, indicating that 7 tumors had reached at least the DP stage (not shown).
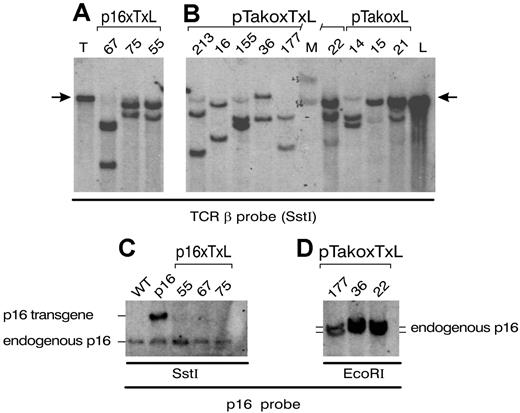
T-ALLs from TAL1xLMO1xp16INK4A mice express clonal TCRβ rearrangements and p16INK4A transgene chromosomal deletion. (A,B) TCRβ rearrangements in tumor DNA from our different models are detected by Southern blot after SstI digestion (1 experiment). Germ line bands are indicated with arrows, and tumor samples are identified using unique sample numbers. The numbers 67, 75, and 55 are p16TLM leukemias; 213, 16, 155, 36, 177, and 22 are TLMpTαko leukemias; and 14, 15, and 21 LMO1 are pTαko leukemias. T indicates tail; L, liver (germ line control); and M, size marker. (C,D) Southern-blot analysis of p16 locus configuration using p16 probe and SstI (C) or EcoRI (D) digests of DNA. (Cross hybridization occurs between human and mouse.) Tumor samples are identified as in panels A and B. DNA from WT, p16 transgenic mice are used as controls. Bands corresponding to the human transgene and to the endogenous locus are shown (1 experiment).
T-ALLs from TAL1xLMO1xp16INK4A mice express clonal TCRβ rearrangements and p16INK4A transgene chromosomal deletion. (A,B) TCRβ rearrangements in tumor DNA from our different models are detected by Southern blot after SstI digestion (1 experiment). Germ line bands are indicated with arrows, and tumor samples are identified using unique sample numbers. The numbers 67, 75, and 55 are p16TLM leukemias; 213, 16, 155, 36, 177, and 22 are TLMpTαko leukemias; and 14, 15, and 21 LMO1 are pTαko leukemias. T indicates tail; L, liver (germ line control); and M, size marker. (C,D) Southern-blot analysis of p16 locus configuration using p16 probe and SstI (C) or EcoRI (D) digests of DNA. (Cross hybridization occurs between human and mouse.) Tumor samples are identified as in panels A and B. DNA from WT, p16 transgenic mice are used as controls. Bands corresponding to the human transgene and to the endogenous locus are shown (1 experiment).
To analyze whether p16TLM mice had developed leukemia because of p16 loss, we analyzed the leukemia DNA by Southern blot. We detected a chromosomal deletion of the human p16INK4A transgene in 3 of 3 p16TLM tumors that were analyzed (Figure 4C). In contrast, the endogenous mouse p16INK4A was still present in the DNA of the 3 tumors tested (Figure 4D).
We then extended the DNA analysis by RQ-PCR measurements to all our p16TLM tumors and to our different mouse models (Table 2). We quantified p16INK4A transgene among 10 p16TLM tumors. Most had undetectable levels of the human p16INK4A transgene, but 2 had high levels (nos. 57 and 76); interestingly, sample 57 had a nucleotide deletion in exon 2, resulting in a frame shift and a premature stop codon (Table 2).
In the 6 p16LMO1 tumors that we analyzed, expression of the human p16 transgene was no longer detectable (below the threshold 10−2; Table 2).
Our results show that expression of the human p16 transgene was undetectable in 80% of the p16TLM tumors (including 1 tumor in which the human p16 transgene was mutant) and in 100% of the p16LMO1 tumors.
CD3ϵ but not pTα is essential for TAL1xLMO1 T-cell differentiation
We have shown that p16INK4A deletion is less frequent in human immature T-ALL and TCRγδ T-ALL.14,26 Human and mouse TAL1/LMO1 tumors develop from cells of the αβ lineage, suggesting that signals transduced by the pre-TCR and/or TCR could play a crucial role in the molecular mechanisms of oncogenesis. In addition, others have shown in mice that TAL1xLMO1 gene expression modulates the expression of pTα mRNA.38 Moreover, while forced TCRαβ or TCRγδ expression can rescue the development of pTα-deficient DP cells,39,29 the absence of the CD3ϵ molecule generates a complete block of the T-cell differentiation at the DN3 stage.36 We asked whether TAL1 and LMO1 oncogenes could induce T-ALL in the absence of the pTα and CD3ϵ molecules that are essential for β selection.
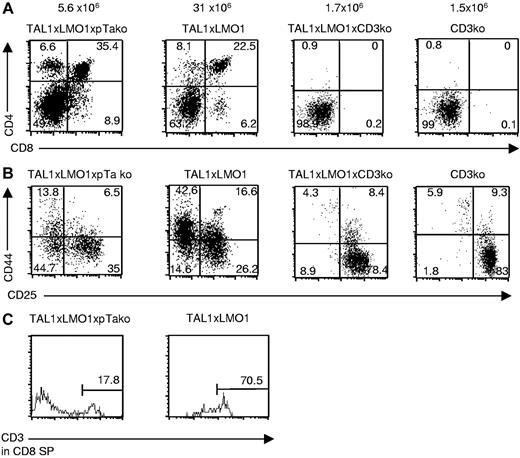
We generated TAL1+/−xLMO1+/−xpTαko mice and TAL1+/−xLMO1+/−xCD3ϵko mice, named TLMpTαko and TLMCD3ϵko, respectively. We observed that thymocyte differentiation was modified in TLMpTαko mice with a reduced number of thymocytes in preleukemic mice compared with TAL1xLMO1 mice. The phenotype analysis showed that the repartition between the various thymocyte subsets did not vary. Some thymocytes could differentiate into DP and SP cells with a normal CD3ϵ surface expression level, although the DN remained dramatically increased (49%), with the presence of the DN1-4 subpopulations (Figure 5A-C). Although it is well known that percentages and even absolute numbers of γδT cells are increased in pTαko mice, here, unexpectedly, the percentage of γδT cells (2%) was 4 times lower in TLMpTαko thymocytes than in TAL1xLMO1 thymocytes (8%; not shown). This result suggests that TAL1/LMO1 expression modifies the γδ/αβ fate in our mice. Cell-cycle analysis in TLMpTαko thymocytes compared with TAL1xLMO1 showed that the absence of pTα chain does not modify the percentage of total thymocytes in S and G2/M phases (not shown). In contrast, when we analyzed T-cell differentiation in 12-week-old TLMCD3ϵko mice, we observed that thymocytes were still blocked at the DN stage (Figure 5A); they were mainly blocked in DN3 (Figure 5B).
CD3ϵ deficiency but not pTα deficiency blocks the TAL1xLMO1 thymocyte differentiation. Example of flow-cytometry analysis of cell-surface markers on TLMpTαko, TAL1xLMO1, and TLMCD3ϵko thymocytes stained with (A) anti-CD4 and anti-CD8 antibodies, (B) anti-CD25 and anti-CD44 gated on CD3−, CD4−, and CD8− cells, or (C) anti-CD3 gated on CD8+CD4− cells. Percentages are indicated in the quadrants.
CD3ϵ deficiency but not pTα deficiency blocks the TAL1xLMO1 thymocyte differentiation. Example of flow-cytometry analysis of cell-surface markers on TLMpTαko, TAL1xLMO1, and TLMCD3ϵko thymocytes stained with (A) anti-CD4 and anti-CD8 antibodies, (B) anti-CD25 and anti-CD44 gated on CD3−, CD4−, and CD8− cells, or (C) anti-CD3 gated on CD8+CD4− cells. Percentages are indicated in the quadrants.
Our results show that the pTα chain is dispensable for TAL1xLMO1 thymocyte differentiation, although it could play a minor role in their resistance to apoptosis since TLMpTαko thymocytes are less numerous than in TAL1xLMO1 mice. In contrast, the CD3ϵ signaling is absolutely crucial for the maturation of TAL1xLMO1 expressing DN3.
The pre-TCRα chain but not the CD3ϵ chain is dispensable for TAL1xLMO1-induced leukemogenesis
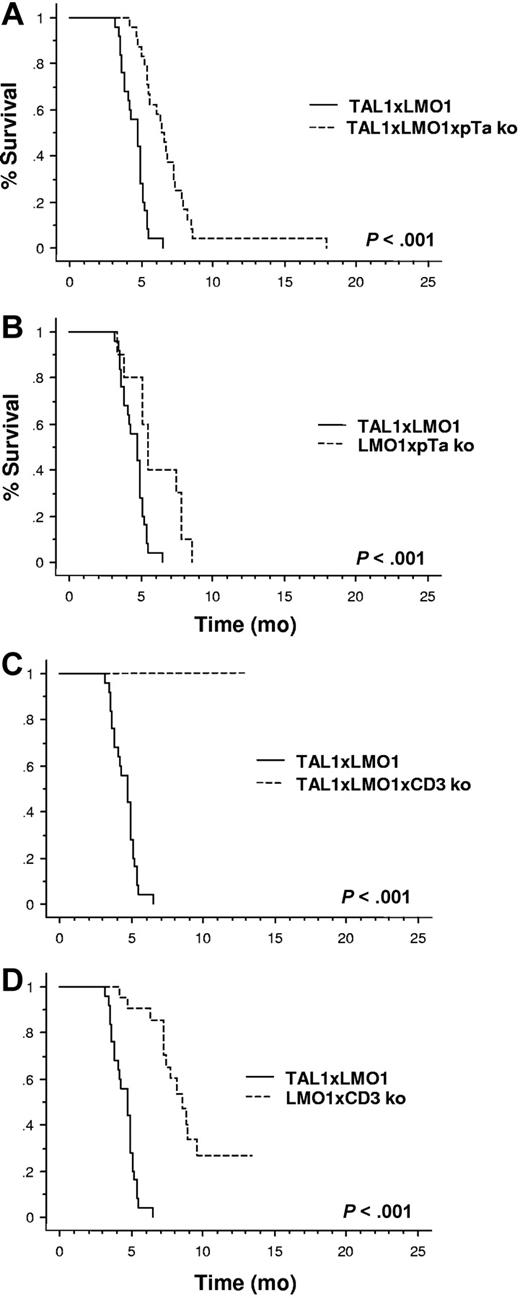
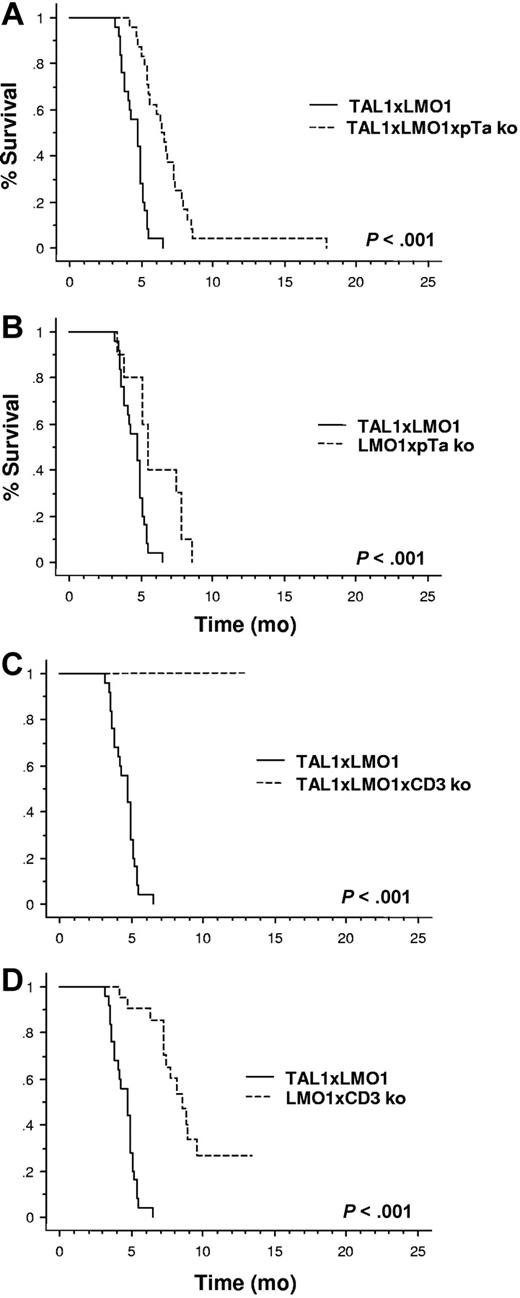
Most T-ALLs appeared later in TLMpTαko mice (24/24 mice; mean, 6.9 months; range, 4.2-8.6 months) than in TAL1xLMO1 mice (mean, 4.7; Figure 6A). Their phenotype was variable in CD4 expression, but most of them expressed the CD8α molecule. In contrast, no T-ALL appeared in 21 TLMCD3ϵko mice up to 12 months (Figure 6B).
CD3ϵ deficiency blocks the TAL1xLMO1-induced leukemogenesis. Comparison of tumor susceptibility between TAL1xLMO1 mice (n = 25) and (A) TLMpTαko mice (n = 24), (B) LMO1pTαko mice (n = 10), (C) TLMCD3ϵko mice (n = 21), and (D) LMO1CD3ϵko mice (n = 21). Kaplan-Meier representations are shown. Survival rates are compared by the log-rank test.
CD3ϵ deficiency blocks the TAL1xLMO1-induced leukemogenesis. Comparison of tumor susceptibility between TAL1xLMO1 mice (n = 25) and (A) TLMpTαko mice (n = 24), (B) LMO1pTαko mice (n = 10), (C) TLMCD3ϵko mice (n = 21), and (D) LMO1CD3ϵko mice (n = 21). Kaplan-Meier representations are shown. Survival rates are compared by the log-rank test.
Unexpectedly, during the same period of time, leukemia developed in mice that did not express the TAL1 transgene, within 10 of 10 LMO1xpTαko mice (mean, 6.0; range, 3.4-8.6 months) and 13 of 21 LMO1xCD3ϵko mice (mean, 7.2 months; range, 4.2-9.6 months; 61.9%; P < .001; Figure 6C, D). The phenotype of the tumors was more immature in LMO1xCD3ϵko mice (7 DP of 8) than in LMO1xpTαko mice, where it was commonly CD8 SP (Table 3).
These data demonstrate that the pTα chain, but not CD3ϵ signaling, is dispensable for TAL1xLMO1 thymocyte oncogenesis and that the presence of the LMO1 gene in the absence of either the pTα chain or the CD3ϵ molecule represents an oncogenic event for immature TCRαβ thymocytes. This suggests that normal T-cell differentiation might proceed through steps that inhibit oncogenic processes linked to LMO1 alone.17,37
Leukemia from LMO1xCD3ϵko showed increased cyclin D3 expression
Abnormal expression of D cyclins is believed to be a driving force in several human cancers such as T-ALL.40,41 Cyclin D3 is expressed in nearly all proliferative cells and is required for the proliferative burst of DN4 normal thymocytes during development. It operates downstream of the pre-TCR and p56LCK, since cyclin D3 expression is induced by anti-CD3ϵ treatment in RAG2ko mice.40
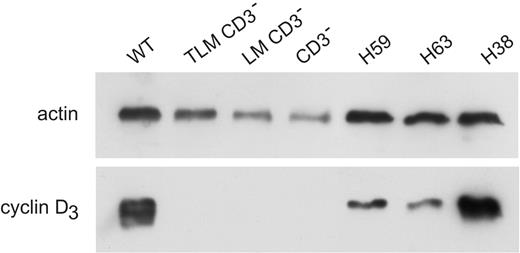
To further explore this notion, we compared cyclin D3 protein levels in the preleukemia and leukemia samples from the LMO1xCD3ϵko model. We found that cyclin D3 protein levels were high in wild-type (WT) thymus but not detectable in CD3ϵko normal thymus or in TLMxCD3ϵko and LMOxCD3ϵko preleukemia thymus samples. In contrast, it was highly expressed in the 3 LMO1xCD3ϵko leukemia samples (Figure 7). Cyclin D3 high expression level was also detected in the leukemia from TAL1xLMO1 and in pTαko-derived models (not shown). These results suggest that a high level of cyclin D3 expression could be driven by the LMO1 gene via a CD3ϵ-independent pathway in LMO1xCD3ϵko thymocytes and could contribute to oncogenesis.
Cyclin D3 levels in preleukemia thymocytes and leukemia. Levels of cyclin D3 were detected by Western blot. Blots were reprobed with antiactin antibody (loading control). Lane 1, WT thymus; lane 2, TLMCD3ϵko; lane 3, LMO1CD3ϵko; lane 4, CD3ϵko thymus; lanes 5-7, leukemia LMO1CD3ϵko H59, H63, and H38.
Cyclin D3 levels in preleukemia thymocytes and leukemia. Levels of cyclin D3 were detected by Western blot. Blots were reprobed with antiactin antibody (loading control). Lane 1, WT thymus; lane 2, TLMCD3ϵko; lane 3, LMO1CD3ϵko; lane 4, CD3ϵko thymus; lanes 5-7, leukemia LMO1CD3ϵko H59, H63, and H38.
T-ALLs from pTαko, p16 transgenic, and CD3ϵko backgrounds show Notch1 mutations
Notch1 gene encodes a regulatory transmembrane receptor that is crucial for the control of normal T-cell differentiation and it is truncated in rare cases of T-ALL (for review see Grabher et al3 ). In recent years, activating Notch1 mutations have been characterized in human and mouse T-ALL.42,,,,,,–49 The study of Notch1 activation through DNA sequencing is currently under process in our models.
To determine whether Notch1 mutations were common in the T-ALL that developed on the preTαko and p16 transgenic background, we tested a subset of the tumors for the presence of Notch1 mutations. We found that, similar to TAL1xLMO1 mice on wild-type background,44 approximately half of the tumors we analyzed had Notch1 mutations (Table S1). These mutations were predicted to truncate and stabilize the ICN protein by removing most of the PEST domain, as has been proposed by others.42,44,45
Discussion
P16INK4A is known to inhibit cyclin D binding on cdk4/cdk6 complexes that inhibit the entry into S phase (for review see Ortega et al29 ). The consequences of the cell-cycle blockade or of other cellular processes induced by p16INK4A expression on the cellular metabolism are not clearly understood and could represent a deleterious event for the oncogene-mediated transformation.
We previously reported that p16INK4A is deleted in the majority of human T-ALL24,26 but in rare cases of human T-ALL that had not deleted the locus, p16INK4A mRNA was highly expressed.26 However, it was not elucidated whether its activation is related to normal thymocyte differentiation or to a response to an oncogenic stress like that observed in the presence of an activated Ras in fibroblasts50,51 or in melanocytes with BRAF, a protein kinase and downstream effector of Ras that induces p16INK4A and senescence.52 By analysis of purified human thymocyte subsets, we showed here that p16INK4A is poorly expressed during normal human thymic differentiation, suggesting that p16INK4A detected in the minority of human and mouse cases of T-ALL may thus be related to an abnormal situation, such as oncogene-induced stress.
We have also shown that the thymocyte differentiation is blocked in a p16INK4A dose dependent in transgenic mice,34 and others have shown that CDKN2 repression is necessary for normal T-cell development.53 We show here that the combination of TAL1 and LMO1 in association with associated events can bypass the thymocyte differentiation arrest due to p16INK4A expression but that overt leukemia occurs only if expression of the CDKN2A transgene is actually suppressed. The consequences of this thymocyte differentiation arrest or accumulation at DN stages during oncogenesis remain hypothetical. The inhibition of differentiation could favor the inhibition of the RAG-dependent T-cell development in pre-β selection stages, favoring the genesis of additional genetic abnormalities or sustained telomerase activity. Among additional events, activation of notch1 found in a number of tumors in our model and which has previously been found in human and mouse T-ALL may play an important role.42,,,,,,–49
In human T-ALL cases, expression of either LMO1 or LMO2 is frequently associated to TAL1 gene expression.12 In mice, expression of TAL1 with either LMO1 or LMO2 induces T-ALL, with no obvious differences between these 2 LMO genes.16,,–19,37
Several groups have shown that in TAL1 transgenic thymocytes, TAL1 and LMO1 genes interfere with the expression of genes such as pre-TCRα, CD3, and TCRα/β chains.38,54,55 In addition, pre-TCR/TCR signaling seems to be required for T-cell transformation in mice.56,57
Since TAL1xLMO1 oncogenes act as suppressor of E-protein activity, the E2Ako mice have been used as a model for T-ALL. However, several differences between the 2 models should be noted. First, it has been shown that pre-TCR signaling promotes survival and expansion of E2Ako leukemia.45 In pTαko mice, αβTCR or γδTCRs expressed in DN3 cells can rescue the development of some DP cells.39,29 In our TLMpTαko model, leukemia development is delayed for 2 months only, which suggests that signaling by the pre-TCR can be partially replaced by other CD3-dependent pathways, likely signaling by αβTCR or γδTCRs expressed at the DN3 stage of development. In line with this hypothesis, we could detect Jα-Cα rearrangements by PCR in the TLMpTαko leukemia, which expressed a lower cell-surface level of CD3ϵ molecules compared with TAL1xLMO1 mice.
Strikingly, in our LMO1xpTαko mouse model, the absence of the pTα chain favors the accumulation of DN3 cells, which are subjected to little or no pre-TCR-mediated signal transduction. This absence of pTα chain could mimic the action of the TAL1 protein when it binds to E2A gene products and blocks their gene targets implicated in differentiation, such as pTα chain. This arrest in DN3 stage could represent a noncycling target for protein complexes containing LMO1 and could allow for T-ALL development that is more efficient in pTαko than with LMO1 gene in the WT background. Furthermore, the pTα deficiency appears to decrease efficiency in survival, since the total cellularity is decreased in TLMpTαko mice compared with TAL1xLMO1 mice, whereas the proportion of cell cycling is not modified.
The CD3ϵ molecule is crucial for normal thymocyte differentiation. It was shown that anti-CD3ϵ antibodies injected into immunodeficient mice, such as Rag2ko, Scid, TCRβko, and Pre-Tαko mice, can trigger efficient expansion and maturation of DN thymocytes and restore early T-cell development.58,,–61 Activated p56LCK is also able to restore DP differentiation into Rag2ko and pTαko mice.61,62 Strikingly, in TLMxCD3ϵko mice where T-cell differentiation remains blocked at DN3 stage, no T-ALL appeared within 1 year. This indicates that TAL1 and LMO1 oncogenes together cannot bypass the CD3ϵ signaling pathway. In contrast, our results with LMO1 gene alone in the absence of the CD3ϵ chain demonstrate that the concomitant absence of TAL1 gene creates a more efficient oncogenic situation, suggesting that in this context, the TAL1 gene has a “protective” effect against transformation. Furthermore, it is likely that normal pre-TCR and/or TCR signal transduction allows the elimination of early transformed thymocytes through processes such as apoptosis that are lost within the CD3ϵ deficiency context. The molecular mechanisms leading to malignant transformation by the LMO1 gene alone in this context remain to be elucidated, but 1 possible mechanism could be that the CD3ϵ pathway up-regulates cyclin D3 expression through p56LCK activation.40
The DNA binding activity of TAL1 is not required to induce leukemia in mice,17,54 although it increases the number of S-phase thymocytes.22 This suggests that the differentiation arrest induced by TAL1 and LMO1 may require additional signals such as those linked to Notch1 activation to rescue thymocyte precursors.42,,–45
In conclusion, we have provided genetic evidence that human p16INK4A gene expression and CD3ϵ gene deficiency dramatically inhibit TAL1xLMO1-induced leukemogenesis in mice, whereas pTα deficiency only modestly delays the onset of leukemia in TAL1xLMO1 mice. Importantly, given the complete block in leukemic transformation seen in the TLMxCD3ϵko mice, the CD3ϵ transduction pathway should be considered as an attractive therapeutic target in patients with T-ALL that express TAL1 and LMO1.
The online version of this article contains a data supplement.
The publication costs of this article were defrayed in part by page charge payment. Therefore, and solely to indicate this fact, this article is hereby marked “advertisement” in accordance with 18 USC section 1734.
Acknowledgments
We thank Dr Jean-Michel Cayuela for helpful discussions, Lucie Hernandez and Irmine Loisel for technical help, and Elisabeth Savariau for the image preparation. We thank the coworkers of the animal experimental facilities (Institut Universitaire d'Hématologie) for their cooperation.
This work was supported by grants from the French Fondation contre la leucémie (FdF 005146; A.R.); the Ligue Nationale Contre le Cancer (CIT II; A.R.); INSERM (A.R., M.F., M.C., F.S.), the Université Denis Diderot Paris 7, and French Fondation contre la leucémie (8DH17H00; F.S.); and the Intramural Research Program of the National Institutes of Health, National Cancer Institute (NIH, NCI; P.D.A.).
Authorship
Contribution: M.F. designed and performed research, analyzed data, and wrote part of the first draft of the paper; P.D.A. designed and performed research and analyzed data; M.C. followed the disease in mice; N.B. performed statistical analysis; J.-C.B. and H.v.B. analyzed data; J.S. analyzed aCGH experiments; F.S. initiated the study and analyzed microarray expression data; and A.R. designed and performed research, analyzed data, and wrote the final draft of the paper.
Conflict-of-interest disclosure: The authors declare no competing financial interests.
Correspondence: A. Regnault, INSERM U462, Institut Universitaire d'Hématologie, Hôpital Saint-Louis, 1 avenue Claude Vellefaux, 75010 Paris, France; e-mail:armelle.regnault@wanadoo.fr.

