Abstract
We obtained a global view of gene expression in both cell lines and pediatric acute lymphoblastic leukemia (ALL) samples that harbor one of several selected chromosomal abnormalities. When the cell lines were studied alone, we found that these chromosomal abnormalities were associated with the predominant variation in transcriptional programs across the set of cell lines studied. When cell lines and clinical samples were studied together, we found that each chromosomal abnormality (TEL/AML1, BCR/ABL, or MLL abnormalities) was associated with a characteristic gene expression signature that was shared by both cell lines and clinical samples. However, BCR/ABL was associated with a much more heterogeneous pattern of expression than were TEL/AML1 and MLL abnormalities. This observation has important implications for the study of BCR/ABL ALL. In addition, we systematically identified genes whose expression was associated with TEL/AML1, BCR/ABL, or MLL abnormalities in both clinical samples and cell lines. Although some of these genes have previously been described, many have not previously been reported to be associated with one of these chromosomal abnormalities. Notably, we found that the erythropoietin receptor (EPOR) is consistently highly expressed in TEL/AML1 ALL compared with BCR/ABL or MLL. (Blood. 2004;103:1043-1049)
Introduction
Acute lymphoblastic leukemia (ALL) is diagnosed in approximately 4000 individuals each year in the United States1 and is the most common malignancy in childhood.2 Major advances have been made in the treatment of childhood ALL in the past several decades. In part, these advances have relied on risk-stratified treatment, guided by prognostic factors identified at diagnosis. In particular, important prognostic information is provided by the identification of recurrent chromosomal translocations. In addition to being prognostically informative, these translocations may also identify subtypes of ALL with distinct mechanisms of leukemogenesis. This notion is supported by recent studies that have identified gene expression patterns associated with particular chromosomal translocations in ALL. One study3 compared the gene expression patterns in clinical samples harboring an MLL abnormality with an otherwise uncharacterized collection of ALL and acute myelogenous leukemia (AML) samples. That study identified a number of genes associated with MLL ALL. Another study4,5 surveyed the gene expression patterns in a large collection of childhood ALL samples, including patients with a variety of different chromosomal translocations. The analysis of this data set focused primarily on identifying a relatively small number of genes that could be used to identify clinically important subtypes of childhood ALL.
We hypothesized that the distinct mechanisms of leukemogenesis that may be associated with different chromosomal translocations would be reflected in distinct patterns of gene expression that are shared by both clinical samples and cell lines with the same translocation. To test this hypothesis, we used cDNA microarrays to determine the gene expression patterns in both ALL samples and cell lines with selected chromosomal translocations. Our study expands on the already published studies in 3 ways: by studying both patient samples and cell lines, by using a different microarray platform that surveys approximately 43 000 features representing approximately 31 000 genes, and by using both unsupervised and supervised data analysis approaches that are different from those used in published studies of ALL.
Our study provides a global view of gene expression patterns in both cell lines and pediatric ALL samples. Our data confirm many of the genes that have been previously reported to be associated with TEL/AML1, BCR/ABL, or MLL abnormalities.3-5 More important, a number of features readily emerge from our analysis of the data that were not immediately apparent in previous studies of gene expression in ALL. We present 2 examples of such features. First, we find that BCR/ABL is associated with a more heterogeneous pattern of gene expression than are TEL/AML1 or MLL abnormalities. This observation has important implications for the future study of patients with BCR/ABL ALL. Second, we identify many genes associated with particular chromosomal abnormalities that were not readily identified in previous studies. An example of such a gene is the erythropoietin receptor (EPOR), which is consistently highly expressed in TEL/AML1-positive samples. We speculate that EPOR may play a critical role in the development of TEL/AML1- positive ALL.
Materials and methods
Patients and identification of chromosomal translocations
Informed consent was obtained from the guardians of all patients. Clinical samples were obtained from bone marrow aspirations from patients, prior to initiation of treatment, who were enrolled in Berlin-Frankfurt-Münster (BFM)-ALL protocols. Mononuclear cells were isolated from the bone marrow aspirate using Ficoll-Paque (Pharmacia, Uppsala, Sweden). The cells were placed in RPMI 1640 with 10% heat-inactivated fetal calf serum, penicillin (100 U/mL), streptomycin (100 μg/mL), l-glutamine (2 mM) and 10% dimethyl sulfoxide (DMSO) and frozen in liquid nitrogen for long-term storage. A sample from each bone marrow aspiration was sent to a central cytogenetics laboratory (Giessen, Germany) where each sample was tested6 for the presence of BCR/ABL, TEL/AML1, and MLL/AF4 by polymerase chain reaction (PCR). Positive results were confirmed by fluorescence in situ hybridization (FISH). From the stored BFM samples, 38 samples were identified that contained more than 85% blasts and were positive for BCR/ABL, TEL/AML1,or MLL/AF4. Of these samples, we were successful in obtaining array data on 35 samples. Patient characteristics are shown in Table 1. In addition to the samples used for the microarray measurements, for Taqman PCR measurements, we identified an independent set of 20 TEL/AML1-positive samples and 20 samples negative for TEL/AML1, BCR/ABL, and MLL/AF4. These samples all had more than 80% blasts and a sufficient volume of cDNA to attempt Taqman PCR measurement. Relevant patient characteristics are shown in the Supplemental Materials on the Blood website; see the Supplemental Materials link at the top of the online article.
Cell lines
We selected human leukemia cell lines that contain a balanced chromosomal translocation that is recurrently found in ALL. The characteristics of the cell lines are shown in the Supplemental Materials. The cells were grown in complete RPMI 1640 (Cellgro, Herndon, VA), 15% heat inactivated fetal calf serum (Sigma, St Louis, MO) with amphotericin B (0.125 μg/mL; Sigma), gentamicin (200 μg/mL; Sigma), penicillin (100 U/mL), streptomycin (100 μg/mL), l-glutamine (2 mM) (supplied as penicillin, streptomycin, glutamate [PSG]; Omega Scientific, Tarzana, CA), insulin (5 μg/mL), transferrin (5 μg/mL), and selenium (5 ng/mL) (supplied as ITS; Gibco-BRL, Carlsbad, CA) at 37°C and 5% CO2.
RNA isolation
Total RNA was isolated from cell lines and clinical samples using Trireagent (Molecular Research Center, Cincinnati, OH) or Trizol (Gibco-BRL) according to the manufacturer's protocol. PolyA RNA was isolated from total RNA using FastTrack (Invitrogen, Carlsbad, CA) according to the manufacturer's protocol.
Gene expression measurements
All protocols are posted at http://cmgm.stanford.edu/pbrown/protocols/index.html. Microarrays were produced as previously described.7 We labeled the sample RNA and reference RNA with different fluorescent dyes (cyanin 5 deoxyuridine triphosphate [Cy5-dUTP] and Cy3-dUTP; Amersham, Piscataway, NJ) and comparatively hybridized them to an array. The reference RNA was a pooled mixture of RNA obtained from multiple different cell lines.
Two distinct microarray data sets were obtained. The first set consisted of microarray data for polyA RNA samples from each of the cell lines. For this set of samples, we used reference RNA that has been described previously8 and microarrays with approximately 24 000 elements representing approximately 19 000 genes (NCBI Unigene Build no. 160). The second data set consisted of microarray data for total RNA samples from all of the clinical samples and a representative set of 7 cell lines. Each of these total RNA samples was linearly amplified by using a protocol based on Wang et al.9 The reference RNA used for all of the arrays in this data set was Universal Human Reference total RNA (Stratagene, La Jolla, CA) that was linearly amplified using the same protocol. For this set of samples, we used microarrays containing approximately 43 000 features representing approximately 31 000 genes.
The fluorescence intensities of Cy5 and Cy3 on each array were measured by using a GenePix 4000 scanner (Axon Instruments, Foster City, CA). Images were analyzed by using GenePix Pro 3.0 software (Axon Instruments) to semiautomatically identify and quantify hybridization to the cDNA spots on the microarrays. Any areas of the microarrays with obvious blemishes were manually omitted from subsequent analysis. Spots were considered well measured only if the reference RNA fluorescent intensity was more than 3 times the local background and the regression correlation was more than 0.6. Any clone that was not well measured on at least 80% of the arrays was excluded from subsequent analysis. For each array, we used a scaling factor to set the mean sample-reference ratio for all well-measured spots to one. For all subsequent analysis, we used log2 of this normalized sample-reference ratio. We then centered the data for each clone so that its mean was zero. To analyze the data in an unsupervised manner, we used agglomerative hierarchical clustering.10 In the supervised analysis of the data, we used significance analysis of microarrays (SAM).11 We also used prediction analysis of microarrays (PAM)12 to identify genes that may be used to classify ALL samples as BCR/ABL, TEL/AML1,or MLL. We estimated the misclassification error for this classifier by using 10-fold cross-validation as described.12 Primary data are publicly available through the Stanford Microarray Database: (http://genome-www5.stanford.edu/cgi-bin/SMD/listMicroArrayData.pl?tableName=publication). Supplemental materials may be explored interactively at http://microarray-pubs.stanford.edu/all/.
Quantitative reverse transcription (RT)-PCR
We used random hexamer priming and either Superscript I (Invitrogen) or Taqman RT (Applied Biosystems, Foster City, CA) to generate cDNA. The Taqman probe and primers used to measure EPOR RNA abundance have been published.13 The forward primer was 5′-GCT CCC TTT GTC TCC TGC T-3′. The reverse primer was 5′-CTC CCA GAA ACA CAC CAA GTC CT-3′. The Taqman probe was 6FAM-AGC GGC CTT GCT GGC GG-TAMRA (Applied Biosystems). Cyclophilin A (CYCA; Applied Biosystems) was used as an endogenous control. The quantitative PCR reactions were performed in a total volume of 20 μL, containing 10μL TaqMan Universal PCR Master Mix (Applied Biosystems), 200 nM forward and reverse primers, 100 nM Taqman probe, and 5 μL cDNA. The reactions were carried out on an ABI Prism 7700 Sequence Detection System (Applied Biosystems), using the following temperature program: 50°C for 2 minutes, 95°C for 4 minutes then 40 cycles of 95°C for 15 seconds and 60°C for 1 minute. In the same reaction plate as the samples, quantitative PCR reactions were carried out on a dilution series of cDNA obtained from the cell line K562. The data from this dilution series were used to construct calibration curves for both EPOR and the endogenous control gene CYCA. These calibration curves were used to assign an expression level of EPOR and CYCA for each of the samples tested. Using these values, we calculated the EPOR/CYCA ratio.
Flow cytometry
A sample from each bone marrow aspiration was sent to a central laboratory (Oncogenetics Laboratory, Children's University Hospital, Berlin, Germany) where flow cytometry was performed as previously described.14,15 CD20 surface expression was considered positive if at least 20% of the leukemic cells had a fluorescence intensity more than 98% of the negative control cells.
Results
Overview of gene expression patterns
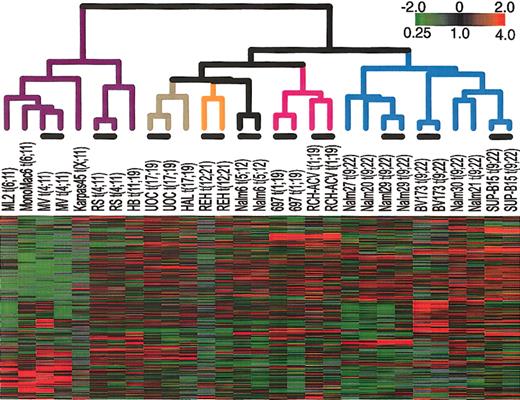
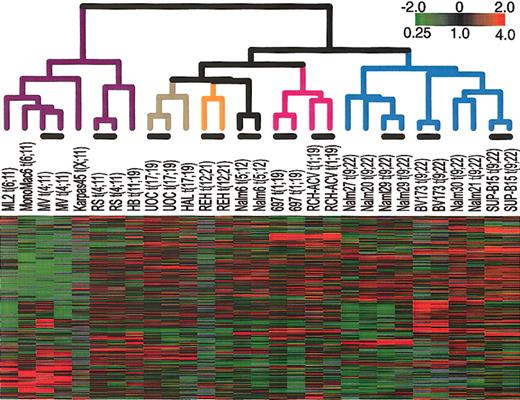
First, we examined the gene expression patterns in a set of cell lines that each harbors a chromosomal translocation common in ALL. Figure 1 shows the result of hierarchical clustering of the cell lines on the basis of their similarity in gene expression. To confirm the reproducibility of the array measurements, we used duplicate arrays to determine the gene expression profile of each of 9 cell lines. Further description of these duplicate measurements is contained in the Supplemental Materials. For all cell lines tested, duplicate arrays cluster side by side, confirming the reproducibility of this method. This hierarchical clustering shows that cell lines cluster according to the chromosomal translocation that they contain. In particular, all t(9;22)-containing cell lines clustered together, and all cell lines that have an MLL abnormality clustered together. Smaller numbers of other cell lines also clustered in sets that shared a common translocation.
Agglomerative hierarchical clustering according to similarity in gene expression patterns in cell lines harboring translocations that are common in ALL. For each cell line, polyA-purified RNA and common reference polyA RNA8 were fluorescently labeled (with Cy5- or Cy3-dUTP) and comparatively hybridized to an array containing approximately 24 000 elements representing approximately 19 000 genes (NCBI Unigene Build no. 160). The variation in expression is displayed as a variation in color10 for the 331 clones (306 genes) for which the log2 intensity ratio differed by at least 2 from its mean on at least 2 arrays. The color scale extends from 0.25- to 4.0-fold of the mean (-2 to 2 in log2 space) as indicated in the upper-right corner. Gray represents data that was omitted because it was not well measured as described in “Materials and methods.” The black bars indicate duplicate measurements of the same cell line. The arms of the dendrogram are color-coded to indicate the chromosomal translocation associated with each branch: purple indicates MLL; brown, t(17;19); orange, t(12;21); black, t(5;12); pink, t(1;19); and blue, t(9;22). The broad features of the clustering patterns were robust to variations in gene selection criteria.
Agglomerative hierarchical clustering according to similarity in gene expression patterns in cell lines harboring translocations that are common in ALL. For each cell line, polyA-purified RNA and common reference polyA RNA8 were fluorescently labeled (with Cy5- or Cy3-dUTP) and comparatively hybridized to an array containing approximately 24 000 elements representing approximately 19 000 genes (NCBI Unigene Build no. 160). The variation in expression is displayed as a variation in color10 for the 331 clones (306 genes) for which the log2 intensity ratio differed by at least 2 from its mean on at least 2 arrays. The color scale extends from 0.25- to 4.0-fold of the mean (-2 to 2 in log2 space) as indicated in the upper-right corner. Gray represents data that was omitted because it was not well measured as described in “Materials and methods.” The black bars indicate duplicate measurements of the same cell line. The arms of the dendrogram are color-coded to indicate the chromosomal translocation associated with each branch: purple indicates MLL; brown, t(17;19); orange, t(12;21); black, t(5;12); pink, t(1;19); and blue, t(9;22). The broad features of the clustering patterns were robust to variations in gene selection criteria.
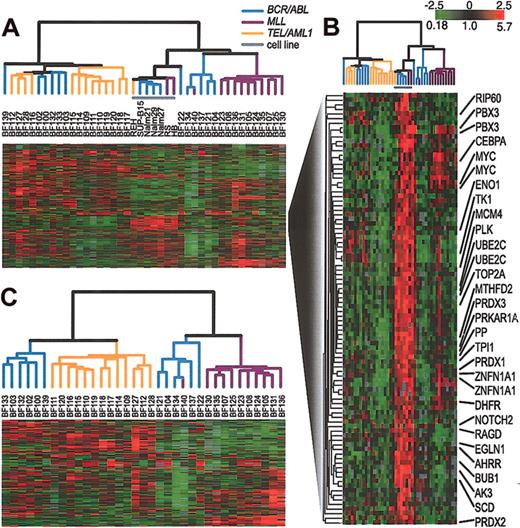
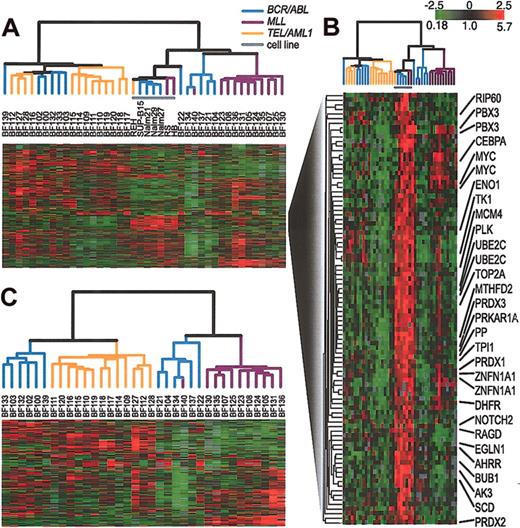
Next, we compared the gene expression patterns in a representative set of cell lines with those in pediatric ALL samples. Again, by hierarchical clustering, all duplicate arrays clustered side by side (data not shown). A description of these duplicate measurements is contained in the Supplemental Materials. In all subsequent analyses, we combined duplicate measurements, using their mean gene expression level. When the samples were analyzed by hierarchical clustering on the basis of their pattern of expression, the cell lines clustered closely together, distinct from the clinical samples as shown in Figure 2A. The cell line cluster is distinguished from the clinical samples principally by its relatively high expression of a large set of proliferation-related (mostly cell-cycle regulated) genes, as shown in Figure 2B. The result of hierarchical clustering of the clinical samples alone, without the inclusion of any cell lines, is shown in Figure 2C. Figures 2A and 2C both show the same general relationship among the clinical samples. Specifically, both figures show that the clinical samples fall into 2 major clusters. One cluster contains all of the TEL/AML1 samples and the other contains all of the MLL/AF4 samples. BCR/ABL samples, in contrast, are included in both large clusters, demonstrating that there is greater heterogeneity in the gene expression patterns in these leukemias compared with the TEL/AML1 and MLL/AF4 leukemias.
Agglomerative hierarchical clustering according to similarity in gene expression patterns in 35 clinical samples and 7 representative cell lines harboring BCR/ABL, TEL/AML1, or an MLL abnormality. For each cell line and clinical sample, total RNA and reference total RNA (Universal Human Reference; Stratagene) were treated with DNase (DNA-free; Ambion, Austin, TX), linearly amplified, fluorescently labeled (with Cy5- or Cy3-dUTP) and comparatively hybridized to an array containing approximately 43 000 features representing approximately 31 000 unique UniGene clusters. This data set was obtained by using 2 distinct array batches that were produced using 2 different batches of PCR amplifications of the clone inserts. The data for each gene was mean centered by batch. A list of arrays used and the batches to which they belong is contained in the Supplemental Materials. We replaced the gene expression levels obtained from duplicate arrays by their mean expression level. (A) The variation in expression is displayed as a variation in color10 for the 844 clones (representing 758 genes) for which the log2 intensity ratio differed by at least 2 from its mean on at least 2 arrays. The color scale extends from 0.18-fold to 5.7-fold of the mean (-2.5 to 2.5 in log2 space) as indicated in the upper-right corner. Gray represents omitted data. The arms of the dendrogram are color-coded to indicate the chromosomal translocation associated with each branch: purple indicates MLL; orange, TEL/AML1; and blue, BCR/ABL. The gray bar indicates data obtained from cell lines. (B) A subset of genes from panel A that are highly expressed in cell lines. Gene names are provided for selected named clones. (C) Clustering of the 35 clinical samples shown in panel A. The variation in expression is displayed for the 272 clones (representing 255 genes) for which the log2 intensity ratio differed by at least 2 from its mean on at least 3 arrays. The broad features of the clustering patterns were robust to variations in gene selection criteria.
Agglomerative hierarchical clustering according to similarity in gene expression patterns in 35 clinical samples and 7 representative cell lines harboring BCR/ABL, TEL/AML1, or an MLL abnormality. For each cell line and clinical sample, total RNA and reference total RNA (Universal Human Reference; Stratagene) were treated with DNase (DNA-free; Ambion, Austin, TX), linearly amplified, fluorescently labeled (with Cy5- or Cy3-dUTP) and comparatively hybridized to an array containing approximately 43 000 features representing approximately 31 000 unique UniGene clusters. This data set was obtained by using 2 distinct array batches that were produced using 2 different batches of PCR amplifications of the clone inserts. The data for each gene was mean centered by batch. A list of arrays used and the batches to which they belong is contained in the Supplemental Materials. We replaced the gene expression levels obtained from duplicate arrays by their mean expression level. (A) The variation in expression is displayed as a variation in color10 for the 844 clones (representing 758 genes) for which the log2 intensity ratio differed by at least 2 from its mean on at least 2 arrays. The color scale extends from 0.18-fold to 5.7-fold of the mean (-2.5 to 2.5 in log2 space) as indicated in the upper-right corner. Gray represents omitted data. The arms of the dendrogram are color-coded to indicate the chromosomal translocation associated with each branch: purple indicates MLL; orange, TEL/AML1; and blue, BCR/ABL. The gray bar indicates data obtained from cell lines. (B) A subset of genes from panel A that are highly expressed in cell lines. Gene names are provided for selected named clones. (C) Clustering of the 35 clinical samples shown in panel A. The variation in expression is displayed for the 272 clones (representing 255 genes) for which the log2 intensity ratio differed by at least 2 from its mean on at least 3 arrays. The broad features of the clustering patterns were robust to variations in gene selection criteria.
BCR/ABL ALL has a more heterogeneous pattern of gene expression than ALL with TEL/AML1 or MLL/AF4
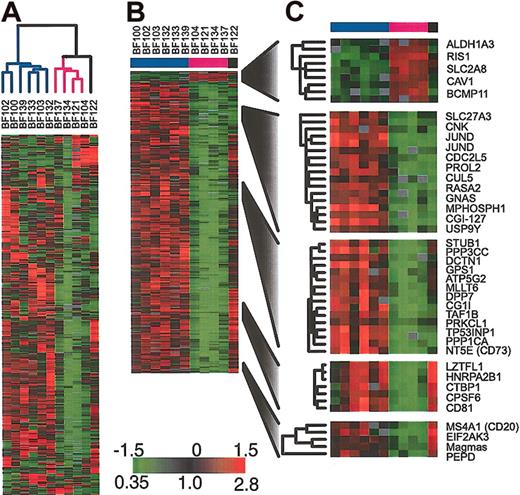
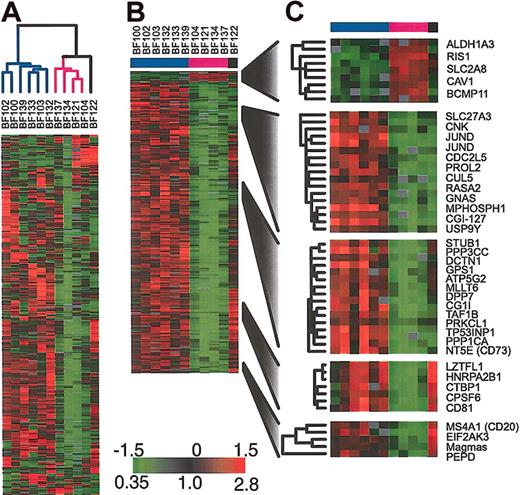
To further investigate the heterogeneity in gene expression in the BCR/ABL samples, we applied hierarchical clustering to these samples alone. As shown in Figure 3A, this analysis identifies the same BCR/ABL clusters that are observed when all clinical samples and cell lines are included. In particular, we find 2 major clusters of samples. We used SAM11 to identify those genes whose expression was consistently different between the 2 clusters of BCR/ABL ALL samples. The sample BF122 could not be readily assigned to either of the 2 groups of BCR/ABL ALL and so it was excluded from this analysis. The results are shown in Figure 3B-C. Among the genes that we found to be statistically significantly differentially expressed in the 2 groups was CD20. Although CD20 was not the gene that most strongly distinguished the 2 clusters, it has the advantage of being routinely measured by flow cytometry on diagnostic ALL bone marrow samples.
Gene expression patterns in the subset of patients harboring BCR/ABL (A) Agglomerative hierarchical clustering according to similarity in gene expression patterns. The variation in expression is displayed for the 500 clones (463 genes) for which the log2 intensity ratio differed by at least 1.5 from its mean on at least 2 arrays. The broad features of the clustering patterns were robust to variations in gene selection criteria. (B) SAM identifies genes whose expression is statistically different in the 2 groups of BCR/ABL samples (338 clones representing 314 genes, 1000 permutations, median false significant clones = 2.8), (C) selected genes identified by SAM.
Gene expression patterns in the subset of patients harboring BCR/ABL (A) Agglomerative hierarchical clustering according to similarity in gene expression patterns. The variation in expression is displayed for the 500 clones (463 genes) for which the log2 intensity ratio differed by at least 1.5 from its mean on at least 2 arrays. The broad features of the clustering patterns were robust to variations in gene selection criteria. (B) SAM identifies genes whose expression is statistically different in the 2 groups of BCR/ABL samples (338 clones representing 314 genes, 1000 permutations, median false significant clones = 2.8), (C) selected genes identified by SAM.
We found reasonable concordance between the CD20 gene expression level as measured by microarrays and the CD20 protein expression level as measured by flow cytometry in the 10 patients for whom we had data (see Supplemental Materials). Because the median follow-up for the patients who contributed BCR/ABL samples was less than 3 years, we could not determine from these patients if the 2 clusters of BCR/ABL patients have different clinical outcomes. However, we were able to obtain outcome data for a set of childhood BCR/ABL patients with longer follow-up. We identified 65 BCR/ABL-positive patients who were enrolled in either BFM-ALL 90 (n = 26) or BFM-ALL 95 (n = 39) trials for whom CD20 was measured by flow cytometry. There was no difference in event-free survival (log-rank P = .7) or overall survival (log-rank P = .3) among those patients with CD20-negative leukemia (n = 28) compared with those with CD20-positive leukemia (n = 37).
Identification of genes whose expression is associated with TEL/AML1, BCR/ABL,or MLL abnormalities
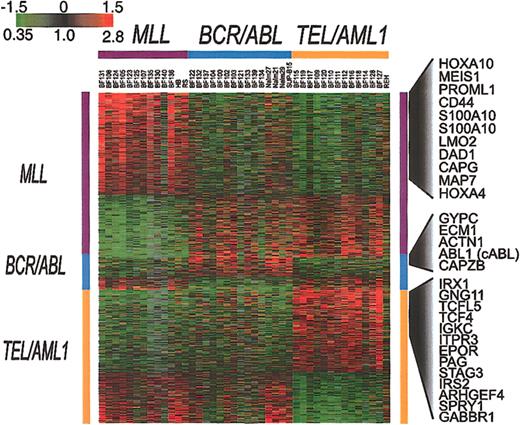
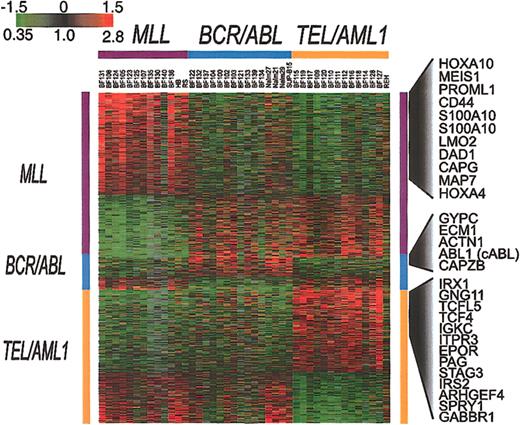
To identify genes whose pattern of variation in expression in clinical samples parallels that seen among cell lines harboring the same translocations, we used SAM11 to analyze the results for all of the clinical samples and cell lines. This approach identified 901 clones representing 844 genes (1000 permutations, delta = 0.34, median false significant clones = 3.1) whose expression is consistently associated with either TEL/AML1 (363 clones representing 323 genes), MLL (449 clones representing 437 genes), or BCR/ABL (89 clones representing 84 genes). The results of this analysis are shown in Figure 4. That BCR/ABL leukemias show relatively few consistent features in their expression patterns further confirms the heterogeneous nature of gene expression in this subset of ALL.
Genes whose expression is associated with BCR/ABL, TEL/AML1, or an MLL abnormality. SAM was applied to all well-measured clones for the set of 35 clinical samples and 7 cell lines that are shown in Figure 2. This analysis identified 901 clones, representing 844 genes (1000 permutations, delta = 0.34, median false positive = 3.1) associated with BCR/ABL, TEL/AML1, or an MLL abnormality. Each of the clones identified by this analysis was classified as being associated with one of these 3 chromosomal abnormalities. The clones were then ordered according to this classification.
Genes whose expression is associated with BCR/ABL, TEL/AML1, or an MLL abnormality. SAM was applied to all well-measured clones for the set of 35 clinical samples and 7 cell lines that are shown in Figure 2. This analysis identified 901 clones, representing 844 genes (1000 permutations, delta = 0.34, median false positive = 3.1) associated with BCR/ABL, TEL/AML1, or an MLL abnormality. Each of the clones identified by this analysis was classified as being associated with one of these 3 chromosomal abnormalities. The clones were then ordered according to this classification.
The genes identified by this analysis may provide clues to the mechanisms of leukemogenesis that are associated with these different fusion proteins. The full list of genes identified by this analysis is available in the Supplemental Materials. As an example, Figure 4 shows some of the genes whose expression is increased in association with 1 of the 3 chromosomal abnormalities.
Another way to test whether cell lines and clinical samples with the same translocation share a common gene expression signature is to remove the consistent gene expression differences that distinguish cell lines from clinical samples and then to use unsupervised hierarchical clustering to organize the cell lines and clinical samples. To minimize the effect of this cell line-specific gene expression signature, we centered the expression measurements for each gene separately for the cell lines and for the clinical samples by subtracting the mean value for each group. As shown in the Supplemental Materials, after this transformation, hierarchical clustering shows that the general relationship among the clinical samples remains the same as shown in Figure 2. However, now the cell lines all cluster with clinical samples that share the same class of chromosomal abnormality, demonstrating that they also share a common gene expression signature.
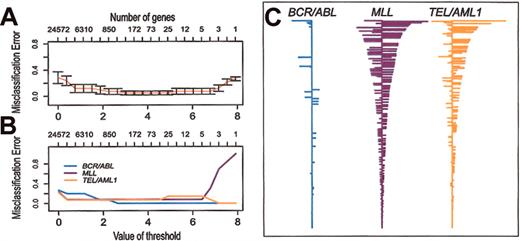
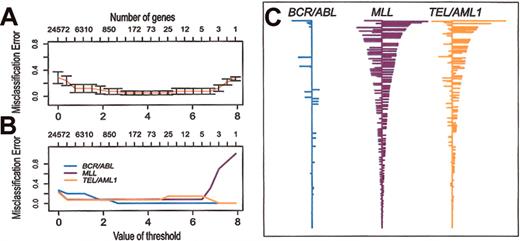
PAM has been developed to identify a relatively small set of genes that define a distinctive molecular signature for distinct classes (eg, subtypes of cancer). Soft thresholding is used to adjust the number of genes that comprise the signatures. Then, using 10-fold cross-validation, the accuracy of the classifiers is tested over the range of possible thresholds. We used PAM to identify signature gene expression profiles for the 3 different subtypes of ALL included in our study. As shown in Figure 5, with cross-validation, 40 (95%) of the 42 samples are correctly classified over a broad range of thresholds. Over this range of thresholds, the BCR/ABL classifier has very few non-zero genes compared with TEL/AML1 or MLL. As an example, Figure 5C shows the classifiers obtained with threshold = 3.0. This indicates that BCR/ABL ALL has very few genes with a consistent pattern of expression, again confirming that BCR/ABL is a more heterogeneous subtype of ALL than TEL/AML1 or MLL. The genes that comprise these classifiers are listed in Supplemental Materials.
Prediction analysis of microarrays (PAM) applied to the data set of clinical samples and representative cell lines. Misclassification errors were determined by using 10-fold cross-validation, as described previously.12 (A) Misclassification error of the expression signatures (shrunken centroids) as a function of the number of genes used in the classifier. (B) Misclassification error of the expression signatures (shrunken centroids) for each of 3 subtypes of ALL as a function of the number of genes used in the classifier. (C) Expression signatures (shrunken centroids) for the 3 different subtypes using a threshold = 3.0 (270 clones representing 235 genes).
Prediction analysis of microarrays (PAM) applied to the data set of clinical samples and representative cell lines. Misclassification errors were determined by using 10-fold cross-validation, as described previously.12 (A) Misclassification error of the expression signatures (shrunken centroids) as a function of the number of genes used in the classifier. (B) Misclassification error of the expression signatures (shrunken centroids) for each of 3 subtypes of ALL as a function of the number of genes used in the classifier. (C) Expression signatures (shrunken centroids) for the 3 different subtypes using a threshold = 3.0 (270 clones representing 235 genes).
EPOR is consistently highly expressed in TEL/AML1 ALL
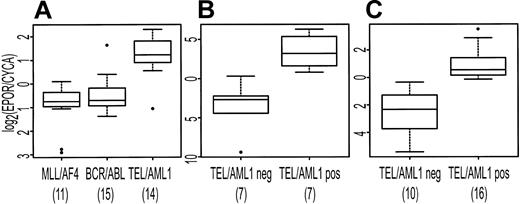
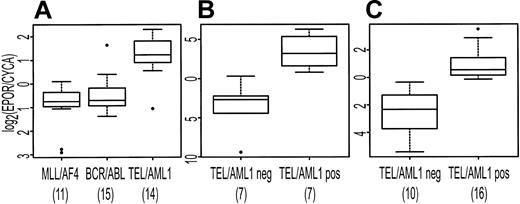
EPOR was identified by both SAM and PAM as characteristically expressed in association with TEL/AML1. To confirm that EPOR was more highly expressed in the TEL/AML1 subtype, we used the Taqman PCR assay to measure EPOR abundance in the available samples used to generate the array data and in an independent set of pre-B ALL samples. In the independent sample set, 16 TEL/AML1-positive and 10 TEL/AML1-negative samples had detectable levels of the endogenous control gene, CYCA, and were included in subsequent analysis. There was no sample that had detectable EPOR but not CYCA. Figure 6 shows the expression of EPOR (relative to CYCA) in both the original set of patients (Figure 6A-B) and in the independent set of samples (Figure 6C). There is a statistically significant difference in EPOR expression in TEL/AML1-positive samples compared with TEL/AML1-negative samples in both sample sets (t test P < .001).
Distribution of expression of EPOR (relative to CYCA) displayed as box plots. The upper and lower boundaries of each box represent the interquartile range (IQR, the range between 25th and 75th percentiles), and the line in the middle of each box represents the median. Values 1.5 × IQR above the 75th or below the 25th percentile are plotted individually as small circles. The numbers under the data labels indicate the number of samples in each group. (A) Expression data from microarrays. (B-C) Results from Taqman RT-PCR for EPOR in TEL/AML1-positive samples compared with TEL/AML1-negative samples. (B) Displays results for available samples included in panel A. (C) Display of the results for an independent set of patient samples.
Distribution of expression of EPOR (relative to CYCA) displayed as box plots. The upper and lower boundaries of each box represent the interquartile range (IQR, the range between 25th and 75th percentiles), and the line in the middle of each box represents the median. Values 1.5 × IQR above the 75th or below the 25th percentile are plotted individually as small circles. The numbers under the data labels indicate the number of samples in each group. (A) Expression data from microarrays. (B-C) Results from Taqman RT-PCR for EPOR in TEL/AML1-positive samples compared with TEL/AML1-negative samples. (B) Displays results for available samples included in panel A. (C) Display of the results for an independent set of patient samples.
We found a similar difference in expression of EPOR in the publicly available data from Yeoh et al.4 For the probe set 1087_at, representing human erythropoietin receptor mRNA, complete cds, the average intensity difference for TEL/AML1-positive samples (n = 79) is (1.9 ± 0.2 × 10³ [mean ± SEM]), and for TEL/AML1-negative samples (n = 256) it is (-0.30 ± 0.08 ×10³), a statistically significant difference (t test P = 4 × 10-15). This difference is confirmed by the Supplemental Information to Ross et al,5 in which EPOR appears in the list of 100 probe sets associated with TEL/AML1.
Discussion
This study provides a global view of gene expression patterns in ALL cell lines and clinical samples that have selected chromosomal abnormalities. When the cell lines were hierarchically clustered on the basis of similarity in gene expression, they clustered according to their chromosomal translocation. This observation supports the idea that the presence of particular chromosomal translocations defines a distinct molecular subtype of ALL. It is interesting that the cell lines did not cluster primarily according to other well-recognized heterogeneous features. For example, the cell lines have heterogeneity with respect to immunophenotype and expression of myeloid markers, but neither of these features was more important than chromosomal translocation in determining the gene expression pattern.
In comparison to cell lines alone, the gene expression patterns observed when clinical samples and cell lines are studied together are somewhat more complex. We find that cell lines exhibit a characteristic pattern of gene expression that distinguishes them from their clinical counterparts, most notably the much higher level of expression of genes involved in cell proliferation. These differences between cell lines and clinical samples should be borne in mind when cell lines are used as models for ALL. Nevertheless, when this cell line-specific signature is minimized, it becomes clear that cell lines and clinical samples with the same chromosomal abnormality share a characteristic gene expression pattern.
Anotable feature in the global view of gene expression in the clinical samples was the relative heterogeneity in the gene expression patterns of the BCR/ABL samples. It is interesting to note that the BCR/ABL translocation results in the production of a novel tyrosine kinase, whereas the TEL/AML1 and MLL/AF4 translocations result in the production of novel transcription factors. Consequently, TEL/AML1 and MLL/AF4 may be expected to have a more direct effect on gene expression than BCR/ABL. The heterogeneous pattern of gene expression in BCR/ABL ALL may reflect the less direct, and perhaps more context dependent, effect of BCR/ABL on gene transcription programs. An alternative explanation is that TEL/AML1 and MLL/AF4 may each require a relatively restricted set of additional mutations for leukemia to arise. In contrast, a wider variety of additional mutations may be able to cooperate with BCR/ABL in leading to the development of leukemia. This wider variety of additional mutations would be expected to be associated with a more heterogeneous gene expression profile.
Although BCR/ABL is generally associated with a poor clinical outcome, it is well recognized that this subtype of ALL is a clinically heterogeneous disease. To date, the early feature of childhood BCR/ABL ALL that is most predictive of outcome is initial response to prednisone and intrathecal methotrexate.16,17 Although our study clearly demonstrates that BCR/ABL is associated with a much more heterogeneous pattern of gene expression than is either TEL/AML1 or MLL/AF4, the median follow-up of patients in this study is too short to determine if this heterogeneity has clinical significance.
The genes whose expression is heterogeneous in BCR/ABL ALL include several cell surface proteins (eg, CD20, CD73, and CD81). One of these proteins, CD20, is routinely measured on leukemic blasts by flow cytometry when ALL is diagnosed. Interestingly, all of the BCR/ABL cell lines (except BV-173, which was obtained from chronic myelogenous leukemia in lymphoid blast crisis) are CD20 negative. This finding may indicate that CD20-BCR/ABL ALL more readily adapts to in vitro culture conditions than does the CD20+ subtype. A recent Pediatric Oncology Group study identified CD20 expression (measured by flow cytometry) in ALL to be independently correlated with outcome, particularly in the poor risk subgroup (that includes BCR/ABL).18 However, we did not find that CD20 was associated with a difference in outcome in patients with BCR/ABL ALL treated on recent BFM clinical trials. A similar study of patients with BCR/ABL ALL treated by using other treatment regimens might reveal an association between CD20 and outcome.
Armstrong et al3 have proposed that, based on its distinct gene expression pattern, MLL leukemia is a distinct disease. Following this line of reasoning, our study supports the notion that BCR/ABL ALL is, in fact, more than one distinct disease. Consequently, we feel that the results presented here provide sufficient evidence to justify a future study of gene expression in a larger number of patients with BCR/ABL ALL to more fully characterize the molecular heterogeneity of this disease, ideally in both adults and children. It seems likely that such a study would at the very least be useful for identifying potential therapeutic targets tailored to specific subtypes of BCR/ABL ALL. For example, the use of anti-CD20 antibody has been proposed as a useful therapeutic strategy in those cases of BCR/ABL ALL that have high expression of cell surface CD20.19 A more comprehensive characterization of gene expression heterogeneity in BCR/ABL ALL would no doubt lead to even more potentially beneficial strategies for the treatment of distinct subtypes of this disease.
In this study, we identified genes that are characteristically expressed in cell lines and clinical samples with the same translocation. Although our study identifies many of the genes previously reported3,4 to be associated with TEL/AML1, BCR/ABL, or MLL abnormalities, we also identify a large number of genes that have not been previously reported.
Among the genes that have not previously been reported to be associated with the TEL/AML1 subtype is EPOR. EPOR is a member of the cytokine homology domain family of receptors20 and has been implicated in the development of erythroleukemia.21 EPOR expression has been investigated by flow cytometry in adult acute leukemia,22 although the association with cytogenetic subtype was not investigated.
A model for the pathogenesis of acute leukemia has recently been proposed23,24 in which 2 classes of cooperating mutations are required for the development of acute leukemia. One class, which includes TEL/AML1, impairs differentiation. The other class, which includes BCR/ABL, confers proliferation and/or survival. Interestingly, in EPOR-deficient progenitor cells, BCR/ABL can support healthy erythroid development,25 suggesting that EPOR and BCR/ABL may have overlapping functions in leukemogenesis. The results presented here thus lead us to speculate that high expression of EPOR provides the essential proliferation and survival signals in the TEL/AML1 subtype of ALL.
Prepublished online as Blood First Edition Paper, October 2, 2003; DOI 10.1182/blood-2003-05-1518.
Supported by a grant from the National Institutes of Health (NIH) (CA92326) (L.M.B.). B.M.F. was supported by a Howard Hughes Postdoctoral Fellowship for Physicians and a Mentored Clinical Scientist Award from NIH (K08CA95563).
The online version of the article contains a data supplement.
The publication costs of this article were defrayed in part by page charge payment. Therefore, and solely to indicate this fact, this article is hereby marked “advertisement” in accordance with 18 U.S.C. section 1734.
This work would not have been possible without the support and advice of Patrick O. Brown. We thank Drs Michael Cleary and Yoshinobu Matsuo for their gifts of cell lines and members of the Brown and Boxer lab for helpful discussions. We thank the Stanford Functional Genomics Facility for production of microarrays and the Stanford Microarray Database for providing a repository for the primary data and for hosting the companion website for this paper.

