Abstract
Most K-Cl cotransport in the erythrocyte is attributed to potassium chloride cotransporter 1 (KCC1). K-Cl cotransport is elevated in sickle erythrocytes, and the KCC1 gene has been proposed as a modifier gene in sickle cell disease. To provide insight into our understanding of the regulation of the human KCC1 gene, we mapped the 5′ end of the KCC1 cDNA, cloned the corresponding genomic DNA, and identified the KCC1 gene promoter. The core promoter lacks a TATA box and is composed of an initiator element (InR) and a downstream promoter element (DPE), a combination found primarily in Drosophila gene promoters and rarely observed in mammalian gene promoters. Mutational analyses demonstrated that both the InR and DPE sites were critical for full promoter activity. In vitro DNase I footprinting, electrophoretic mobility shift assays, and reporter gene assays identified functional AP-2 and Sp1 sites in this region. The KCC1 promoter was transactivated by forced expression of AP-2 in heterologous cells. Sequences encoding the InR, DPE, AP-2, and Sp1 sites were 100% conserved between human and murine KCC1 genes. In vivo studies using chromatin immunoprecipitation assays with antihistone H3 and antihistone H4 antibodies demonstrated hyperacetylation of this core promoter region. (Blood. 2004;103:4302-4309)
Introduction
K-Cl cotransport is a major pathway for the coupled, electroneutral release of potassium and chloride from nonexcitable cells. Potassium chloride cotransporters (KCCs) are members of the cation Cl- cotransporter gene superfamily.1,2 To date, 4 mammalian KCCs have been cloned and characterized.3-9 KCC1 and KCC3 are widely expressed and play important roles in transepithelial transport, cell volume regulation, and regulation of intracellular chloride concentration.3,5-10 Mutation of the KCC3 gene is associated with an autosomal recessive disorder characterized by mental retardation, peripheral neuropathy, and agenesis of the corpus callosum.11 Mice lacking KCC3 demonstrate peripheral neuropathy and defects in locomotion and sensorimotor gating.11 KCC3 may also play a role in cell growth regulation.12 KCC2 is expressed throughout the central nervous system4,13,14 and plays an important role in synaptic transmission.15,16 KCC4 is expressed primarily in kidney, heart, lung, and liver.6 Mice lacking KCC4 exhibit deafness and renal tubular acidosis.17
Most K-Cl cotransport in the erythrocyte is attributed to KCC1. KCC1 activity is volume-, pH-, and chloride-dependent.3,9,18 The complex mechanisms that regulate KCC activity have been the focus of intensive study. These mechanisms include cell volume, pH, PO2, magnesium, calcium, and oxidative changes.19 Another regulatory pathway of KCC activity is a phosphorylation/dephosphorylation cycle (for a review, see Merciris and Giraud20 ) with phosphorylation of the transporter or a regulatory protein decreasing KCC activity and dephosphorylation increasing activity. Erythrocytes from mice deficient in the Src family kinases Fgr and Hck demonstrate elevated KCC activity.21
The KCC system contributes to the erythrocyte abnormalities in patients with various hemoglobinopathies, particularly sickle cell disease (for a review, see Lauf et al18 ). K-Cl cotransport activity is activated in sickle cell erythrocytes,19,22 contributing to the formation of dense erythrocytes as a consequence of cellular dehydration and potassium loss.1,3,9 Dense erythrocytes play a role in the vasoocclusive manifestations of sickle cell disease. It has been proposed that the KCC1 gene is a candidate modifier gene contributing to the clinical course and response to therapy in sickle cell disease.2,23,24 It is possible that genetic variants of KCC1 exist, particularly in patients with sickle cell disease, with some variants causing increased K-Cl cotransport, cellular dehydration, hemoglobin S polymerization, sickling, and increased disease severity. Because KCC1 is a major contributor to the dehydration of sickle erythrocytes, pharmacologic agents that block this pathway are being examined as therapeutic agents to prevent or ameliorate the complications of sickle cell disease.25,26
Although the mechanisms regulating K-Cl cotransport activity are beginning to be revealed, nothing is known about the regulation of KCC1 at the transcriptional level. Understanding the transcriptional regulation of the KCC1 gene may provide additional information on KCC1 activity in wild-type and sickle erythrocytes and may contribute to therapeutic strategies aimed at decreasing KCC activity in sickle erythrocytes.
Furthermore, it is possible that multiple alternate promoters regulate KCC1 expression in a tissue-specific manner, including in erythroid cells. Review of expressed sequence tags (EST) database information revealed a large number of alternately spliced KCC1 cDNA isoforms isolated from different tissues, several with alternate 5′ ends encoding novel NH2 termini with new initiator methionines (eg, BI828860 and BI829320). Initial studies have demonstrated that multiple KCC1 isoform exists in sickle and normal erythroid cells (Anderson et al27 ; and K.P.A. et al, manuscript submitted). Based on functional data obtained with artificial NH2- and COOH-terminal KCC1 truncation mutants,28 several of the KCC1 isoforms encoded by these cDNAs are predicted to alter KCC1 function. Recent studies have demonstrated that promoter choice influences splice site selection, determining the composition of alternately spliced cDNA isoforms and influencing protein structure and function.29-31 Thus, study of the 5′ ends of KCC1 cDNA isoforms and the identification and characterization of the corresponding promoter(s) is an important priority in the study of KCC1 regulation.
In this report, we describe the identification and characterization of the human KCC1 (hKCCl) gene promoter located immediately 5′ of the major KCC1 cDNA transcript. Interestingly, the core promoter lacks a TATA box and contains a functional initiator element (InR) and a functional downstream promoter element (DPE), a combination found primarily in Drosophila gene promoters and rarely observed in mammalian gene promoters. Sp1 and AP-2 binding proteins contribute significantly to KCC1 promoter function. This core promoter region is hyperacetylated in erythroid and nonerythroid cells.
Materials and methods
Isolation of the human KCC1 gene
Primary screening of a human genomic DNA BAC library (Genome Systems, St Louis, MO) was performed with a pair of oligonucleotide primers, A and B (Table 1), as described.32 These primers flank exon 1 of the hKCC1 gene33 and amplify a 115-base pair (bp) fragment. Amplification-positive clones were purified, subcloned, and analyzed by restriction endonuclease digestion, Southern blotting, and partial nucleotide sequencing.
Mapping of the KCC1 transcription initiation site
Total RNA was prepared from human tissues or from the human tissue culture cell lines K562 or HeLa as described.34 The transcription initiation site of the hKCC1 gene cDNA was determined using a primer extension assay. Oligonucleotide primer C (Table 1) was end-labeled with 32P-adenosine triphosphate (32P-ATP) using T4 polynucleotide kinase (Promega, Madison, WI) followed by ethanol precipitation with template RNA. Templates in these reactions were 25 μg K562 or HeLa cell total RNA or 10 μg transfer RNA (tRNA). Labeled primer was annealed to template RNA for 30 minutes at 75°C, cooled for 10 minutes at room temperature, then extended for 30 minutes at 43°C in the presence of buffer (50 mM Tris-HCl, pH 8.3, 50 mM KCl, 10 mM MgCl2, 20 mM dithiothreitol, 1 mM each of 4 dNTPs, and 0.5 mM spermidine), and 20 U avian myoblastosis virus (AMV) reverse transcriptase. Extension products were ethanol precipitated, dissolved in loading buffer, and analyzed on an 8% acrylamide gel adjacent to a sequencing reaction of genomic DNA primed with the same oligonucleotide.
5′ rapid amplification of cDNA ends
Single-stranded oligonucleotide ligation was carried out as described.35 Nested polymerase chain reaction (PCR) was performed using either human bone marrow or brain cDNA as template with Advantage-2 GC polymerase (Clontech, Palo Alto, CA). The primers used in PCR amplification were D and E (first amplification), then F and G (second amplification) (Figure 1A). Amplification products were subcloned and sequenced.
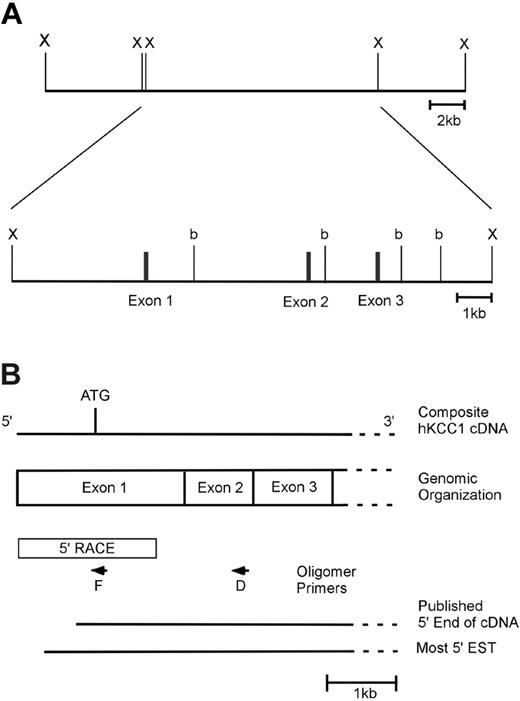
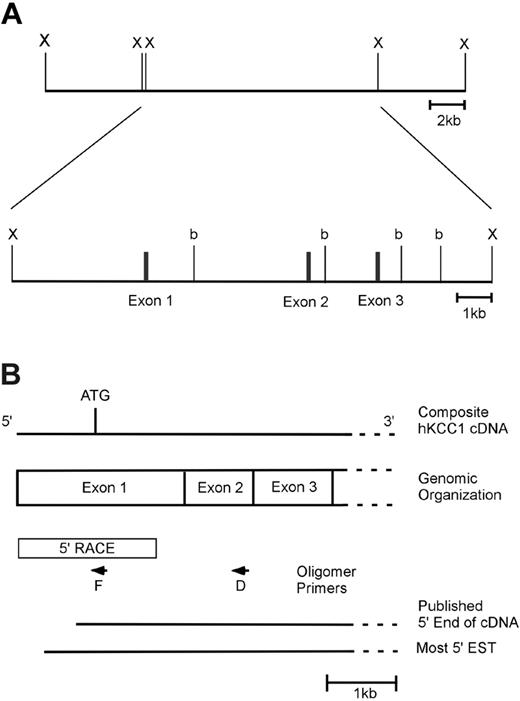
The 5′ end of the humanKCC1gene. (A) Genomic organization of the 5′ end of the human KCC1 gene. One clone containing the KCC1 gene was isolated from a human genomic DNA library. This clone spanned a distance of approximately 90 kb and contained exons 1 to 3 of the KCC1 cDNA in an approximately 13.5-kb XbaI fragment. A partial restriction map of this 13.5-kb fragment with BamHI (b) and XbaI (X) is shown. (B) Structure of the 5′ end of the human KCC1 cDNA. A diagram of the 5′ end of the human KCC1 cDNA is shown. The location of the initiation codon is shown, as is the location of intron/exon boundaries. Box denotes sequences obtained by 5′ RACE. Arrows denote oligonucleotide primers used in 5′ RACE. 5′ ends of the published cDNA and the 5′-most EST (IMAGE 5174748) are shown.
The 5′ end of the humanKCC1gene. (A) Genomic organization of the 5′ end of the human KCC1 gene. One clone containing the KCC1 gene was isolated from a human genomic DNA library. This clone spanned a distance of approximately 90 kb and contained exons 1 to 3 of the KCC1 cDNA in an approximately 13.5-kb XbaI fragment. A partial restriction map of this 13.5-kb fragment with BamHI (b) and XbaI (X) is shown. (B) Structure of the 5′ end of the human KCC1 cDNA. A diagram of the 5′ end of the human KCC1 cDNA is shown. The location of the initiation codon is shown, as is the location of intron/exon boundaries. Box denotes sequences obtained by 5′ RACE. Arrows denote oligonucleotide primers used in 5′ RACE. 5′ ends of the published cDNA and the 5′-most EST (IMAGE 5174748) are shown.
Preparation of nuclear extracts
Nuclear extracts were prepared from K562 and HeLa cells by hypotonic lysis followed by high salt extraction of nuclei, as described by Andrews and Faller.36
DNase I footprinting in vitro
Probes for DNase I footprinting were by produced by PCR amplification of plasmids p-369/+18 and p-369/+81 containing hKCC1 genomic fragments (see “Results”) with oligonucleotide primers C and H or C and J, respectively (Table 1). In each reaction, one of the primers had been 5′ end-labeled with 32P-ATP using polynucleotide kinase before use in PCR. Reaction mixes contained 75 μg K562 cell nuclear extracts, 20 000 cpm labeled probe, and 1 μg poly(dI-dC). After digestion with DNase I, samples were electrophoresed in 6% denaturing polyacrylamide gels, and the gels were dried and subjected to autoradiography.
Preparation of promoter-reporter plasmids for transfection assays
A 387-bp fragment corresponding to 5′ flanking hKCC1 genomic DNA from -369 to +18 relative to the transcription initiation site was amplified using primers H and I (Table 1). This fragment was subcloned in both orientations upstream of the firefly luciferase reporter gene in the plasmid pGL2B (Promega), yielding plasmids p-369/+18 and p+18/-368 reverse. Additions, truncations, and mutations of this fragment in the pGL2B plasmid were performed using PCR amplification. Integrity of test plasmids was confirmed by sequencing.
Cell culture
Human tissue culture cell lines K562 (ATCC, CCL 243), HeLa (CCL 2), and HepG2 (primary liver cancer, ATCC HB-8605) were used to study expression of the hKCC1 gene.
Transient transfection analyses
All plasmids tested were purified using Qiagen columns (Qiagen, Chatsworth, CA) or cesium chloride plasmid purification, and at least 2 preparations of each plasmid were tested in triplicate. K562 and HeLa cell transfections were performed as described.37 All assays were performed in triplicate. Differences in transfection efficiency were determined by cotransfection with the pCMVβ plasmid. For transactivation assays, HepG2 cells were transfected using 1 μg reporter plasmid and varying amounts of AP-2α, AP-2β, AP-2γ, and AP-2δ cDNA expression plasmids (kindly supplied by Drs Trevor Williams (University of Colorado Health Sciences Center, Denver), Helen Hurst (Hammersmith Hospital, London, United Kingdom), Feng Zhao (Mount Sinai School of Medicine, New York, NY), and Bruce Gelb (Mount Sinai School of Medicine)), and the reporter gene activity was assayed.
Gel mobility shift assays
Binding reactions were carried out as described.37 Competitor oligonucleotides were added at molar excesses of 100-fold. Antibodies to AP-2 and Sp1 were obtained from Santa Cruz Biotechnology (Santa Cruz, CA).
Quantitative ChIP assays
Antidiacetylated histone H3 (06-599) and antitetraacetylated histone H4 (06-866) antibodies were obtained from Upstate Biotechnology (Lake Placid, NY). Quantitative chromatin immunoprecipitation (ChIP) analysis was performed as described.38,39 After formaldehyde fixation, chromatin was fragmented by sonication 9 times for 10 seconds each. Extracts were precleared with protein G Sepharose, and antibody was added and incubated overnight at 4°C. After elution and extraction, immunoprecipitated DNA was analyzed by quantitative real-time PCR (iCycler; Bio-Rad, Hercules, CA). PCR primers K and L (Table 1) amplify a 108-bp fragment corresponding to the core KCC1 promoter. Samples from at least 3 independent immunoprecipitations were analyzed. SYBR green fluorescence in 25 μL PCR reactions was determined, and the amount of product was determined relative to a standard curve generated from a titration of input chromatin. Amplification of a single amplification product was confirmed by dissociation curve analysis and agarose gel electrophoresis with ethidium bromide staining. Parallel controls for each experiment included samples of no chromatin, no antibody, nonimmune rabbit immunoglobulin G (IgG), and rabbit nonimmune serum.
Computer analyses
Computer analyses were performed using the BLAST algorithm (National Center for Biotechnology Information, Bethesda, MD).40
Results
Cloning of the human KCC1 gene
Screening a human genomic DNA BAC library yielded an approximately 90-kilobase (kb) genomic clone containing all the exons of the hKCC1 gene.33 An approximately 13.5-kb XbaI fragment containing exons 1 to 3 and the 5′ flanking KCC1 sequence was isolated from the BAC clone for further characterization. A limited restriction map of this region is shown in Figure 1A.
Mapping the human KCC1 mRNA transcription initiation site
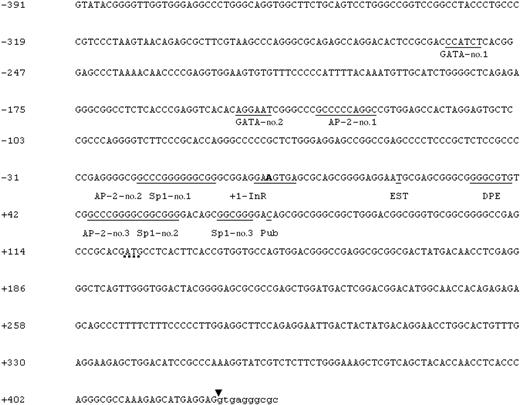
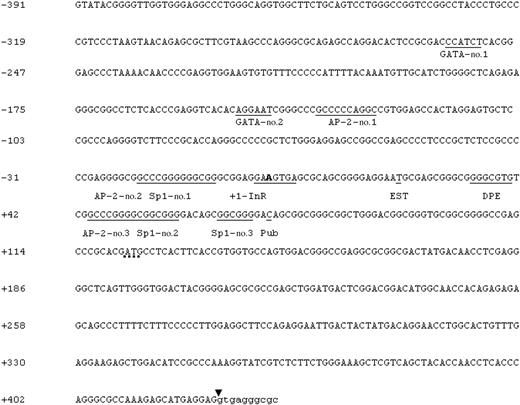
To identify the 5′ end of the human KCC1 cDNA, primer extension was performed using total RNA from K562 cells. These experiments identified a single transcription initiation site (Figure S1; see the Supplemental Materials link at the top of the online article on the Blood website) and predicted the presence of an additional 22 bp in the mRNA upstream of the sequence from the 5′-most EST (IMAGE clone 5174748). This is 52 bp upstream of the 5′ end previously identified by cDNA cloning (Figure 1B).3 Similar results were obtained using RNA from HeLa cells. The additional 22 bp of upstream 5′-untranslated sequence was obtained by 5′ rapid amplification of cDNA ends (RACE). Sequences obtained by RACE were verified by comparison with corresponding genomic DNA sequences (Figure 2). The sequences around the transcription start site, GAA+1GTGA, do not precisely match the consensus for an InR, YYA+1NWYY.41 However, they do match the most critical sequences of A at +1 and T at +3.42,43 More important, they meet the definition for a functional InR—that is, transcription initiates at this location and mutational analyses demonstrate their functional importance (see “Results”).41 No additional in-frame ATGs were present in the 5′-untranslated sequences. Taken together, these data suggest that this sequence is at or very near the 5′ end of the human KCC1 cDNA.
5′ Flanking genomic DNA sequence. Nucleotide sequence of the 5′ flanking genomic DNA of the human KCC1 gene is shown. Consensus sequences for potential GATA and AP-2 DNA-protein binding sites are underlined; potential Sp1-binding sites are also underlined. A indicates the transcription initiation site +1 contained within the InR. The initiator methionine is marked by a dotted line. The 5′ ends of the published cDNA (Pub) and of the 5′-most EST (EST) are shown. Sequences beginning intron 1 are in lowercase. The arrowhead indicates the end of exon 1.
5′ Flanking genomic DNA sequence. Nucleotide sequence of the 5′ flanking genomic DNA of the human KCC1 gene is shown. Consensus sequences for potential GATA and AP-2 DNA-protein binding sites are underlined; potential Sp1-binding sites are also underlined. A indicates the transcription initiation site +1 contained within the InR. The initiator methionine is marked by a dotted line. The 5′ ends of the published cDNA (Pub) and of the 5′-most EST (EST) are shown. Sequences beginning intron 1 are in lowercase. The arrowhead indicates the end of exon 1.
5′-flanking genomic DNA sequence of the hKCC1 gene
The nucleotide sequence of the genomic DNA upstream of the hKCC1 cDNA transcription start site is shown in Figure 3. Inspection of the sequence reveals a lack of consensus TATA or CCAAT sequences. Consensus sequences for a number of potential DNA-binding proteins, including GATA-1 (2 imperfect sites), GC/CACC-binding related proteins (3 sites), and AP-2 (3 sites) are present in the 5′-flanking sequences. GATA motifs bind GATA-1, a zinc finger transcription factor essential for erythroid development.44,45 GC or GT/CACC motifs are the binding sites for a number of transcription factors, including ubiquitous proteins such as Sp1 and cell-restricted proteins such as members of the KLF family.45,46 AP-2 proteins bind GC-rich sequences and are important in a wide variety of processes, including development, apoptosis, and cell cycle control.47
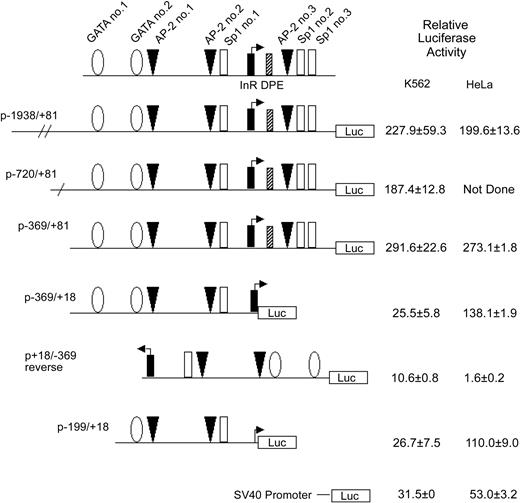
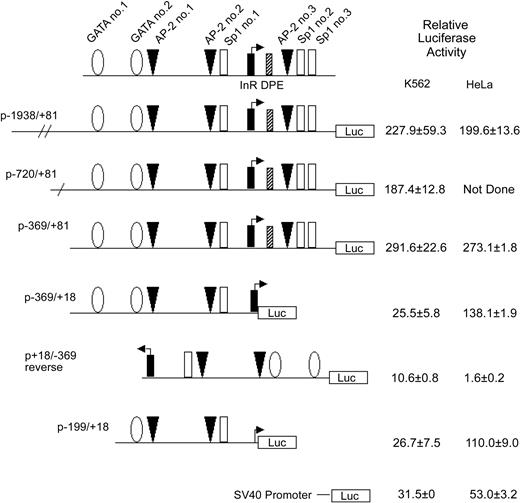
Activity of theKCC1gene promoter in erythroid and nonerythroid cell lines in transient transfection assays. Plasmids containing 5′ flanking DNA of the KCC1 gene inserted upstream of the firefly luciferase gene were transfected into K562 or HeLa cells as described in “Materials and methods.” Relative luciferase activity was expressed as that obtained from the test plasmids compared with the activity obtained from the promoterless plasmid pGL2B plasmid, taking into account the transfection efficiency. Data are mean ± SD of at least 6 independent transfection experiments.
Activity of theKCC1gene promoter in erythroid and nonerythroid cell lines in transient transfection assays. Plasmids containing 5′ flanking DNA of the KCC1 gene inserted upstream of the firefly luciferase gene were transfected into K562 or HeLa cells as described in “Materials and methods.” Relative luciferase activity was expressed as that obtained from the test plasmids compared with the activity obtained from the promoterless plasmid pGL2B plasmid, taking into account the transfection efficiency. Data are mean ± SD of at least 6 independent transfection experiments.
When compared with the draft human genomic DNA sequence (NT_010478), we identified an additional 12 bp of sequence, CGGCGGGGACAG, in the 5′-untranslated region of the core KCC1 promoter not present in the database. This sequence, which contains consensus-binding sequences for CGCC/CACCC-related proteins, follows a direct repeat in the genomic DNA. We analyzed this region in 24 alleles from unrelated persons and found that all 24 alleles contained the 12 bp. The EST clone that extends through this region (IMAGE clone 5174748) also contains the 12 bp.
hKCC1 gene promoter fragment is active in erythroid and nonerythroid cells
To begin to identify sequences essential for KCC1 gene expression, plasmids containing 5′-flanking sequences linked to a luciferase reporter gene were transiently transfected into K562 and HeLa cells. Plasmids containing KCC1 gene fragments from -1938, -720, and -369 to +81 directed high levels of relative luciferase expression (Figure 3). A plasmid with the 3′ end of -369/+81 deleted at the 3′ end, from +81 to +18, p-369/+18, directed levels of relative luciferase expression 25.5 ± 5.8-fold over background in K562 cells and 138.1 ± 1.9-fold over background in HeLa cells (Figure 3). A plasmid with this promoter fragment in reverse orientation, p+18/-386 reverse, directed decreased expression or no expression of the reporter gene. Further deletion of this promoter fragment at the 5′ end to create p-199/+18 also directed activity in erythroid and nonerythroid cells (Figure 3). This promoter fragment contains potential binding sites for GATA-1 and for Sp1 and CACCC-related proteins, a combination shown to be adequate for expression of a minimal promoter in erythroid-specific genes.45,47,48
hKCC1 promoter contains binding sites for Sp1 and AP-2 binding proteins
To identify binding sites for transcription factors within the -199 to +81 hKCC1 promoter region, DNase I footprinting analysis with nuclear extracts from K562 cells was performed. A single protected region from -24 to -9 was observed (Figure S2). This protected region contains consensus-binding sequences for AP-2 (AP-2 site 2; Figures 2, 3) and Sp1 (Sp1 site 1; Figures 2, 3). The upstream GATA-1 and AP-2 consensus-binding sequences (GATA sites 1-2, AP-2 site 1; Figure 3) and the downstream AP-2 and Sp1 consensus-binding sequences (AP-2 site 3, Sp1 sites 2-3), all contained within the sequence of the footprinting probes, were not protected.
AP-2 proteins bind to the hKCC1 gene core promoter in vitro
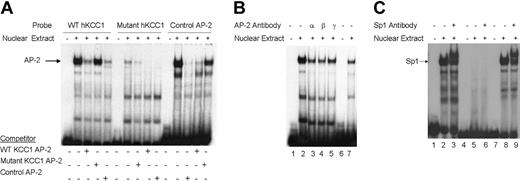
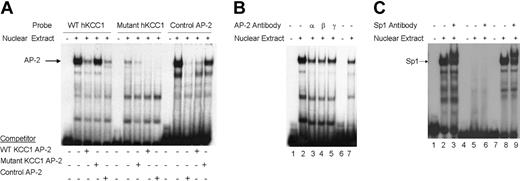
To determine whether nuclear proteins could bind the footprinted AP-2 site in vitro, double-stranded oligonucleotides containing the corresponding hKCC1 promoter AP-2 sequences or control sequences (Table S1)49 were prepared and used as probes in gel shift analyses. A single major complex was identified using the KCC1 AP-2 probe that migrated at the same mobility as the control AP-2 probe with both K562 (erythroid) (Figure 4A) and HeLa (not shown) extracts. This complex was effectively competed away by an excess of unlabeled homologous or control AP-2 oligonucleotide. A mutant KCC1 AP-2 oligonucleotide did not form a DNA-protein complex, nor did it effectively displace wild-type KCC1 AP-2 or control AP-2 oligonucleotides in competition assays (Figure 4A). The inclusion of AP-2 α, AP-2 β, AP-2 γ, or AP-2 δ antisera abolished the DNA binding (Figure 4B). These data indicated that AP-2-related proteins bind in vitro to a site of the hKCC1 gene promoter.
Gel mobility shift assays of the AP-2 and Sp1 sites of thehKCC1gene promoter. Gel mobility shift assays using oligonucleotide probes corresponding to the AP-2 site 2 and Sp1 site 1 consensus-binding sequences of the human KCC1 promoter were performed using K562 nuclear extracts. (A) The probe used in lanes 1 to 5 corresponds to wild-type KCC1 AP-2, the probe used in lanes 6 to 10 corresponds to mutant KCC1 AP-2, and the probe used in lanes 11 to 15 corresponds to a control AP-2. Unlabeled, double-stranded oligonucleotide was added to the reactions as competitor where indicated. (B) The probe used in lanes 1 to 5 corresponds to wild-type KCC1 AP-2, and the probe used in lanes 6 and 7 corresponds to control AP-2. Specific AP-2 antibody was added to the reaction mixtures where indicated. (C) The probe used in lanes 1 to 3 corresponds to wild-type KCC1 Sp1, the probe used in lanes 4 to 6 corresponds to mutant KCC1 Sp1, and the probe used in lanes 7 to 9 corresponds to control Sp1. Specific Sp1 antibody was added to the reaction mixtures where indicated.
Gel mobility shift assays of the AP-2 and Sp1 sites of thehKCC1gene promoter. Gel mobility shift assays using oligonucleotide probes corresponding to the AP-2 site 2 and Sp1 site 1 consensus-binding sequences of the human KCC1 promoter were performed using K562 nuclear extracts. (A) The probe used in lanes 1 to 5 corresponds to wild-type KCC1 AP-2, the probe used in lanes 6 to 10 corresponds to mutant KCC1 AP-2, and the probe used in lanes 11 to 15 corresponds to a control AP-2. Unlabeled, double-stranded oligonucleotide was added to the reactions as competitor where indicated. (B) The probe used in lanes 1 to 5 corresponds to wild-type KCC1 AP-2, and the probe used in lanes 6 and 7 corresponds to control AP-2. Specific AP-2 antibody was added to the reaction mixtures where indicated. (C) The probe used in lanes 1 to 3 corresponds to wild-type KCC1 Sp1, the probe used in lanes 4 to 6 corresponds to mutant KCC1 Sp1, and the probe used in lanes 7 to 9 corresponds to control Sp1. Specific Sp1 antibody was added to the reaction mixtures where indicated.
Sp1 binds to the hKCC1 gene core promoter in vitro
Similarly, to determine whether nuclear proteins could bind the footprinted Sp1 site in vitro, double-stranded oligonucleotides containing the corresponding hKCC1 promoter Sp1 sequences or control sequences (Table S1)50 were prepared and used as probes in gel shift analyses. A major complex was identified using the KCC1 Sp1 probe that migrated at the same mobility as the control Sp1 probe with K562 and HeLa extracts (Figure 4C). The inclusion of anti-Sp1 antisera supershifted most of the complex. A mutant KCC1 Sp1 oligonucleotide (Table S1) did not form a DNA-protein complex. These data indicate that Sp1 binds in vitro to a site of the hKCC1 gene promoter.
AP-2 proteins are major activators of the hKCC1 gene promoter
To further assess the relative importance of AP-2 in promoter function, mutations known to disrupt AP-2 binding (GCCCGGGGG to GACCGGTGG)51 were introduced into the AP-2 site protected in DNase I footprinting in the KCC1 promoter-reporter gene plasmid, and its effect was assayed in transiently transfected K562 cells. Mutation of this AP-2 site reduced promoter activity by more than half, from 194.1 ± 12.6 (wild-type promoter activity) to 82.7 ± 31.0. Similarly, a mutation known to disrupt Sp1 binding (GGCGGG to GTCGGG)52 was introduced into the Sp1 site protected in DNase I footprinting in the KCC1 promoter-reporter gene plasmid, and its effect was assayed in transiently transfected K562 cells. Mutation of this Sp1 site reduced promoter activity by one third, to 120.3 ± 10.1.
To determine whether other potential transcription factor-binding sites contributed to promoter function in vitro, individual mutations were introduced into the remaining Sp1, AP-2, and GATA-1 sites shown in Figure 3. Mutation of the other AP-2 and Sp1 sites did not significantly affect promoter activity (wild-type promoter, 194.1 ± 12.6; AP-2 1, 158.4 ± 26.2; AP-2 3, 189.9 ± 9.9; Sp12, 185.1 ± 18.5; Sp1 3 166.7 ± 18.2). Introduction of a mutation known to disrupt GATA-1 binding and promoter function (GATA to GTTA)53 into the KCC1 promoter GATA-1 sites did not significantly affect promoter activity in erythroid cells (GATA 1, 186.1 + 39.5; GATA 2, 160.8 + 19.8).
AP-2 transactivates the hKCC1 gene promoter in heterologous cells
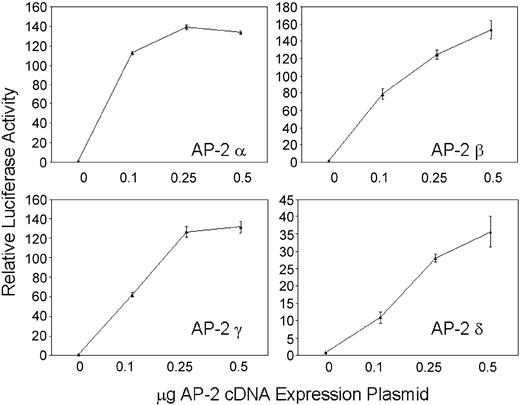
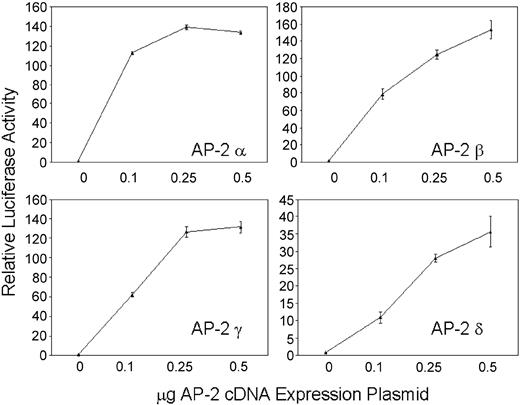
Cotransfection of a minimal hKCC1 promoter/luciferase plasmid, p-117/+81 (see below) with AP-2 α, AP-2 β, AP-2 γ, or AP-2 δ cDNA expression plasmids into HepG2 cells resulted in increasing luciferase activity with increasing amounts of AP-2 plasmid (Figure 5). The ability of AP-2 to transcriptionally activate the hKCC1 promoter in a dose-dependent manner in HepG2 cells, which do not contain AP-2 related proteins, further demonstrates the importance of AP-2 proteins in hKCC1 promoter function.
Forced expression of thehKCC1gene promoter in HepG2 cells. A human KCC1 promoter/luciferase reporter plasmid was cotransfected with increasing amounts of AP-2 cDNA expression plasmids. Dose-dependent activation of the hKCC1 promoter was observed with all 4 AP-2-binding proteins. Error bars indicate SD.
Forced expression of thehKCC1gene promoter in HepG2 cells. A human KCC1 promoter/luciferase reporter plasmid was cotransfected with increasing amounts of AP-2 cDNA expression plasmids. Dose-dependent activation of the hKCC1 promoter was observed with all 4 AP-2-binding proteins. Error bars indicate SD.
TATA-less KCC1 gene core promoter contains functional InR and DPE sequences
Transfection assays in K562 and HeLa cells demonstrated that deletion of 63 bp of a 3′ sequence from the 5′ flanking DNA in the KCC1 promoter plasmid, p-369/+81 to p-369/+18, significantly decreased reporter gene activity more than 10-fold (Figure 3). This sequence contains consensus-binding sites for AP-2- and CGCC/CACCC-related proteins. However, mutation of the AP-2 site (site 3, GCCCGGGGC to GCACGGGTC)51 and the Sp1 sites (sites 2 and 3)52 had no effect on reporter gene activity. Comparison of the sequence from this region between human and mouse revealed 100% conservation of the protected AP-2 and Sp1 sites. In addition, 43 of 44 nucleotides from position -6 to +38 (numbering according to human) were homologous. This region encodes the transcription initiation site (the InR) and the sequences GGGCG at position +34 to + 38.
These sequences closely match the consensus-binding sequences and location/spacing for a downstream promoter element, or DPE (KCC1, GGGCGT; DPE, A/G/T C/G A/T C/T A/C/G CT).54,55 The presence of an InR and a DPE in a TATA-less promoter, a combination found primarily in Drosophila gene promoters,55-57 is beginning to be recognized as an important component of mammalian core promoters.58-60 Most DPEs function cooperatively with the InR to direct basal transcription of TATA-less promoters. In other cases, they act to recruit transcription factors not generally regarded as part of the basal transcription machinery to regulate transcription (Figure 6).61
Comparison of human and murine KCC1 core promoter sequences. The AP-2, Sp1, InR, and core DPE sites are conserved between species. The bold A indicates the transcription insertion site.
Comparison of human and murine KCC1 core promoter sequences. The AP-2, Sp1, InR, and core DPE sites are conserved between species. The bold A indicates the transcription insertion site.
To examine whether a promoter fragment that maintained the DPE but deleted the remainder of downstream 5′ flanking sequences still directed high-level luciferase expression, the plasmid p-369/+41 was examined in transfection assays. Luciferase expression was reduced by only 20% (Figure S3). To test whether the downstream DPE consensus sequences were functional, a mutation predicted to disrupt DPE function (GGGCGTG to CCCACCC) was introduced into the hKCC1 DPE consensus sequence, p+369/+81MutantDPE, and the effect was examined in transfected K562 cells. This mutation decreased luciferase activity by more than two thirds (Figure S3). In promoters with functional DPEs, the spacing between the InR and the DPE is strictly regulated, usually with the DPE beginning at position +28. However, there is variability, with some DPEs starting between positions +29 and +32, such as the Drosophila engrailed or E75A DPE, located at position +32.56 In Drosophila promoters, adding 3 bp between the InR and the DPE has been shown to decrease the expression of a linked reporter gene. Introducing a 3-bp spacer between the hKCC1 InR and DPE (AGA inserted between nucleotides [nts] +18 and +19), p-369/+813bpInsert, decreased luciferase reporter gene activity by more than one third in transfected cells (Figure S3). To test whether a minimal promoter fragment with the downstream promoter sequences still conferred high-level activity to a reporter gene, a core promoter fragment containing the footprinted Sp1 site, the footprinted AP-2 site, and the InR was linked to downstream containing the DPE in a luciferase reporter plasmid, p-117/+81. In transiently transfected K562 cells, this plasmid directed luciferase expression at levels just slightly less than the p-369/+81 bp promoter fragment (Figure S3).
Additional transfection assays were performed in HeLa cells using minimal core promoter fragments in luciferase reporter plasmids to examine the effect of mutations of individual elements on promoter function. A fragment containing single Sp1 and AP-2 sites, the InR and the DPE p-26/+81, directed significant luciferase activity, 180.5 ± 31.7 (Figure 7A). Deleting 10 bp, which removed the AP-2 site p-16/+81, reduced activity by one third (Figure 7A). Mutation of the Sp1 site, p-16/+81MutantSp1, decreased activity by almost half. Mutation of the InR, the DPE, or both completely abolished promoter function.
InR and DPE are both critical for hKCC1 promoter function. (A) Plasmids containing minimal hKCC1 gene promoter fragments inserted upstream of the firefly luciferase gene were transfected into HeLa cells and luciferase activity was determined as described in “Materials and methods.” Mutations are marked with the letter X. See “Materials and methods” for details. Data are mean ± SD of at least 6 independent transfection experiments. (B) Plasmids containing either a minimal wild-type hTAFII55 promoter fragment or an hTAFII55 promoter fragment with the InR and DPE elements replaced by the human KCC1 InR and DPE elements, inserted upstream of the firefly luciferase gene, were transfected into HeLa cells, and luciferase activity was determined as described.
InR and DPE are both critical for hKCC1 promoter function. (A) Plasmids containing minimal hKCC1 gene promoter fragments inserted upstream of the firefly luciferase gene were transfected into HeLa cells and luciferase activity was determined as described in “Materials and methods.” Mutations are marked with the letter X. See “Materials and methods” for details. Data are mean ± SD of at least 6 independent transfection experiments. (B) Plasmids containing either a minimal wild-type hTAFII55 promoter fragment or an hTAFII55 promoter fragment with the InR and DPE elements replaced by the human KCC1 InR and DPE elements, inserted upstream of the firefly luciferase gene, were transfected into HeLa cells, and luciferase activity was determined as described.
To gain additional insight into the function of the KCC1 promoter, the KCC1 InR and DPE elements were substituted into the minimal human TAFII55 promoter. TAFII55 is a TATA-less gene that contains a functional initiator and a downstream promoter element beginning at position +29.62 Two plasmids were prepared. One was a minimal wild-type TAFII55 promoter, 5′-CCGGGTACCCCTCCCGCCCCGCGTCGCGACGTAGCACTTCCGTTT TTGCTGGG TAGGCGACCCGGACGGGAGAAGCTTGCC-3′, linked to a luciferase reporter gene. The other was a TAFII55 promoter, with the wild-type InR and DPE replaced by the human KCC1 promoter InR and DPE elements, 5′-CCGGGTACCCCTCCCGCCCCGCGTCGCGACG TAGAAGTGCCGTTTTTGCTGGG TAGGCGACCCGGGGCGTGAGAAGCTTGCC-3′ (Figure 7B). If the KCC1 InR and DPE elements were nonfunctional, no luciferase activity would have been directed by the TAFII55/KCC1 hybrid promoter. The TAFII55/KCC1 hybrid promoter directed levels of luciferase expression approximately 70% of the wild-type TAFII55 promoter (Figure 7B), indicating functionality of these elements in a different promoter context.
Chromatin immunoprecipitation analysis of the minimal hKCC1 promoter region
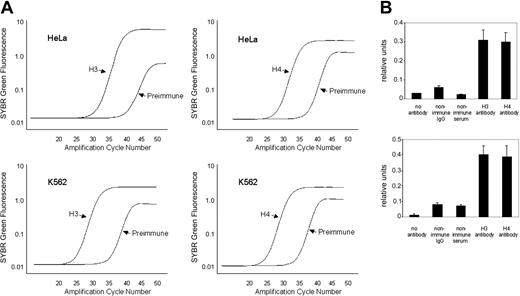
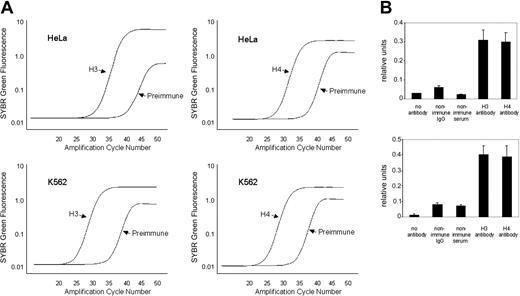
Histone modifications within the minimal hKCC1 gene promoter were examined using a ChIP assay with antidiacetyl histone H3 and antitetraacetyl histone H4 antibodies and PCR primers (K and L) that amplified across a 128-bp core promoter region. Plots of SYBR green fluorescence (relative units) compared with initial input DNA concentrations were linear for K562 (erythroid) and HeLa (nonerythroid) cells, with R2 ranging from 0.097 to 0.99 (not shown). Representative amplification plots for quantitative analysis of histones H3 and H4 in K562 and HeLa cells are shown in Figure 8A. Dissociation plots from individual amplicons demonstrated single peaks, indicating amplification of a single amplicon. This was verified by ethidium bromide-stained agarose gel electrophoresis.
Quantitative ChIP analysis of the hKCC1 core promoter region. (A) Representative amplification plots of preimmune serum and DNA from chromatin immunoprecipitated with anti-H3 and anti-H4 antibodies at the hKCC1 gene core promoter in K562 and HeLa cells. PI indicates preimmune serum. (B) The core promoter region of the hKCC1 gene is hyperacetylated by H3 and H4 in K562 and HeLa cells in chromatin immunoprecipitation assays. See text for details. Error bars indicate SD.
Quantitative ChIP analysis of the hKCC1 core promoter region. (A) Representative amplification plots of preimmune serum and DNA from chromatin immunoprecipitated with anti-H3 and anti-H4 antibodies at the hKCC1 gene core promoter in K562 and HeLa cells. PI indicates preimmune serum. (B) The core promoter region of the hKCC1 gene is hyperacetylated by H3 and H4 in K562 and HeLa cells in chromatin immunoprecipitation assays. See text for details. Error bars indicate SD.
The core histones H3 and H4 were hyperacetylated in this region in chromatin from K562 cells and HeLa cells (Figure 8B). Acetylation of core histones in nucleosomes is a critical chromatin modification. Histone acetylation alters the structure of the nucleosome and higher-order chromatin, increasing the accessibility of nucleosomal DNA, and the acetyl lysine residue may provide a platform for the interaction of proteins involved in transcription.
Discussion
The chloride-dependent, sodium-independent cotransport of potassium and chloride in a 1:1 stoichiometry in the erythrocyte has been studied in great detail.1,17 Initially, K-Cl cotransport was viewed as a developmental process in which cotransporter activity promotes the efflux of potassium followed by water from high-potassium erythroid precursors and reticulocytes, decreasing cell volume with cellular maturation. This cotransport activity, which is negligible in mature erythrocytes, was increased in certain hemoglobinopathies, particularly sickle cell disease, contributing to cellular dehydration. In the erythrocyte, K-Cl cotransport activity has been attributed to KCC1 with possibly some contribution from KCC3.63
Northern blot analyses with KCC1-specific probes demonstrated that the RNA is ubiquitously distributed, suggesting function for KCC1 outside the erythrocyte.3,9 Beyond its possible housekeeping function, the role of KCC1 in volume regulation and transepithelial transport in renal cells, in vascular reactivity, in cervical cancer, and in the genesis of arrhythmias after myocardial ischemia are some of the functions under investigation.2,64-68
The identification of a TATA-less KCC1 gene promoter containing functional InR and DPE elements is an unusual finding in a mammalian promoter. In Drosophila, approximately half of all core promoters contain a TATA box and an InR at the transcription initiation site. The other half lack a TATA box and contain an InR and a DPE located approximately 30 bp 3′ of the transcription initiation site.54,59 The TATA box, the InR, and the DPE are capable of recognizing the TFIID complex. In mammalian genes, core promoter structure is more complex than Drosophila. Fewer promoters contain TATA boxes,69 fewer promoters have TATA boxes and InR, DPEs have been rarely described,62,70,71 and many mammalian promoters lack all 3 core promoter elements.60 It is likely that the variable occurrence of TATA, InR, and DPE use makes an important contribution to combinatorial gene regulation,60,72-76 with differences arising not from mechanisms of transcription initiation from different core promoter structures but from interactions with transcription factors not considered part of the general transcription machinery.31,60,61
Similar to the KCC1 promoter, several TATA-less promoters are regulated by Sp1 and AP-2 proteins.69,76,77 One of these, the human TAFII55 gene, is one of the few mammalian genes described with function InR and DPE elements.69 It will be interesting to determine whether this combination—that is, a TATA-less core promoter with functional InR and DPEs regulated by Sp1 and AP-2—emerges as a common mammalian core promoter arrangement.
Prepublished online as Blood First Edition Paper, February 19, 2004; DOI 10.1182/blood-2003-01-0107.
Supported in part by grants from the National Institutes of Health (P60 HL58421) and the March of Dimes Birth Defects Foundation.
The online version of the article contains a data supplement.
The publication costs of this article were defrayed in part by page charge payment. Therefore, and solely to indicate this fact, this article is hereby marked “advertisement” in accordance with 18 U.S.C. section 1734.
Sequences reported in this paper have been deposited in the GenBank database (AY211326).

