Abstract
Our laboratory recently identified a quiescent class of pluripotent hematopoietic stem cells (PHSCs) that are lineage negative (Linneg), lack c-Kit, and are able to give rise to c-Kit–positive (c-Kitpos) PHSCs in vivo. This population fails to proliferate in vitro but has delayed reconstituting activity in vivo. In this study, we purified these cells to enrich for the PHSCs and we identified in vitro conditions capable of supporting their maturation. The c-Kit–negative (c-Kitneg) cells exhibited differential expression of Sca-1, CD34, CD43, CD45, and Thy 1.2. We purified the cells based on Sca-1, as it is expressed on active PHSCs. We detected pre–colony-forming unit spleen (pre–CFU-s) activity in both the Sca-1neg and Sca-1pos populations, indicating the presence of primitive PHSCs in both populations. However, our in vitro studies suggest that the Sca-1pos population is enriched for PHSCs. The in vitro systems that support the growth of these dormant cells include a modified long-term marrow culture and various stromal cell lines. In modified long-term bone marrow cultures, c-Kitneg cells gave rise to c-Kitpos PHSCs, with long-term reconstitution activity in vivo. Thus we have established an in vitro system to examine PHSC maturation that will allow us to study the mediators of the c-Kitneg to c-Kitpos transition.
Introduction
Pluripotent hematopoietic stem cells (PHSCs) are rare cells that have the capacity to self-renew and give rise to all lineages of hematopoietic cells. The current cell surface phenotype of the PHSCs is considered to be c-KitposSca-1posLinneg-low.1-3 When transplanted, these cells provide both short-term (30-90 days) and long-term (8-10 months) reconstitution of all hematopoietic lineages. In addition, they give rise to colonies on the spleens of lethally irradiated mice within 12 days of transplantation (colony-forming unit spleen [CFU-s]). They also form colonies in soft agar (CFU-culture [CFU-c]) in response to combinations of hematopoietic growth factors (HGFs), including stem cell factor (SCF) and interleukin-3 (IL-3).4 Induction of c-Kit expression is essential for proper hematopoietic development, as illustrated by knock-out animal systems in which deletion of c-Kit, or its ligand, SCF, results in prenatal lethality due to the disruption of hematopoiesis.5,6 Similarly, antibodies that prevent c-Kit from interacting with SCF block hematopoietic development both in vitro and in vivo.7-9 However, while c-Kit expression is known to be crucial for hematopoiesis, the conditions that support the development of the c-Kit–negative (c-Kitneg) cell to a c-Kit–positive (c-Kitpos) cell remain poorly understood.
Previously, our laboratory identified and characterized a novel c-Kitneg PHSC population that does not have short-term reconstitution activity, does not form CFU-c's or CFU-s's, yet gives rise to c-Kitpos PHSCs when transplanted into lethally irradiated recipients after 8 to 10 months.10 This delayed reconstitution suggested c-Kitpos cells develop over time. These dormant c-Kitneg cells are purified from mouse bone marrow by counter current elutriation to obtain blast-sized cells (counter current elutriation at 25 mL/min = CCE-25). Elutriation is followed by fluorescence-activated cell sorting (FACS) to remove lineage-committed (B, T, and erythroid) and c-Kitpos cells. CCE-25–c-Kitneg cells also lack antigens expressed on mature myeloid cells.10 Additionally, unlike c-Kitpos cells, CCE-25–c-Kitneg cells are unique in that they do not form colonies in soft agar in the presence of multiple growth factors and do not radioprotect lethally irradiated mice or give rise to CFU-s's. Identification of the PHSC c-Kitlow cells by our laboratory and others provides further support for the model of c-Kitneg to c-Kitpos PHSC development.11,12 Although the c-Kitneg cell is thought to be the ancestor of the c-Kitpos PHSC, it has been technically difficult to study the transition of this cell from the c-Kitneg state to the c-Kitpos state, because of its delayed engraftment kinetics (8-10 months) and its apparent inability to grow in vitro.
To gain an understanding of the mechanisms controlling the growth of c-Kitneg cells, we had 2 goals. First, we needed to further purify the PHSC activity in the CCE-25–c-Kitneg cell population. Previously, we discovered the CCE-25–c-Kitneg population was heterogeneous. In this study we increased the stringency of the CCE-25–c-Kitneg isolation and then examined this population for the expression of other PHSC surface antigens, including Sca-1, CD34, CD43, and Thy 1.2.10 Second, we identified in vitro conditions that would support the growth of these cells. To do this, we used a recently developed, modified long-term marrow culture system, as well as multiple stromal cell lines, both known to support PHSC growth, for their ability to support the growth and differentiation of c-Kitneg cells in vitro. Here we show the first evidence for in vitro growth of these dormant CCE-25–c-Kitneg PHSCs. These in vitro conditions can be used in future studies to identify the factors controlling the proliferation and maturation of the c-Kitneg PHSCs.
Materials and methods
Mice
C57Bl/6 (Ly-5.1) and congenic C57Bl/6 (Ly-5.2) mice 6 to 12 weeks of age were obtained from the animal production area at NCI-Frederick (Frederick, MD). Animal care was provided in accordance with the procedures outlined in the “Guide for Care and Use of Laboratory Animals” (National Institutes of Health, Bethesda, MD, 1996).
CCE-25–c-Kitneg purification
Bone marrow was flushed from femurs of C57Bl/6 mice with Iscoves modified Dulbecco medium (IMDM; GibcoBRL, Grand Island, NY) supplemented with 10% fetal bovine serum (Hyclone, Logan, UT), and penicillin/streptomycin (pen/strep; GibcoBRL). Cells were filtered through a 40-μm nylon mesh (BD Falcon, Bedford, MA). To obtain blast-sized cells, the bone marrow cells (BMCs) were elutriated using a Beckman J-6M centrifuge with a JE-6B elutriator rotor and a standard chamber (Beckman Coulter, Hialeah, FL). Bone marrow cells were loaded into the chamber at a flow rate of 15 mL/min, a centrifuge speed of 3000 rpm, and a maximum cell density of 1 × 10⁹ cells per elutriation. The flow rate was adjusted to 25 mL/min and 300 mL was collected (CCE-25). Red cells were lysed using ACK buffer (40 seconds at 4°C). The cells were allowed to recover in medium for 10 minutes, then washed and resuspended in phosphate-buffered saline (PBS)/0.1% bovine serum albumin (BSA), followed by treatment with FcR (2.4 G2)–blocking antibodies for 10 minutes at 4°C. The cells were stained for lineage markers (lineage antigens: B220 [RA3-6B2], CD3ϵ [500A2], TER-119, and Gr-1 [RB6-8C5]), c-Kit (2B8), and other stem cell and progenitor markers including CD34 (RAM34), CD38 (90), CD43 (S7), CD45 (104), and Thy 1.2 (30 H-12). All antibodies were from Pharmingen (San Diego, CA) and were added at 1 μg/106 cells with the cells at a density of 107/mL. Cell-antibody mixtures were kept on ice for 20 minutes followed by 2 washes with PBS/0.1% BSA. The cells were sorted using a MoFlo high-speed cell sorter (Dako Cytomation, Fort Collins, CO). Cells were gated to exclude large, granular, and lineage-positive (Linpos) cells. Viability after sorting was determined by trypan blue exclusion.
Pre–CFU-s assay
Animals were pretreated for 7 days with antibiotics prior to lethal irradiation (9.5 Gy). Purified cells were injected via tail vein. At 12 days after transplantation, the animals were killed. Their bone marrow was harvested and transplanted into secondary, lethally irradiated recipients at 1 × 10⁶ to 5 × 10⁵ cells per recipient. Spleens of both the primary and secondary recipients were harvested and placed in Tellesniczky solution (375 mL 70% ethanol, 18.75 mL glacial acetic acid, 37 mL formalin) to visualize colonies on the spleens of the recipients (CFU-s).
RAG-2–/– xtransplant assay
RAG-2–/– animals were obtained from Jackson Laboratory and were maintained in pathogen-free conditions. Animals were treated with acid water and antibiotics for 7 days prior to transplantation with CCE-25–c-Kitneg purified cells. On the day of transplantation, the animals were sublethally irradiated with 4.0 Gy. Peripheral blood was assayed for the presence of donor B220+ and CD3ϵ+ cells at weeks 2, 6, and 14 after transplantation. At 14 weeks the animals were killed and the thymuses and spleens were analyzed for the presence of donor CD3ϵ+ or B220+ cells by flow cytometry.
CFU-c
Purified CCE-25–c-Kitneg cells were plated in 35-mm tissue culture dishes in IMDM with 20% horse serum (HS), pen/strep, 0.3% Seaplaque Agarose, and the following cytokines: human erythropoietin (hEPO, 20 ng/mL), human Flt-3 (huFlt-3) ligand (200 ng/mL), human granulocyte colony-stimulating factor (hG-CSF, 50 ng/mL), human interleukin-1α (hIL-1α, 20 ng/mL), hIL-6 (50 ng/mL), hIL-11 (50 ng/mL), human leukemia inhibitory factor (hLIF, 50 ng/mL), human macrophage colony-stimulating factor (hM-CSF, 300 ng/mL), murine granulocyte-macrophage colony-stimulating factor (mGM-CSF, 20 ng/mL), mIL-3 (30 ng/mL), mSCF (100 ng/mL), murine stromal cell–derived factor 1α (mSDF-1α, 100 ng/mL), and murine thrombopoietin (mTpo, 20 ng/mL) (Peprotech, Rocky Hill, NJ). Cultures were kept at 37°C, 5% CO2. Colonies were counted after 12 days.
Liquid culture with HGFs, anti-TGFβ, or immobilized DeltaExtIgG
Purified CCE-25–c-Kitpos, CCE-25–c-KitnegSca-1pos, or CCE-25–c-KitnegSca-1neg purified cells were cultured in IMDM with 20% horse serum, and pen/strep, supplemented with 100 ng/mL mSCF and 30 ng/mL mIL-3, in combination with murine vascular endothelial growth factor (mVEGF, 100 ng/mL), murine basic fibroblast growth factor (mbFGF, 10 ng/mL), and murine endothelial growth factor (mEGF, 100 ng/mL). Alternatively, anti–transforming growth factor β (TGFβ), (clone 1D11), or an isotype-matched control, was added at a maximum of 26 μg/mL and a minimum of 0.9 μg/mL (1:3 serial dilutions) in the presence of SCF and IL-3. To activate the Notch signaling pathway, we coated plates with 10 μg/mL of either DeltaExtIgG or human immunoglobulin G (IgG; as a negative control) overnight at 4°C; the plates were then washed 5 times with PBS and blocked with culture medium (IMDM, 20% HS) in the presence of 100 ng/mL mSCF, 100 ng/mL hTpo, 50 ng/mL IL-6, and 100 ng/mL Flt-3 ligand. Cells were incubated at 37°C, 5% CO2 for 15 days and were monitored for growth throughout this time.
Tpo-LTMCs
Tpo–long-term bone marrow cultures (LTMCs) were prepared as described by Yagi et al.13 Briefly, bone marrow from C57Bl/6 animals was flushed with Fischer medium supplemented with 20% horse serum (Hyclone lot no. AHA7635), 1 μM hydrocortisone (Sigma, St Louis, MO), and pen/strep (GibcoBRL). Bone marrow cells were cultured in T-25 flasks at a density of 1 femur per flask. Cultures were supplemented with 10 ng/mL murine Tpo (R&D Systems, Minneapolis, MN). Cultures were maintained by biweekly demirepopulation.
Stromal cell lines
Cells (14F1.1) were cultured in Dulbecco modified Eagle medium (DMEM), 10% fetal calf serum (FCS). M2-10B4 cells were cultured in RPMI-1640, 5% FCS, with 500 μg/mL G418. D4T cells were cultured in IMDM with 20% FCS, supplemented with 100 μg/mL endothelial cell growth supplement (ECGS; Collaborative Biomedical Products, Bedford, MA). OMA-AD cells were cultured in minimum essential medium α (MEMα), 12% HS, 12% FCS, 10 μM β-ME. OP9 cells were cultured in MEMα, 20% FCS, 50 μM beta-mercaptoethanol (β-ME), supplemented with nonessential amino acids. S17 cells were cultured in RPMI-1640 supplemented with 10% FCS, 25 μM β-ME. All media contained pen/strep. The CCE-25–c-Kitneg–purified cell populations (Sca-1pos or Sca-1neg) were seeded onto 70% confluent stromal cell line monolayers and thereafter maintained in IMDM, 20% horse serum, and pen/strep supplemented with 100 ng/mL murine SCF and 30 ng/mL murine IL-3 (Peprotech). Transwell experiments were performed in either 12- or 6-well tissue culture plates. (0.4-μm pores; Corning, Acton, MA). Cytospins were stained with PROTOCOL Hema3 stain set (Biochemical Sciences, Swedesboro, NJ).
Results
PHSC antigen expression by CCE-25–c-Kitneg cells
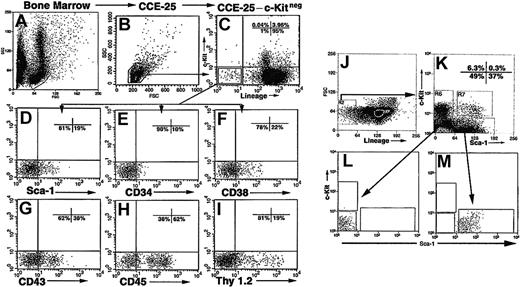
Our previous experiments10 demonstrated that CCE-25–c-Kitneg cells were heterogeneous with respect to the expression of other cell surface antigens. Therefore, we assayed the cells for the expression of antigens known to be expressed on PHSCs including Sca-1, CD34, CD38, CD43, CD45, and Thy 1.2. To purify the CCE-25–c-Kitneg cell population, we isolated mouse bone marrow (Figure 1A) and obtained small, blast-sized cells by counter current elutriation (CCE) at 25 mL/min (CCE-25) (Figure 1B). We stained the CCE-25 cells with antibodies that recognize the Lin-specific markers B220, CD3ϵ, Gr-1, TER119, as well as c-Kit (Figure 1C). We gated the population for blast-sized cells and sorted for Linnegc-Kitneg (CCE-25–c-Kitneg) cells, which we found comprise 1% of the CCE-25 population. These cells were analyzed for the expression of other progenitor markers (Figure 1C).
Isolation and purification of the CCE-25–c-Kitneg cells. Representative forward and side scatter of mouse bone marrow (A). Forward scatter (FSC) and side scatter (SSC) profile of CCE-25–c-Kitneg cells isolated by elutriation according to the procedures outlined in “Materials and methods” (B). FACS analysis of CCE-25 cells incubated with lineage- and c-Kit–specific antibodies (Lin: B220, CD3ϵ, TER-119, Gr-1) (C). The CCE-25–Linnegc-Kitneg cells were gated and examined for the expression of Sca-1 (D), CD34 (E), CD38 (F), CD43 (G), CD45 (H), and Thy 1.2 (I). CCE-25–c-Kitneg cells (J) were sorted for Sca-1pos and Sca-1neg (K) populations and their purity was verified by postsort reanalysis (L-M). Isotype-matched control background staining was subtracted from the percentages shown. These results are representative of 2 experiments.
Isolation and purification of the CCE-25–c-Kitneg cells. Representative forward and side scatter of mouse bone marrow (A). Forward scatter (FSC) and side scatter (SSC) profile of CCE-25–c-Kitneg cells isolated by elutriation according to the procedures outlined in “Materials and methods” (B). FACS analysis of CCE-25 cells incubated with lineage- and c-Kit–specific antibodies (Lin: B220, CD3ϵ, TER-119, Gr-1) (C). The CCE-25–Linnegc-Kitneg cells were gated and examined for the expression of Sca-1 (D), CD34 (E), CD38 (F), CD43 (G), CD45 (H), and Thy 1.2 (I). CCE-25–c-Kitneg cells (J) were sorted for Sca-1pos and Sca-1neg (K) populations and their purity was verified by postsort reanalysis (L-M). Isotype-matched control background staining was subtracted from the percentages shown. These results are representative of 2 experiments.
As shown in Figure 1, we observed that 19% of the cells expressed Sca-1 (Ly6-A/E) (Figure 1D), 10% were CD34pos (Figure 1E), and 22% were CD38pos cells (Figure 1F). The low number of CD34pos cells was anticipated, as c-KitposSca-1pos PHSCs also express low levels of CD34.14,15 CD43 (Ly-48, Leukosialin), which has been detected on PHSCs, has a role in cell adhesion16 and was expressed by 38% of the CCE-25–c-Kitneg population (Figure 1G). In addition, a majority of the CCE-25–c-Kitneg population (62%) was CD45pos, as anticipated, being of hematopoietic origin (Figure 1H). Surprisingly, there was a significant number of CD45neg cells as well (38%). Finally, Thy 1.2 (CD90), known to be present on PHSCs,17,18 was expressed on 19% of the c-Kitneg population (Figure 1I).
We chose to purify the CCE-25–c-Kitneg cells based on Sca-1 expression, because of the essential role that Sca-1 has in hematopoietic development.2,3,19 The CCE-25–c-KitnegSca-1pos and Sca-1neg populations were isolated by FACS and used in subsequent experiments (Figure 1J-K). The purity of these sorted cells was verified by postsort analysis (Figure 1L-M).
Pre–CFU-s activity of CCE-25–c-KitnegSca-1pos and Sca-1neg purified cells
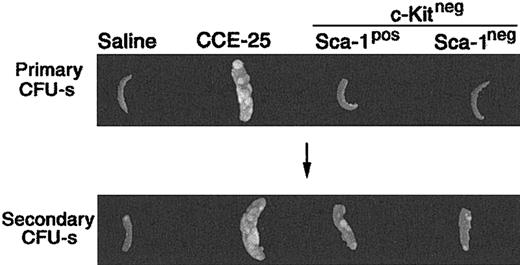
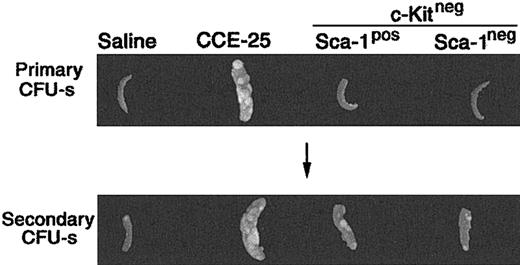
To determine whether the CCE-25–c-KitnegSca-1pos or Sca-1neg population contained PHSCs, we used the pre–CFU-s, an in vivo assay that detects primitive progenitors.4,20 For the pre–CFU-s assay, the CCE-25–c-KitnegSca-1pos or Sca-1neg cells were transplanted into lethally irradiated mice. After 12 days, the spleens were removed and placed in Tellesniczky solution to determine the number of primary CFU-s's. Bone marrow cells from these primary recipient animals were then transplanted into secondary recipients. Then 12 days later, the CFU-s of the secondary recipients was determined. As expected, the unsorted CCE-25 cells had primary CFU-s activity 12 days after transplantation, while the saline-injected controls and those animals that received CCE-25–c-Kitneg cells (with or without Sca-1) did not (Figure 2; Table 1). In the secondary recipients, the saline control, again, had no CFU-s's, while the CCE-25 recipients had spleen colonies indicating the presence of secondary pre–CFU-s, as anticipated. The average pre–CFU-s activity for the CCE-25–c-KitnegSca-1pos populations was 10.8 pre–CFU-s per 1 × 10⁵ cells, while the average activity for the Sca-1neg population was 8.6 pre–CFU-s per 1 × 10⁵ cells. Therefore, both the CCE-25–c-KitnegSca-1pos cells and the Sca-1neg cells had roughly equivalent pre–CFU-s activity in this assay, indicating the presence of stem cells in both populations.
Pre–CFU-s activity of the purified CCE-25–c-Kitneg cell populations. CCE-25–c-KitnegSca-1pos and Sca-1neg populations were isolated as described in “Materials and methods.” The purified cell populations were transplanted into lethally irradiated mice. After 12 days, the animals were killed. Their spleens were fixed in Tellesniczky solution to visualize spleen colonies (Primary CFU-s). Whole bone marrow from these primary recipients was transplanted into lethally irradiated secondary recipients. After 12 days, spleens from secondary recipients were fixed in Tellesniczky solution (Secondary CFU-s). These results are representative of 3 experiments.
Pre–CFU-s activity of the purified CCE-25–c-Kitneg cell populations. CCE-25–c-KitnegSca-1pos and Sca-1neg populations were isolated as described in “Materials and methods.” The purified cell populations were transplanted into lethally irradiated mice. After 12 days, the animals were killed. Their spleens were fixed in Tellesniczky solution to visualize spleen colonies (Primary CFU-s). Whole bone marrow from these primary recipients was transplanted into lethally irradiated secondary recipients. After 12 days, spleens from secondary recipients were fixed in Tellesniczky solution (Secondary CFU-s). These results are representative of 3 experiments.
CCE-25–c-Kitneg transplantation into RAG-2–/– mice
We also compared an alternative in vivo environment that subjected the CCE-25–c-Kitneg cells with a different selective pressure than the pre–CFU-s assay. In particular, we examined the ability of the CCE-25–c-Kitneg cells to reconstitute the lymphoid deficiency in RAG-2–/– (recombination activating gene–2 knock-out) mice. Based on our previous studies, we knew the CCE-25–c-Kitneg population can give rise to lymphoid cells in vivo, 10 to 12 months after transplantation.10 We hypothesized that the lack of mature lymphoid cells in these animals would create an environment that would selectively pressure the CCE-25–c-Kitneg cells to develop quickly. To test this, whole bone marrow cells (wBMCs), used as a positive control, or purified CCE-25–c-KitnegSca-1pos or Sca-1neg cells were injected into sublethally irradiated (4.0 Gy) RAG-2–/– mice. The peripheral blood of the mice was tested for the presence of donor (Ly 5.2pos) T cells (CD3ϵpos) and B cells (B220pos) beginning 2 weeks after transplantation and subsequently monitored through 14 weeks. Animals that received whole bone marrow as a positive control showed both T- and B-cell reconstitution; however, no donor cells were detected in the peripheral blood of animals that received transplants of purified CCE-25–c-KitnegSca-1pos or Sca-1neg cells (data not shown). After 3.5 months, thymuses and spleens were harvested and analyzed for the presence of donor cells (Ly 5.2). Animals that received whole bone marrow had thymic reconstitution by donor cells (23%) (Figure 3B), but animals that received CCE-25–c-KitnegSca-1pos or Sca-1neg cells did not show any thymic engraftment (Figure 3C and 3D, respectively). Analysis of the spleens gave the same result (data not shown). These data indicate that the selective pressure to correct the lymphoid deficiency in these animals was insufficient to induce the proliferation and maturation of the CCE-25–c-Kitneg cells.
Purified CCE-25–c-Kitneg cell growth in RAG-2–/– mice. CCE-25–c-KitnegSca-1pos and Sca-1neg cells were purified by elutriation and cell sorting as described in “Materials and methods.” These cells were transplanted into sublethally irradiated RAG-2–/– mice (4.0 Gy). At 14 weeks after transplantation, the thymuses were harvested and assayed for the presence of donor (Ly 5.2) thymocytes (CD3ϵ). Animals received transplants of saline (A), 1 × 10⁶ whole bone marrow (wBMC, positive control) (B), 1 × 10³ CCE-25–c-KitnegSca-1pos (C), or 1 × 10³ CCE-25–c-KitnegSca-1neg cells (D). These results are representative of 5 animals per group and 2 separate experiments.
Purified CCE-25–c-Kitneg cell growth in RAG-2–/– mice. CCE-25–c-KitnegSca-1pos and Sca-1neg cells were purified by elutriation and cell sorting as described in “Materials and methods.” These cells were transplanted into sublethally irradiated RAG-2–/– mice (4.0 Gy). At 14 weeks after transplantation, the thymuses were harvested and assayed for the presence of donor (Ly 5.2) thymocytes (CD3ϵ). Animals received transplants of saline (A), 1 × 10⁶ whole bone marrow (wBMC, positive control) (B), 1 × 10³ CCE-25–c-KitnegSca-1pos (C), or 1 × 10³ CCE-25–c-KitnegSca-1neg cells (D). These results are representative of 5 animals per group and 2 separate experiments.
CCE-25–c-Kitneg CFU-c's with multiple HGFs
Although we and others have shown that CCE-25–c-Kitneg cells do not respond to multiple combinations of HGFs in vitro,10 we asked whether other HGFs not previously tested could promote the growth and survival of FACS-purified CCE-25–c-KitnegSca-1pos or Sca-1neg cells. To examine the growth of the CCE-25–c-KitnegSca-1pos and Sca-1neg populations in vitro, we purified the cells as previously described, and then plated them in soft agar (CFU-c) with multiple growth factors, including the following: EPO, Flt-3 ligand, G-CSF, IL-1α, IL-6, IL-11, LIF, M-CSF, GM-CSF, IL-3, and SCF. CFU-c's were counted 12 days after plating. The novel growth factors we had not previously tested were Tpo and SDF-1α. The data show that the CCE-25–c-KitnegSca-1pos cells give rise to an occasional, small colony, while the Sca-1neg cells do not grow in response to these factors (Table 2). This observation supports the following conclusions. First, that c-Kitpos cells did not contaminate the sorted c-KitnegSca-1neg or Sca-1pos populations, because they would have formed large, hyperproliferative colonies in the presence of SCF and IL-3 and multiple HGFs,10 as observed in the positive control. Second, the expanded HGF repertoire tested in these experiments was not sufficient to induce significant CFU-c's by the CCE-25–c-Kitneg purified cells. We also found that EGF, bFGF, and VEGF in combination with SCF and IL-3 were insufficient to promote in vitro growth of the CCE-25–c-KitnegSca-1pos or Sca-1neg cells in liquid cultures (data not shown).
Because TGFβ is known to act as an autocrine inhibitor of PHSC proliferation,21,22 we tested the ability of anti-TGFβ antibodies to promote the growth of the CCE-25–c-KitnegSca-1pos and Sca-1neg purified cells. To interrupt TGFβ autocrine signaling and to determine if this interruption was sufficient to induce c-Kit expression and subsequent proliferation of these cells, the purified CCE-25–c-KitnegSca-1pos or Sca-1neg cells were incubated with anti-TGFβ (clone 1D11) antibodies along with SCF and IL-3 in liquid cultures for 15 days. However, while the CCE-25–c-Kitpos cells, used as a positive control, grew well under these conditions, the CCE-25–c-KitnegSca-1pos and Sca-1neg cells did not (data not shown). Similarly, activation of the Notch signaling pathway was shown to promote the growth of PHSCs,23-25 yet treatment of the CCE-25–c-KitnegSca-1pos or Sca-1neg cells with an activator of Notch signaling, DeltaExtIgG (Varnum-Finney et al26,27 ) (in the presence of SCF, Tpo, Flt-3 ligand, and IL-6), did not induce proliferation of these purified cells. Thus, the multi-HGFs, anti-TGFβ and DeltaExtIgG failed to stimulate in vitro growth of the CCE-25–c-Kitneg cell populations.
CCE-25–c-KitnegSca-1pos and Sca-1neg growth and maturation in modified long-term bone marrow cultures
To define the conditions that regulate the maturation of the CCE-25–c-Kitneg cells to c-Kitpos cells in vitro, we tracked donor cell development in primary long-term bone marrow cultures (LTMCs). We used a modified long-term bone marrow culture, the thrombopoietin (Tpo)–LTMC, instead of the traditional (Dexter) LTMC, because it has been shown to support high levels of c-Kitpos PHSC production.13 These cultures differ from the traditional long-term bone marrow culture in that they are maintained at 37°C, and their media contain 10 ng/mL Tpo, which is replenished during biweekly demirepopulation.
We evaluated the growth and maturation of purified CCE-25–c-Kitpos, –c-KitnegSca-1pos, or –c-KitnegSca-1neg (Ly 5.2) on Tpo-LTMC stromal layers established from the bone marrow of Ly 5.1 mice. The Tpo-LTMCs were allowed to develop for 4 weeks to establish stromal layers, after which they were irradiated to stop cell division, and nonadherent cells were removed. We added purified CCE-25–c-KitnegSca-1pos or Sca-1neg cells to the Tpo-LTMC stromal layers and the cultures were monitored for growth. After 25 days the entire contents of the cultures were harvested and examined for the presence of donor (Ly 5.2) c-Kitpos cells, as well as myeloid (Mac-1, Gr-1, and F4/80) and lymphoid (B220, CD3ϵ) cells by flow cytometry.
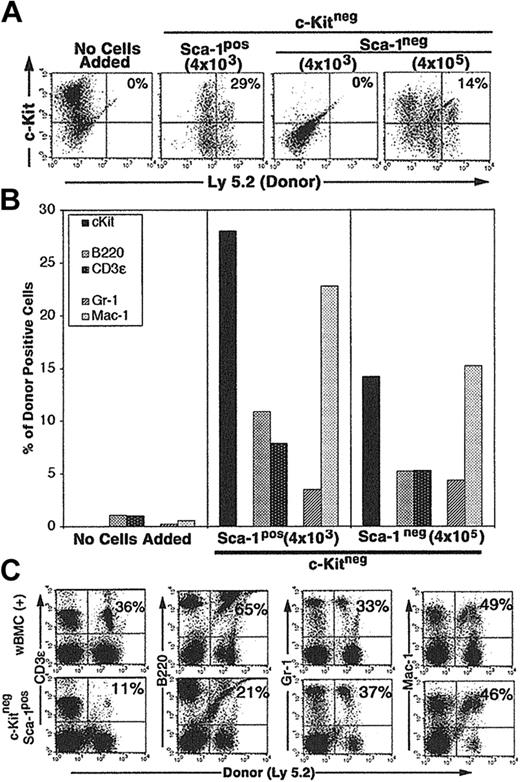
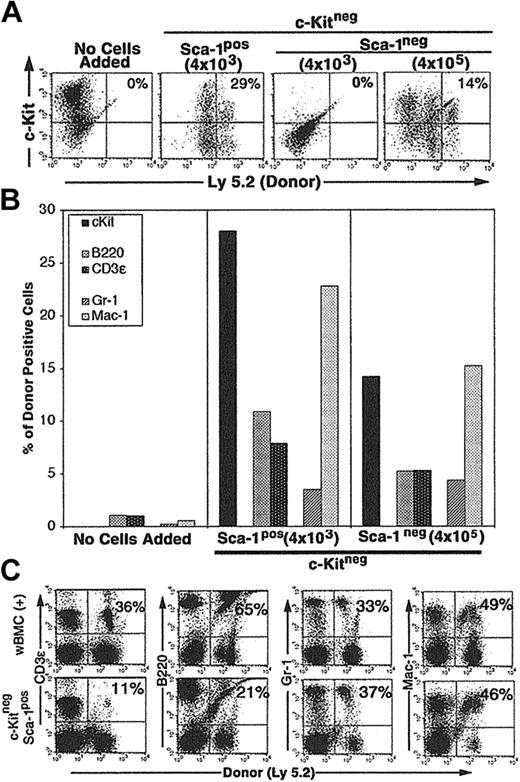
CCE-25–c-KitnegSca-1pos cells (4 × 10³) cultured on Tpo-LTMCs generated c-Kitpos (Ly 5.2pos) cells that remained present over the 25-day culture period (29%) (Figure 4A). In addition, the CCE-25–c-KitnegSca-1pos produced lymphoid (11% B220pos, 7% CD3ϵpos) (Figure 4B, middle panel) and myeloid (3% Gr-1pos, 23% Mac-1pos) cells (Figure 4B, middle panel). We observed variation in the final numbers of donor cells per flask. This may be due to the fact that the Tpo-LTMCs were primary, nonclonal cultures that were maintained for an extended period and supported different levels of donor cell proliferation. However, the capacity of the CCE-25–c-Kitneg cells to develop in to both lymphoid and myeloid cells was observed in multiple flasks in replicate experiments. The CCE-25–c-KitnegSca-1pos cells expanded approximately 80-fold (data not shown). In contrast, when the same number (4 × 10³) of CCE-25–c-KitnegSca-1neg cells was added to Tpo-LTMC stroma, no growth was observed. However, when 100-fold more Sca-1neg cells were added (4 × 10⁵), 14% of the donor (Ly 5.2)–derived cells were c-Kitpos after 35 days in culture; Figure 4A (right panels) shows lymphoid cells (5% B220pos, 5% CD3ϵpos) and Figure 4B (right panel), myeloid cells (4% Gr-1pos, 15% Mac-1pos). Therefore, these data yield 2 conclusive results: (1) the CCE-25–c-KitnegSca-1pos compartment is enriched for cells that grow on the Tpo-LTMC stroma, and (2) the Tpo-LTMC supports the transition of the c-Kitneg cells to c-Kitpos cells.
Purified CCE-25–c-KitnegSca-1pos and Sca-1neg cell growth on Tpo-LTMC stroma. Tpo-LTMCs were established according to procedures outlined in “Materials and methods.” Tpo-LTMCs (4-week-old; Ly 5.1 marked) were irradiated (13.0 Gy), nonadherent cells were removed, and the remaining stromal layers were seeded with purified, Ly 5.2pos, whole bone marrow (positive control), CCE-25–c-KitnegSca-1pos, or Sca-1neg cells. (A) Flow cytometry for c-Kit and “donor” (Ly 5.2) cells after 25 days of culture. Panels are representative of 2 flasks per group in 2 separate experiments. (B) Lineage composition of CCE-25–c-Kitneg (donor, Ly 5.2) cells grown in the Tpo-LTMCs. After 25 days of culture, the contents of the Tpo-LTMCs ± purified CCE-25–c-Kitneg (Ly 5.2) cells were analyzed by flow cytometry for Ly 5.2– and lineage-specific markers. Left panel: Tpo-LTMCs alone; middle panel: 4 × 10³ CCE-25–c-KitnegSca-1pos cells; and right panel: 4 × 10⁵ CCE-25–c-KitnegSca-1neg cells. Data shown are from 1 flask, which represent 2 flasks per group in 2 separate experiments. (C) Cells from the Tpo-LTMC stromal layers were harvested 25 days after CCE-25–c-KitnegSca-1pos (Ly 5.2) seeding and then transplanted into lethally irradiated (9.5 Gy) Ly 5.1 recipients with 2 × 10⁵ wBMC competitive host marrow. Peripheral blood was assayed for the presence of donor lymphoid (CD3ϵ and B220) and myeloid (Gr-1 and Mac-1) cells by flow cytometry as described in “Materials and methods.” The top panels show the distribution of donor-derived cells from animals that received transplants of 2 × 10⁵ whole bone marrow cells (positive control). The percentages in the upper right corners of the dot plots represent the number of donor cells in the Linpos cell population. For these analyses, background staining, indicated by staining with isotype-matched controls, was subtracted to yield the percentage of cells shown on the dot plots.
Purified CCE-25–c-KitnegSca-1pos and Sca-1neg cell growth on Tpo-LTMC stroma. Tpo-LTMCs were established according to procedures outlined in “Materials and methods.” Tpo-LTMCs (4-week-old; Ly 5.1 marked) were irradiated (13.0 Gy), nonadherent cells were removed, and the remaining stromal layers were seeded with purified, Ly 5.2pos, whole bone marrow (positive control), CCE-25–c-KitnegSca-1pos, or Sca-1neg cells. (A) Flow cytometry for c-Kit and “donor” (Ly 5.2) cells after 25 days of culture. Panels are representative of 2 flasks per group in 2 separate experiments. (B) Lineage composition of CCE-25–c-Kitneg (donor, Ly 5.2) cells grown in the Tpo-LTMCs. After 25 days of culture, the contents of the Tpo-LTMCs ± purified CCE-25–c-Kitneg (Ly 5.2) cells were analyzed by flow cytometry for Ly 5.2– and lineage-specific markers. Left panel: Tpo-LTMCs alone; middle panel: 4 × 10³ CCE-25–c-KitnegSca-1pos cells; and right panel: 4 × 10⁵ CCE-25–c-KitnegSca-1neg cells. Data shown are from 1 flask, which represent 2 flasks per group in 2 separate experiments. (C) Cells from the Tpo-LTMC stromal layers were harvested 25 days after CCE-25–c-KitnegSca-1pos (Ly 5.2) seeding and then transplanted into lethally irradiated (9.5 Gy) Ly 5.1 recipients with 2 × 10⁵ wBMC competitive host marrow. Peripheral blood was assayed for the presence of donor lymphoid (CD3ϵ and B220) and myeloid (Gr-1 and Mac-1) cells by flow cytometry as described in “Materials and methods.” The top panels show the distribution of donor-derived cells from animals that received transplants of 2 × 10⁵ whole bone marrow cells (positive control). The percentages in the upper right corners of the dot plots represent the number of donor cells in the Linpos cell population. For these analyses, background staining, indicated by staining with isotype-matched controls, was subtracted to yield the percentage of cells shown on the dot plots.
To determine if the CCE-25–c-KitnegSca-1pos cells generated cells capable of multilineage reconstitution, a characteristic of the c-Kitpos PHSCs, we cultured the CCE-25–c-KitnegSca-1pos cells on Tpo-LTMC stroma for 25 days and then transplanted them into lethally irradiated Ly 5.1 recipients, along with host support marrow (the CCE-25–c-KitnegSca-1neg cells grown on Tpo-LTMC did not generate enough cells to transplant). Peripheral blood of the recipients was assayed by flow cytometry for the presence of donor lymphoid and myeloid cells 3.5 months after transplantation. The animals that received whole bone marrow, a positive control for transplantation, showed an average of 50% donor reconstitution, as expected for this assay (Figure 4C, top panels). Specifically, 36% of the T (CD3ϵpos) cells and 65% of the B (B220pos) cells were of donor (Ly 5.2) origin, while in the myeloid lineages, 33% of the Gr-1pos cells and 49% of the Mac-1pos cells were donor derived. In comparison, when CCE-25–c-KitnegSca-1pos cells grown for 25 days on Tpo-LTMC stroma were transplanted, they gave rise to multilineage reconstitution. As shown in Figure 4 (bottom panels), 11% of the CD3ϵpos cells and 21% of the B220pos cells were of donor origin, while 37% of the Gr-1pos and 46% of the Mac-1pos cells were of donor origin. These data illustrate the ability of the Tpo-LTMCs to support the CCE-25–c-KitnegSca-1pos cells to generate PHSCs capable of producing multiple lineages, in vitro and in vivo. Taken together, these data indicate the Sca-1pos population contains more cells with PHSC activity in vitro. Furthermore, this is the first identification of in vitro culture conditions capable of supporting the maturation of CCE-25–c-KitnegSca-1pos cells to c-Kitpos PHSCs.
CCE-25–c-KitnegSca-1pos and Sca-1neg growth on stromal cell lines
To determine if stromal cell lines could support the growth of the CCE-25–c-KitnegSca-1pos and Sca-1neg cells, we cocultured the purified populations on D4T,28 OP9,29 14F1.1,30 S17,31 M2-10B4,32 or OMA-AD cell lines known to support hematopoietic growth in vitro. We consistently observed that 10- to 100-fold less Sca-1pos cells than Sca-1neg cells were required to observe growth (data not shown), similar to the difference observed in the Tpo-LTMCs. The CCE-25–c-KitnegSca-1pos or Sca-1neg cells were cocultured in direct contact with stromal cell lines, and were maintained by biweekly feeding over a 25-day period. We observed significant differences in the ability of these stromal cell lines to support the growth of the CCE-25–c-KitnegSca-1pos or Sca-1neg cells. For example, we found that it was necessary to add a minimum of 1 × 10⁵ CCE-25–c-KitnegSca-1pos or Sca-1neg cells to detect growth in OP9 cocultures, while the S17 and 14F1.1 lines required only 1 × 10⁴ CCE-25–c-KitnegSca-1pos or Sca-1neg cells (data not shown). In contrast, far fewer c-KitnegSca-1pos or Sca-1neg cells were required for growth on the OMA-AD or M2-10B4 cell lines (500 to 1000 cells). This showed that stromal cell lines varied significantly in their capacity to support CCE-25–c-KitnegSca-1pos and Sca-1neg cell growth and suggests that the OMA-AD and M2-10B4 stromal lines have the capacity to support the growth of dormant PHSCs better than the other lines tested.
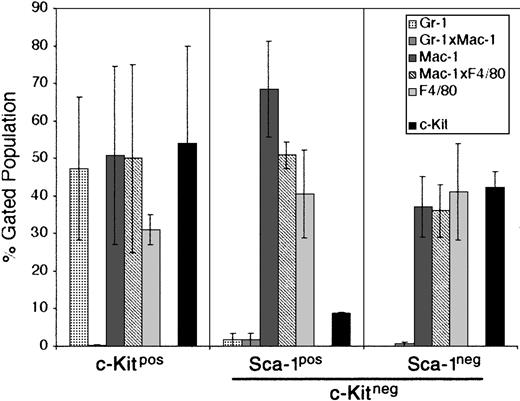
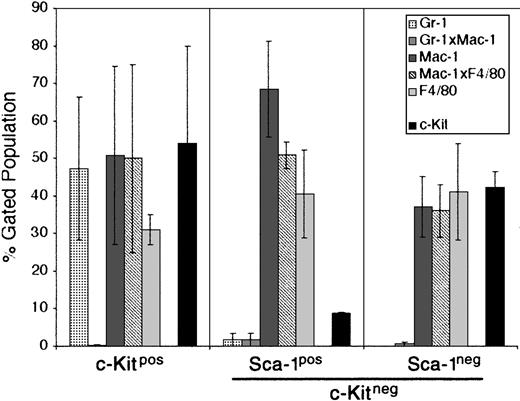
For this reason, we chose the M2-10B4 stromal cell line for further study. This cell line has been engineered to express human IL-3 and human G-CSF.32 While human IL-3 does not cross-react with the mouse IL-3 receptor, human G-CSF does cross-react and could promote the growth of developing PHSCs. The CCE-25–c-KitnegSca-1pos and Sca-1neg cells were cocultured with the M2-10B4 cells for 25 days in the presence of SCF and IL-3. The data shown in Figure 5 are an average of 2 separate experiments. CCE-25–c-Kitpos cells were used as a positive control for development, and matured into monocytic cells (50% Mac-1pos, 31% F4/80pos) and maintained a population of c-Kitpos cells (47.5%) as shown in Figure 5 (left panel). The CCE-25–c-KitnegSca-1pos gave rise to 68% monocytic cells (Mac-1pos), 40% macrophages (F4/80pos), and very few c-Kitpos cells (7%) (Figure 5, middle panel). These cells expanded approximately 100-fold, from 1.4 × 10⁴ cells to 1.6 × 10⁶ cells. In comparison, the CCE-25–c-KitnegSca-1neg cells generated a lower percentage of monocytic cells (37%) but produced a similar proportion of macrophages (41% F4/80pos). The CCE-25–c-KitnegSca-1neg cells expanded approximately 70-fold, from 1.4 × 10⁴ cells to 1.0 × 10⁶ cells. These data show that the M2-10B4 stromal cell line supports the maturation of the CCE-25–c-Kitneg cells to grow into heterogeneous populations of myeloid lineage cells.
CCE-25–c-KitnegSca-1pos and Sca-1neg cell growth in “contact” M2-10B4 cocultures. Purified CCE-25–c-KitnegSca-1pos and Sca-1neg cells were added to M2-10B4 monolayers and were cocultured for 25 days with biweekly feeding in the presence of 100 ng/mL SCF and 30 ng/mL IL-3. Cells were harvested and stained as described in “Materials and methods.” The bars represent the percentages of granulocytes (Gr-1), monocytic cells (Mac-1), and/or macrophages (F4/80), as well as c-Kitpos cells as indicated, minus the background contributed by the isotype-matched controls. Left panel: CCE-25–c-Kitpos cells were used as a positive control for growth. Middle panel: CCE-25–c-KitnegSca-1pos cells. Left panel: CCE-25–c-KitnegSca-1neg cells. For these analyses, background staining, indicated by staining with isotype-matched controls, was subtracted to yield the percentages shown. Values were calculated by averaging the data from 2 separate experiments. Error bars indicate the standard error between experiments. These data are representative of 3 wells per group per experiment in 3 experiments.
CCE-25–c-KitnegSca-1pos and Sca-1neg cell growth in “contact” M2-10B4 cocultures. Purified CCE-25–c-KitnegSca-1pos and Sca-1neg cells were added to M2-10B4 monolayers and were cocultured for 25 days with biweekly feeding in the presence of 100 ng/mL SCF and 30 ng/mL IL-3. Cells were harvested and stained as described in “Materials and methods.” The bars represent the percentages of granulocytes (Gr-1), monocytic cells (Mac-1), and/or macrophages (F4/80), as well as c-Kitpos cells as indicated, minus the background contributed by the isotype-matched controls. Left panel: CCE-25–c-Kitpos cells were used as a positive control for growth. Middle panel: CCE-25–c-KitnegSca-1pos cells. Left panel: CCE-25–c-KitnegSca-1neg cells. For these analyses, background staining, indicated by staining with isotype-matched controls, was subtracted to yield the percentages shown. Values were calculated by averaging the data from 2 separate experiments. Error bars indicate the standard error between experiments. These data are representative of 3 wells per group per experiment in 3 experiments.
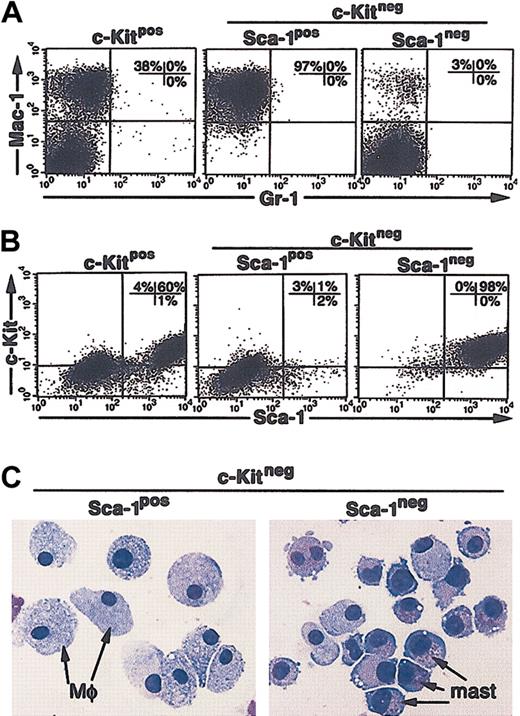
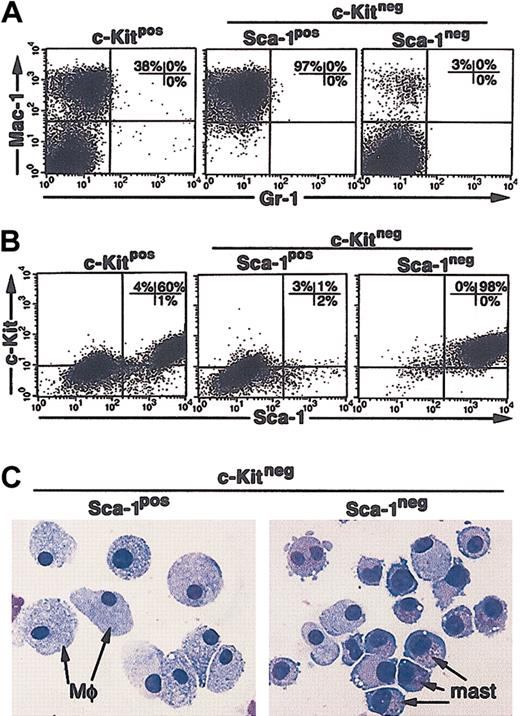
To determine if the soluble growth factors produced by the M2-10B4 cells alone were sufficient to support the growth of the CCE-25–c-KitnegSca-1pos or Sca-1neg cells, we separated the purified c-Kitneg cells from direct contact with the stromal cells using transwell inserts. Under these “noncontact” conditions, the CCE-25–c-Kitpos population, again used as a positive control for cell growth, generated both monocytic cells (Mac-1pos) (Figure 6A, left panel) and c-KitposSca-1pos cells (Figure 6B, left panel). The CCE-25–c-KitnegSca-1pos cells gave rise to exclusively Mac-1pos cells in these “noncontact” cultures (97%; Figure 6A, middle panel). A starting population of 1.4 × 10⁴ cells expanded to 2.2 × 10⁶ cells, a 150-fold expansion, similar to that seen in the direct contact cultures. In contrast, the CCE-25–c-KitnegSca-1neg cells developed into a homogeneous population of c-KitposSca-1pos cells (Figure 6B, right panel). These cells also expanded significantly, as 4.5 × 10⁶ cells grew from a starting population of 1.4 × 10⁴ cells. To determine if c-KitposSca-1pos cells produced by noncontact culture with the M2-10B4 cells were PHSCs, we cytospun the cells and found they had become predominantly mast cells, not c-Kitpos PHSCs (Figure 6C, right panel). Transplantation and CFU-c assays confirmed that the c-KitposSca-1pos cells grown from the CCE-25–c-KitnegSca-1neg cells do not contain c-Kitpos PHSC activity (data not shown). Altogether these data show that we identified several stromal cell lines that support c-Kitneg cell growth and that we observed the Sca-1pos cells consistently grew at lower cell densities than the Sca-1neg cells. We showed that soluble factors produced by the M2-10B4 cells were sufficient to promote the maturation of the CCE-25–c-KitnegSca-1pos cells into macrophages and the Sca-1neg cells to mast cells. In addition, the data show the maturation of c-Kitneg cells can be mediated by cell-associated factors, as shown by the heterogeneity of the cells that matured in direct contact cultures.
CCE-25–c-KitnegSca-1pos and Sca-1neg cell growth in “noncontact” M2-10B4 cocultures. Purified CCE-25–c-KitnegSca-1pos and Sca-1neg cells were added to M2-10B4 monolayers and were cocultured in transwells over M2-10B4 monolayers for 25 days with biweekly feeding in the presence of 100 ng/mL SCF and 30 ng/mL IL-3. Cells were harvested and stained as described in “Materials and methods.” (A) Flow cytometry for myeloid lineage markers Gr-1 and Mac-1. (B) Flow cytometry for PHSC markers c-Kit and Sca-1. These data are representative of 3 points per group in 3 separate experiments. For these analyses, background staining, indicated by staining with isotype-matched controls, was subtracted to yield the percentages shown on the dot plots. (C) The morphology of CCE-25–c-KitnegSca-1pos and Sca-1neg cells grown in “noncontact” M2-10B4 cultures over time. Photomicrographs of purified CCE-25–c-KitnegSca-1pos and Sca-1neg cells that were cocultured in transwells over M2-10B4 monolayers for 25 days with biweekly feeding in the presence of 100 ng/mL SCF and 30 ng/mL IL-3. Cells were harvested and stained as described in “Materials and methods.” At 18 days after seeding, cells were harvested and cytospun. Mφ indicates macrophage morphology; mast, mast cell morphology.
CCE-25–c-KitnegSca-1pos and Sca-1neg cell growth in “noncontact” M2-10B4 cocultures. Purified CCE-25–c-KitnegSca-1pos and Sca-1neg cells were added to M2-10B4 monolayers and were cocultured in transwells over M2-10B4 monolayers for 25 days with biweekly feeding in the presence of 100 ng/mL SCF and 30 ng/mL IL-3. Cells were harvested and stained as described in “Materials and methods.” (A) Flow cytometry for myeloid lineage markers Gr-1 and Mac-1. (B) Flow cytometry for PHSC markers c-Kit and Sca-1. These data are representative of 3 points per group in 3 separate experiments. For these analyses, background staining, indicated by staining with isotype-matched controls, was subtracted to yield the percentages shown on the dot plots. (C) The morphology of CCE-25–c-KitnegSca-1pos and Sca-1neg cells grown in “noncontact” M2-10B4 cultures over time. Photomicrographs of purified CCE-25–c-KitnegSca-1pos and Sca-1neg cells that were cocultured in transwells over M2-10B4 monolayers for 25 days with biweekly feeding in the presence of 100 ng/mL SCF and 30 ng/mL IL-3. Cells were harvested and stained as described in “Materials and methods.” At 18 days after seeding, cells were harvested and cytospun. Mφ indicates macrophage morphology; mast, mast cell morphology.
Discussion
The requirements for the growth and maturation of the CCE-25–c-Kitneg cell have been difficult to identify because of its slow growth in vivo and an apparent inability to grow in vitro. Studies by our laboratory and others have shown this population does not form CFU-c's in the presence of multi-HGF combinations, does not have primary CFU-s activity, but, importantly, does have the capacity for delayed multilineage reconstitution, demonstrating PHSC potential.10,33-35 In this report, we identified in vitro conditions that support the growth and maturation of CCE-25–c-KitnegSca-1pos PHSCs to c-Kitpos PHSCs and multilineage maturation (Tpo-LTMC) and conditions that support rapid myeloid differentiation (M2-10B4 stromal cell line). In addition, we found that the CCE-25–c-KitnegSca-1pos cells had greater growth potential than the Sca-1neg cells in vitro. The purification of the CCE-25–c-Kitneg cells and identification of alternative in vitro growth conditions enabled us to document the development of these primitive PHSCs and provides the foundation for future study of the factors that control their maturation.
In this study, we examined the heterogeneity of the CCE-25–c-Kitneg population using known stem and progenitor cell markers. Another technique used to purify stem and progenitor cells is isolation of the Hoechst side population (SP). The Hoechst SP from murine bone marrow has been characterized as predominantly Linneg, c-Kitpos, Sca-1pos, and CD45pos.36,37 Cohler et al have reported that LinnegSca-1posc-Kitneg cells do not lie in the Hoechst SP.33 Based on these observations we speculate that most of the CCE-25–c-Kitneg population is not in the SP. However, it is possible that a small percentage of the CCE-25–c-Kitneg population could be found within the Hoechst SP.
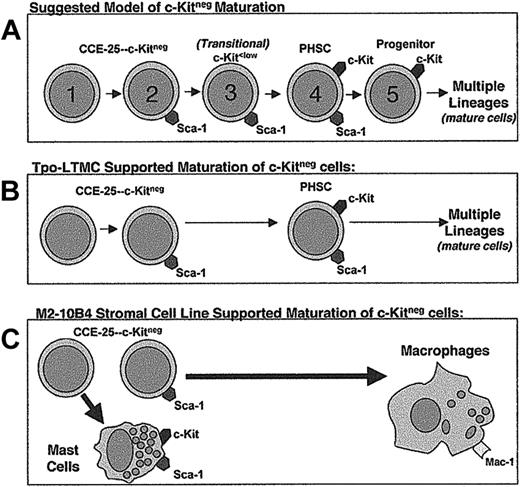
We used Sca-1 as the basis for further purification of the c-Kitneg population, because c-Kitpos PHSCs are known to express Sca-1,2,3 and a recent study using Sca-1–/– mice clearly shows the essential nature of Sca-1 in hematopoietic development.19 Although both populations have stem cell activity as indicated by the pre–CFU-s assay, because the Sca-1pos cells proliferated at lower seeding densities in vitro than the Sca-1neg cells, we propose the CCE-25–c-KitnegSca-1neg cells are more dormant than the CCE-25–c-KitnegSca-1pos cells and precede them in the PHSC maturation pathway (Figure 7A). If the CCE-25–c-KitnegSca-1neg cells precede the Sca-1pos cells in the maturation pathway, the requirement for more cells could be due to the CCE-25–c-KitnegSca-1neg cells being more dormant, or there may simply be fewer cells capable of responding to the growth signals in these cultures. It is also possible that the Sca-1neg cells may be a separate PHSC population that is developmentally independent of the Sca-1pos cells. Regardless, the fact that Sca-1neg cells can give rise to c-Kitpos cells in the Tpo-LTMC suggests that these cells have PHSC potential like the Sca-1pos cells.
Proposed models for the c-Kitneg PHSC maturation pathway and maturation in the in vitro growth conditions tested in this study. (A) Suggested model of c-Kitneg to c-Kitpos maturation. (B) Model of Tpo-LTMCs–supported c-Kitneg maturation. (C) Model of M2-10B4–driven c-Kitneg maturation.
Proposed models for the c-Kitneg PHSC maturation pathway and maturation in the in vitro growth conditions tested in this study. (A) Suggested model of c-Kitneg to c-Kitpos maturation. (B) Model of Tpo-LTMCs–supported c-Kitneg maturation. (C) Model of M2-10B4–driven c-Kitneg maturation.
In the process of determining whether the CCE-25–c-KitnegSca-1pos or the Sca-1neg cells were enriched for PHSC activity, we compared 2 transplantation models for their ability to support the rapid maturation of CCE-25–c-Kitneg cells in vivo. The pre–CFU-s assay indicated the presence of PHSCs in both the c-KitnegSca-1pos and Sca-1neg populations. However, this assay depends upon serial transplantation of the cells through 2 lethally irradiated recipients, which should put extreme pressure on all PHSCs present to develop. This level of developmental pressure may explain the fact that both the CCE-25–c-KitnegSca-1pos and Sca-1neg populations gave rise to similar numbers of secondary CFU-s per 1 × 10⁵ cells transplanted. Therefore, we wanted to determine if the CCE-25–c-KitnegSca-1pos or Sca-1neg cells would respond to a more selective hematopoietic pressure, generated by the absence of mature lymphoid cells, as in RAG-2–/– mice. Because there was no donor reconstitution in the RAG-2–/– animals that received transplants of the CCE-25–c-KitnegSca-1pos or Sca-1neg cells, the pressure for the transplanted cells to develop was insufficient to induce proliferation by these cells, or the CCE-25-c-Kitneg cells are predisposed to become myeloid cells in the RAG-2–/– model. Alternatively, it is also possible that the reconstitution kinetics in RAG-2–/– mice are similar to the traditional transplantation assay,10 making it ineffective to rapidly assay CCE-25–c-Kitneg cell growth.
Therefore, to better understand the conditions responsible for the growth of these dormant c-Kitneg cells, we sought in vitro models. The novel HGFs tested in this study, Tpo,38 SDF-1α,39-41 TGFβ-blocking antibodies,21,22,42-44 and DeltaExtIgG, an activator of the Notch signaling pathway,23-27 did not promote significant growth of the CCE-25–c-KitnegSca-1pos or Sca-1neg cells. Jagged, another ligand known to activate the Notch signaling pathway, has not been tested with the CCE-25–c-Kitneg cells. In addition, there are other mediators that have been reported to promote the development of primitive cells, specifically, the bone morphogenic proteins,45 which remain to be evaluated. Therefore, we conclude that an unidentified growth factor or combination of multiple growth factors is required to induce CCE-25–c-KitnegSca-1pos and Sca-1neg cell growth.
When cultured on Tpo-LTMC stroma, the CCE-25–c-KitnegSca-1pos population gave rise to cells capable of multilineage reconstitution, a property of the c-Kitpos PHSCs46 (Figure 7B). These are the first in vitro conditions identified that support growth of these cells, and as such is an important first step toward understanding the nature of the environment that is required for these cells to proliferate. In the context of c-Kitneg development, the Tpo-LTMC data suggest that the CCE-25–c-KitnegSca-1neg cell is the ancestor of the c-KitposSca-1pos PHSC. We believe that the c-Kitneg cell transitions through a c-Kitlow stage8,11,12,47 as it matures to a c-Kitpos cell (Figure 7A). In addition, the Tpo-LTMC provides an in vitro environment that contains a complex milieu of uncharacterized secreted, membrane-bound, and extracellular matrix factors similar to those that are present in an irradiated recipient in vivo. However, it is due to the complexity of these cultures that the factors responsible for c-Kitneg growth are difficult to identify using this system. Future studies may depend upon establishment of a stromal cell line from the Tpo-LTMCs, which could support the expansion of primitive cells without promoting differentiation.
In addition to our experiments with the primary stroma from the Tpo-LTMCs, we compared 6 previously cloned stromal cell lines for their ability to support the growth of the CCE-25–c-KitnegSca-1pos and Sca-1neg cells. While all of the cell lines tested have been shown to support in vitro hematopoiesis, our results indicate the M2-10B4 and OMA-AD lines are superior in their ability to produce the factors necessary to induce development of the CCE-25–c-Kitneg cells. Specifically, factors secreted by the M2-10B4 cells promote growth of these cells, but do so without supporting a self-renewing c-Kitpos PHSC population, unlike the Tpo-LTMCs (Figure 7C). The M2-10B4 stromal cells may produce maturation signals at concentrations that promote the terminal differentiation of the CCE-25–c-Kitneg cells. For example, the presence of the hG-CSF, produced by the M2-10B4, in combination with mSCF and mIL-3 may force the PHSCs that develop from the CCE-25–c-KitnegSca-1pos and Sca-1neg cells to mature completely. Yet, we know that G-CSF alone or in combination with a multiple growth factor cocktail is insufficient to induce growth of the CCE-25–c-KitnegSca-1pos or Sca-1neg cells. A comparison of the genes expressed by the Tpo-LTMC stroma, or by a Tpo-LTMC stromal cell line, and the M2-10B4 stromal cell line could identify the factors that promote the self-renewal of primitive PHSCs in vitro, which would be a valuable tool for ex vivo expansion of primitive hematopoietic stem cells.
Taken together, our findings and those of others suggest that the CCE-25–c-KitnegSca-1pos cell is a dormant stem cell that proliferates in vivo in response to the extreme pressure present after toxic hematopoietic insult (irradiation). However, because of their dormancy these cells may be a valuable reserve of primitive stem cells in patients with leukemia that may be used for transplantation if they could be expanded ex vivo. Also, because of the primitive nature of the CCE-25–c-KitnegSca-1pos and Sca-1neg cells, we intend to test the ability of these cells to mature into nonhematopoietic cell types. In addition, our analysis of this CCE-25–c-Kitneg compartment identified a unique, distinct CD45neg population. It is possible that these cells developmentally precede the hematopoietic-committed CD45pos cells and have the ability to develop into nonhematopoietic tissue, a possibility we have not yet tested.
Prepublished online as Blood First Edition Paper, July 10, 2003; DOI 10.1182/blood-2003-04-1249.
Supported in whole or in part with federal funds from the National Cancer Institute (NCI), National Institutes of Health, under contract number NO1-CO-12400.
The publisher or recipient acknowledges the right of the US government to retain a nonexclusive, royalty-free license in and to any copyright covering this article.
The publication costs of this article were defrayed in part by page charge payment. Therefore, and solely to indicate this fact, this article is hereby marked “advertisement” in accordance with 18 U.S.C. section 1734.
The content of this publication does not necessarily reflect the views or policies of the Department of Health and Human Services, nor does the mention of trade names, commercial products, or organizations imply endorsement by the US government.
We are grateful for the outstanding technical assistance of Steve Stull, Mehrnoosh Abshari, Kathleen Noer, Roberta Matthai, and John Wine. The authors thank Sally Spence, Christine McCauslin, and Joost Oppenheim for their critical review of this manuscript. In addition, we are grateful to Scott Duram and Kathrin Muegge for advice regarding the RAG-2–/– model and analysis, as well as Donna Hogge, Liz Welniak, Kyunghee Choi, Dov Zipori, and Toru Nakano for stromal cell lines. In addition we thank Barbara Varnum-Finney and Irwin Bernstein for the generous gift of the DeltaExtIgG. Finally, we are especially grateful to Steve Bartelmez for his advice on the Tpo-LTMC and for the generous gift of horse serum.

