Abstract
We have created a molecular resource of genes expressed in primary malignant plasma cells using a combination of cDNA library construction, 5′ end single-pass sequencing, bioinformatics, and microarray analysis. In total, we identified 9732 nonredundant expressed genes. This dataset is available as the Myeloma Gene Index (www.uhnres.utoronto.ca/akstewart_lab).Predictably, the sequenced profile of myeloma cDNAs mirrored the known function of immunoglobulin-producing, high-respiratory rate, low-cycling, terminally differentiated plasma cells. Nevertheless, approximately 10% of myeloma-expressed sequences matched only entries in the database of Expressed Sequence Tags (dbEST) or the high-throughput genomic sequence (htgs) database. Numerous novel genes of potential biologic significance were identified. We therefore spotted 4300 sequenced cDNAs on glass slides creating a myeloma-enriched microarray. Several of the most highly expressed genes identified by sequencing, such as a novel putative disulfide isomerase (MGC3178), tumor rejection antigen TRA1, heat shock 70-kDa protein 5, and annexin A2, were also differentially expressed between myeloma and B lymphoma cell lines using this myeloma-enriched microarray. Furthermore, a defined subset of 34 up-regulated and 18 down-regulated genes on the array were able to differentiate myeloma from nonmyeloma cell lines. These not only include genes involved in B-cell biology such as syndecan, BCMA, PIM2, MUM1/IRF4,and XBP1, but also novel uncharacterized genes matching sequences only in the public databases. In summary, our expressed gene catalog and myeloma-enriched microarray contains numerous genes of unknown function and may complement other commercially available arrays in defining the molecular portrait of this hematopoietic malignancy.
Introduction
Multiple myeloma is an incurable B-cell neoplasia characterized by the dysregulated clonal expansion of malignant plasma cells. Neoplastic transformation in multiple myeloma is believed to originate in illegitimate immunoglobulin heavy chain (IgH) switch recombinations. This seminal event results in the translocation of oncogenes to the IgH locus on 14q32. At least 5 genes have been identified as primary, nonrandom translocation partners. These genes include Bcl-1/PRAD-1/cyclin D1 (11q13),1 cyclin D3 (6p21),2,FGFR3-MMSET (4p16.3),3,c-maf (16q23),4 and mafB(20q11).5 Deletions of chromosome 13 are also common6 and appear early in the disease course. During the ensuing progression of the disease, additional karyotypic instability develops and mutations or dysregulation in expression of genes such asc-myc, N-ras, K-ras, FGFR3, and p53 occur (reviewed by Bergsagel and Kuehl7). Nevertheless, little is understood about the progressive genetic events that result in the propagation of multiple myeloma. To address this issue, we have constructed unidirectional cDNA libraries from high-purity CD138+patient-derived plasma cells to develop a compendium of malignant plasma cell–expressed genes. Single-pass sequencing of the 5′ ends of randomly picked clones from these libraries has allowed us to identify approximately 4611 genes that are expressed in myeloma cells. From this dataset, we have subsequently developed a 4300 myeloma gene–enriched cDNA microarray. An additional 5121 genes identified by stringent microarray hybridization expanded our catalog of myeloma-expressed genes (Myeloma Gene Index) to 9732 nonredundant genes. We describe here the results of our high-throughput sequencing effort, the contents of our catalog of expressed genes in myeloma with an emphasis on novel gene discovery, and the validation of a myeloma-enriched microarray created from this dataset.
Materials and methods
Patient samples
Mononuclear cells from the bone marrow aspirates of 7 myeloma patients and the peripheral blood mononuclear cells from a patient with de novo plasma cell leukemia were isolated using Ficoll-HyPague reagent (Pharmacia Biotech, Baie d'Urfe, QC). CD138+ cells were enriched from patients' mononuclear cells by magnetic cell sorting system (MACS) (Miltenyi Biotec Canada, Hamilton, ON) according to the manufacturer's instructions. Cells were immediately processed for RNA extraction or stored resuspended in Trizol reagent (Gibco, Bethesda, MD) at −80°C for no more than 16 hours. No patients were newly diagnosed, and most were studied at the time of relapse or refractory disease. Malignant plasma cells from bone marrow aspirates varied between 10% to 89% prior to sorting. Total RNA from patient samples was extracted using Trizol reagent (Gibco). PolyA RNA was purified from total RNA using QuickPrep mRNA extraction kit (Pharmacia Biotech).
Complementary DNA library construction
Two oligo d(T)–primed, unidirectional libraries called PCL and MYE were constructed using methods previously described by our group.8 The PCL library was derived from the myeloma cells of a plasma cell leukemia patient (> 95% myeloma), and the MYE library was constructed from purified CD138+ cells from 2 myeloma patients' bone marrow.
Sequence data acquisition and analysis
Clones from the primary library were plated, randomly picked, and eluted into SM buffer (0.01 M NaCl, 10 mM MgSO4, 0.05 M Tris-HCl [pH 7.5], 0.01% gelatin). Single-pass sequencing of the 5′ end of cDNAs was performed on 2 μL of polymerase chain reaction (PCR) products as described previously using a primer nested within the forward PCR primer.8 Subtraction prior to sequencing was performed by hybridization using a probe cocktail that includes immunoglobulin λ and κ light chain, mitochondrial DNA, elongation factor 1α, β2-microglobulin, and Alu repeat sequences.
Sequence data generated were compared using the Blast algorithm9 against NCBI (National Center for Biotechnology Information) nonredundant database (nr), the database of Expressed Sequence Tags (dbEST), the high-throughput genomic sequence database (htgs), the Human Genome database, the Reference Sequence database (Ref Seq), and UniGene database. Assignment of putative identities required a minimum Blastn E value = 10−10.
Myeloma 4300 microarray preparation
Following bioinformatics analysis, a list of cDNA clones with minimum redundancy was prepared. These clones were individually PCR amplified, quality screened on agarose gel, and subsequently purified using a 96-well plate PCR purification kit (Telechem, Sunnyvale, CA). After purification, all samples were lyophilized to dryness and then resuspended in 3 × SSC to a final concentration of 100 ng/μL. Samples were spotted on CMT-GAPS–coated glass slides (Corning, Corning, NY) at the facilities of the Ontario Cancer Institute (OCI) Microarray Centre, University Health Network (UHN) (http://www.microarray.ca) using high-precision robotics with Stealth microspotting tips (Telechem).
Microarray hybridization
Materials and detailed protocols for hybridization using generic OCI 19000 array and 4300 myeloma glass slide cDNA microarrays can be obtained from the website of the OCI Microarray Centre (http://www.microarray.ca/protocols/). For hybridization on the OCI 19000 array, 1 μg mRNA from samples used to construct the MYE and PCL libraries was labeled with Cy5, and 1 μg reference mRNA from the bone marrow mononuclear cells from a healthy donor was labeled with Cy3. Additional CD138+ myeloma from patient bone marrow samples (n = 5) was amplified using a previously published RNA amplification method.10 For the 4300 Myeloma Array, total RNA from myeloma cell lines was labeled with Cy5, and a reference total RNA pool was labeled with Cy3. Our reference RNA pool of 10 hematopoietic cell lines included progenitor cell line KG1-a, 4 lymphoma cell lines (U937, Namalwa, L540, Daudi), a lymphoblast cell line IM9, and 4 myeloma cell lines (H929, OCI-My5, KMS11, U266). The reference samples described here are designed to hybridize to the maximum number of spots on the array, providing reference signals with which to normalize experimental samples. Experimental samples performed at different time points are then directly comparable with one another. The experimental samples are not being compared with the reference pool for differential expression.
Scanning and quantification
Slides were scanned on a scanning laser fluorescence confocal microscope (ScanArray 4000XL) (Perkin Elmer, Fremont, CA). Individual 16-bit TIFF images were obtained by scanning for each of the 2 fluors. An overlay image of the 2 images was created and quantified using Scanalyze (Stanford) software.
Data analysis
Data were stored in and analyzed with the GeneTraffic Microarray Database and Analysis System (Iobion Informatics, La Jolla, CA) as well as the Significance Analysis for Microarrays (SAM) Program.11 Scanned 16-bit TIFF images representing each hybridized microarray slide and the associated quantification data files were entered into the local GeneTraffic database with a complete annotation of the experiments based on the current MIAME standards for microarray experiments (www.mged.org).
Individual spots had to pass a number of quality criteria to be included in the data analysis. Spots failing any of these filters in both channels were excluded from further analysis, while spots failing these filters in only one channel were flagged in the dataset and analyzed separately. Each hybridization dataset was normalized using lowess subarray normalization in GeneTraffic (http://oz.berkeley.edu/tech-reports/). Lowess normalization uses a local weighted smoother to generate an intensity-dependent normalization function. Each subarray or grid is normalized individually. The resultant normalized log2 ratios were used for statistical analysis.
Unsupervised Cluster Analysis
Hierarchical clustering was applied to the entire matrix of spotted cDNAs and cell lines. The log ratios of each cDNA clone were centered by subtracting the arithmetic mean of all ratios for that clone. Clustering was run using Pearson correlation coefficient as a similarity metric and average linkage clustering.12 The result of this unsupervised analysis are 2 dendrograms—one indicating the similarity between cell lines and the other indicating the similarity between genes. This hierarchical cluster was visualized in GeneTraffic as a 2-dimensional heat map. In the 2-dimensional view the genes and cell lines are ordered according to the dendrograms while the color at each position indicates the level of gene expression for a single cDNA in a cell line.
Supervised SAM analysis
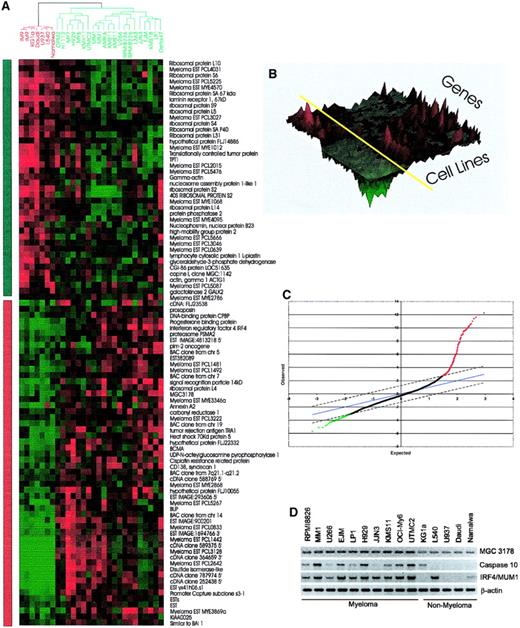
To identify the genes that are most significantly different between the myeloma and nonmyeloma cell lines, we employed 2-class SAM analysis11 with a false discovery rate of 0.5%. The SAM analysis was performed on each unique spot. To increase our confidence level, only those clones in which both replicate spots were found significant were selected. The results from this analysis were then resolved using hierarchical clustering as described above and visualized using a 2-dimensional heat map and 3-dimensional landscape view. The additional dimension in the 3-dimensional landscape indicates the level of gene expression. This view gives an excellent sense of the variability in the heat map.
Results
Database of sequenced myeloma cDNAs
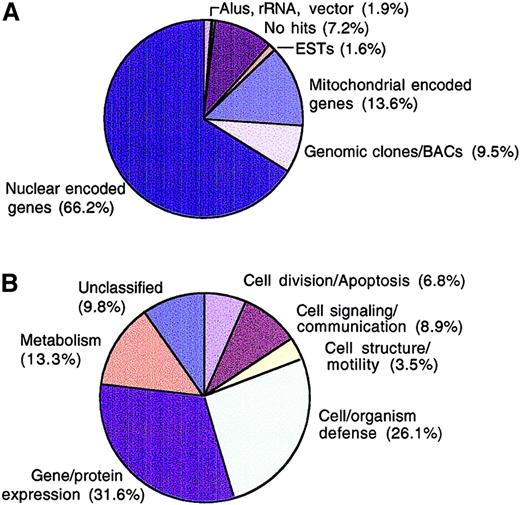
We used a combination of cDNA library construction, 5′ end single-pass sequencing, bioinformatics, and microarray hybridization techniques to develop the Myeloma Gene Index. Two unidirectional, oligo d(T)–primed myeloma cDNA libraries were constructed from patients' CD138+ cells and from malignant cells from an individual with plasma cell leukemia. From these libraries, we obtained single-pass sequence information from the 5′ ends of 6622 cloned sequences. Clustering of all 6622 expressed sequences in our dataset using TIGR Assembler generated 4568 informative sequences (268 contigs; 4300 sequences did not cluster; plus 186 have an ambiguous base sequence). Blast analysis of these sequences to the NCBI nonredundant database (nr), the database of Expressed Sequence Tags (dbEST), the high-throughput genomic sequence database (htgs), the Human Genome database, the Reference Sequence database (Ref Seq), and Unigene showed that close to 7% of all sequences obtained did not have a significant match in all the databases searched (Figure1A). The identities of some of these sequences can be inferred from subsequent microarray analysis. A high proportion (31%) of this group of sequences clustered with immunoglobulin λ, κ, and heavy chain genes, suggesting that these sequences may be somatically mutated immunoglobulins (data not shown). The identity of the remaining 69% unmatched sequences (about 5% of total) cannot currently be determined. However, some of these sequences may have errors introduced by single-pass sequencing and may have insufficient lengths to provide a statistically significant Blastn E value and therefore did not meet our minimum cutoff value of 1 × 10⁻¹⁰. A further 1.6% of myeloma-expressed sequences matched only entries in dbEST, and 9.5% of clones only matched sequences in the high-throughput genomic sequence (htgs) database (Figure 1A). Both these groups of sequences could not be confidently classified within any existing Unigene cluster. Therefore, the former group of sequences may contain rare genes that have not yet been studied or characterized, and the latter group represents genes that may not have been annotated in the public databases or have not been previously identified. Junk sequences such as ribosomal RNA, Alu repeats, and vector sequences constituted 1.9% of sequences. From the analysis of these sequences, there are approximately 4611 unique genes, representing about 13% of all human genes. Considering that the sequencing effort was not comprehensive and because only 3 patient samples were used in the construction of the library for sequencing, this figure is clearly an underestimate of the transcriptional phenotype of myeloma cells. Nevertheless, the novel characteristics of many of these cDNAs suggest that this dataset will prove useful in mining the molecular portrait of myeloma cells or normal plasma cells and when used on slide-based microarrays will complement currently available commercial systems in widespread use for genomic profiling.
Frequency analysis of single-pass sequences.
Clones from the primary myeloma libraries were plated, randomly picked, and PCR amplified. Sequencing of the 5′ end of cDNAs was performed on 2 μL of PCR products using primers nested within the forward PCR primer. Sequence data generated were compared using the Blast algorithm9 against Ref Seq, nonredundant GenBank/EMBL/DDBJ, high-throughput genomic sequence (htgs), dbEST, and Unigene databases on Pentium Pro200 Solaris x 86 platform (Micron Electronics). Assignment of putative identities required a minimum Blastn E value = 10−10. Each clone was classified based on Blast result from database searches (A) or according to functional categories (B).
Functional categories of gene sequences
To gain further insight into the transcriptional profile of myeloma cells, expressed genes were assigned functional categories13 using the SOURCE database (genome-www5.stanford.edu/cgi-bin/SMD/source/sourceSearch) and the Expressed Gene Anatomy Database (www.tigr.org/tdb/egad/egad.shtml) to classify known, named nuclear encoded genes. A notable proportion of expressed sequences (26.1%) were grouped as cell/organism defense and gene/expression categories (31.6%), while only 3.5% were catalogued as involved in cell structure/motility. Cell division/apoptosis genes, which include those involved in DNA synthesis/replication, programmed cell death, chromosome structure, and cell cycle, constituted 6.8% of all the expressed sequences (Figure 1B). Although subtraction with immunoglobulin and mitochondrial genes was performed prior to sequencing, immunoglobulin and mitochondrial genes still constitute most (21% and 13.6%, respectively) genes sequenced. Thus, the overall frequency would naturally, in the absence of subtraction, be even higher. Taken together, this expression profile of immunoglobulin-producing, high-respiratory rate, low-cycling cells is consistent with the known function of terminally differentiated plasma cells.
Expressed genes of interest identified by 5′ sequencing
A number of interesting growth factors and cytokines were sequenced from myeloma cells (Table 1) including B lymphocyte stimulatorBlys/BAFF,14,15,MIF,16,IL-16,17,TRAIL/Apo-2,18,19 andVEGF.20 Receptors sequenced included transmembrane activator and CAML interactor gene(TACI) and B-cell maturation peptide (BCMA) (the receptors for Blys/BAFF),21-23 homing receptor CD44,24 interferon (α, β, ο) receptor-1(IFNAR1),25 colony-stimulating factor-2 receptor β,26,Flt-3 receptor kinase,27 and interleukin-6 (IL-6)receptor.28 Among expressed receptors, the chemokineCXCR4 receptor29 was most frequently sequenced.
We found expression of c-maf in one patient sample, but other known translocated oncogenes were not identified by sequencing, reflecting either the incomplete nature of the sequencing effort or, more likely, the absence of translocations in these patient samples (primary myeloma patients have been shown by others to contain a known translocated oncogene only 60% of the time).7Nevertheless, we found numerous transcripts corresponding to genes previously shown to play a role in myeloma, including c-myc, IRF4/MUM1, c-maf, ras, PIM1, PIM2, and IL-6 receptor, among others. The high expression of cyclin D2 in the PCL library is also interesting given that cyclin D2 translocations have been observed in lymphoma30 and potentially in myeloma.7 31
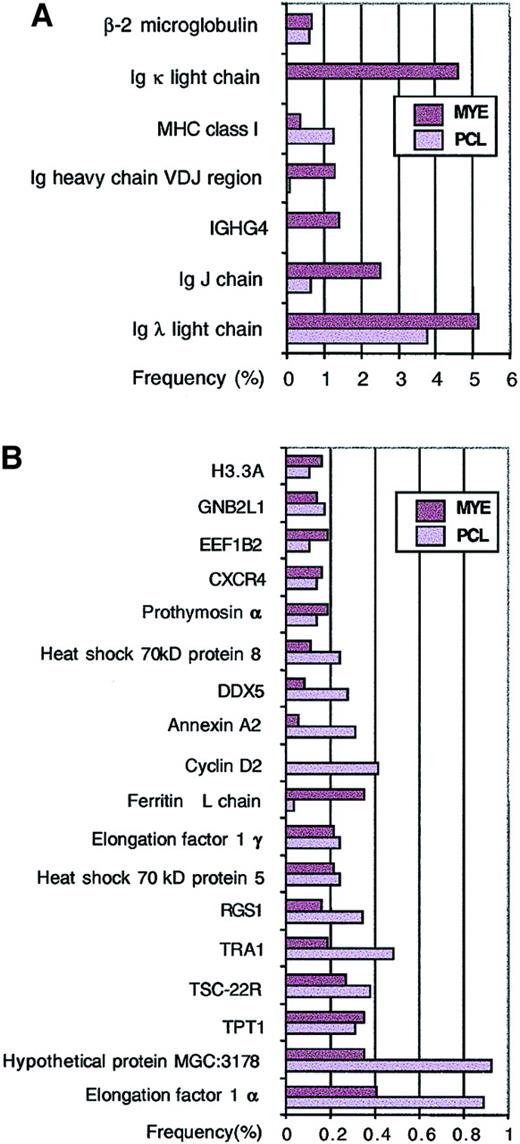
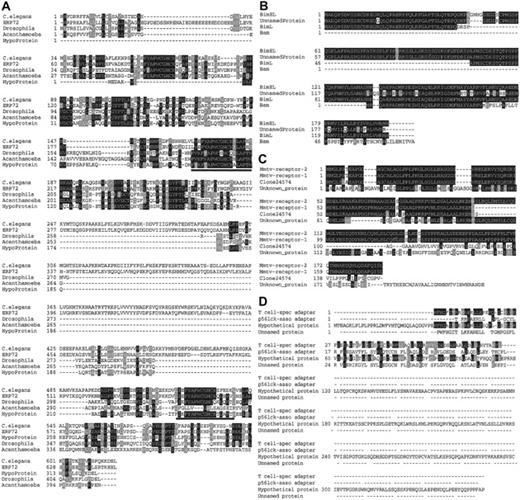
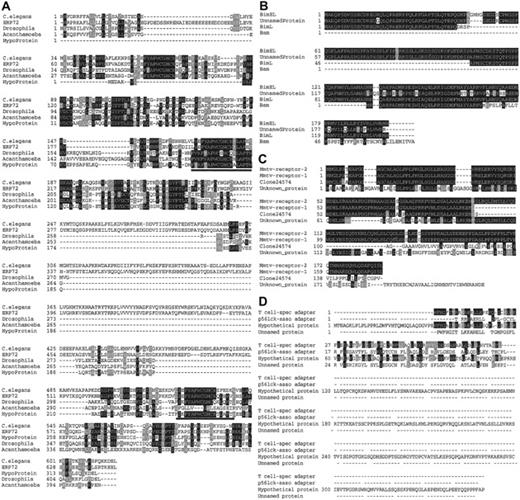
Genes that are highly expressed in myeloma cells were identified based on the number of times they were sequenced from randomly selected clones. Not surprisingly, genes with high expression include lymphoid genes such as MHC class I, β2-microglobulin, immunoglobulin λ light chain, κ light chain, and heavy chain (Figure 2A). Consistent with the clonal origin of myeloma cells, samples from a plasma cell leukemia expressed only immunoglobulin λ chain, whereas pooled samples from 2 myeloma patients expressed both immunoglobulin λ and κ chains. Other highly expressed but less well characterized genes include protein tumor-rejection antigen-1 (TRA1),32,TSC-22R/DSIPI,33,34 regulator of G protein signaling-1 (also called B-cell activation gene[BL34]),35,DDX5 (DEAD/H p68 RNA helicase),36 and hypothetical protein MGC3178 (also annotated as UniGene Hs.6101; 58 kDa glucose-regulated protein) (Figure2B). Further analysis of cDNA contigs representing hypothetical protein MGC3178 revealed that it contains thioredoxin domains and showed homology to Erp72,37 a protein disulfide isomerase (Figure 3A).
Highly expressed genes based on single-pass sequence data.
The frequency of a gene in each library was calculated from 3705 MYE clones and 2917 PCL clones from a total of 6622 single-pass sequences. The frequencies of immune system–related genes are shown in panel A, while other highly expressed genes with frequencies higher than β-actin are shown in panel B.
Selected novel genes identified from the myeloma library.
Proteins were aligned using multiple sequence alignment algorithm Clustal W 1.8 and shaded using Boxshade 3.21. (A) Sequence alignment of hypothetical protein MGC3178 (also called 58 kDa glucose-regulated protein) with putative disulfide isomerases from different species. The thioredoxin domains are underlined. The accession numbers used in the analysis are as follows: Acanthamoeba (AAC37215),Caenorhabditis elegans (P34329), Drosophila (AAK93133), and ERP72 (A23723). (B) A variant of Bim (Bam) specifically expressed in a multiple myeloma sample aligned with BimEL (AAC39593.1), an unnamed protein (CAC09660.1), and BimL (AAC40030.1). (C) Amino acid sequence alignment of a putative novel receptor with similarity to MMTV receptor-1 (AAF32283), MMTV receptor-2 (AAF32282), unknown protein MGC15887 (AAH09447), and clone 24574 (AF052151). (D) Protein sequence alignment of a novel SH2 domain containing adaptor with T-cell–specific adapter protein TSAd (AAF69027.1), an SH2 adaptor protein (AF051325.1), p56lck-associated adapter protein Lad (AAB58422.1), hypothetical protein FLJ14886 (AAH16826.1), and an unnamed protein (AK024799.1).
Of the highly expressed genes listed in Figure 2, in silico differential display (http://www.ncbi.nlm.nih.gov/UniGene/info/ddd.html) identified tumor-rejection antigen-1 (TRA1), regulator of G protein signaling-1 (RGS1), heat shock 70 kDa protein 5, hypothetical protein MGC3178, and actin γ (ACTG1) to be statistically differentially expressed when compared with a normal B-cell profile (data not shown).
Novel genes identified from myeloma cells by sequencing
In-depth analysis of all expressed sequences identified a number of putative novel genes of interest (Table2). For example, the complete open reading frame (ORF) of a novel adaptor protein containing SH3 and SAM domains (PCL0785) was identified. Its SH3 domain has limited homology to the same motif in CrkL. This gene (namedHACS1) belongs to a novel gene family that appears to be expressed in both malignant and normal hematopoietic cells.38 Extensive database searches also identified a putative proapototic variant of Bim, a BH3-domain containing Bcl-2 interacting protein.39 This variant, which we called Bam (Figure 3B), is specific to the myeloma library and appears to be a poorly expressed transcript (unpublished data, July 2001). A myeloma cDNA (MYE4482) also matched uncharacterized clone 24574 in GenBank. Further sequence analysis revealed that this clone represents the putative human ortholog of mouse mammary tumor virus receptor (Figure 3C). A novel SH2 domain–containing adaptor was also identified (Figure 3D). Although its expression was not specific to the myeloma library, its SH2 domain is homologous to the SH2 domain of T-cell–specific adaptor TSAd 40 and to p56lck interacting adaptor protein Lad,41 suggesting that it may represent a novel molecule involved in B-cell signaling. In addition, proteins containing functional domains such as Trp-Asp (WD), PARP, SH2, ankyrin, plekctrin, and zinc finger domains were also identified (Table 2).
Myeloma-expressed genes identified by microarray hybridization
Given the limitations of studying libraries derived from only 3 patients in our sequencing effort, we next expanded our expressed gene index results using a glass slide microarray containing 19 000 random cDNAs produced by the Ontario Cancer Institute (OCI) Microarray Centre. RNAs from 5 CD138+ sorted primary patient samples were used for hybridization, and expressed genes were catalogued using stringent screening criteria. For example, weak spots (channel intensity of < 1000) and spots having inconsistent results as duplicates were screened out. Spots having intensity coming from only a few bright pixels were filtered out, and only those that passed a threshold value of 1.5 × above background were chosen. These strict criteria narrowed the number of expressed genes from microarray hybridization to 5822, representing about 31.0% of genes on the random 19000 OCI microarray. Comparing the known named genes from our sequencing effort and the 19000 array, 701 genes were present in both datasets. Of these, 100% of the genes were always detected on the 19000 microarray analysis using primary patient samples, albeit some were expressed at low levels. However, 32% were clearly present in at least 80% to 100% of patients using our stringency criteria. Combined with our sequencing data and excluding genes in common between the 2 datasets, we have therefore, in total, catalogued 9732 myeloma-expressed transcripts. This dataset of genes expressed in multiple myeloma is available from the Myeloma Gene Index website (www.uhnres.utoronto.ca/akstewart_lab). Sequences can be downloaded from our website or through the NCBI Entrez sequence retrieval system.
Myeloma gene–enriched microarray
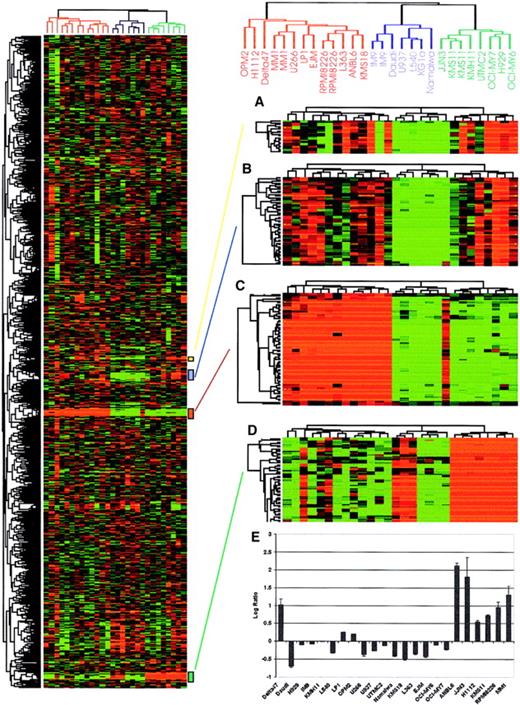
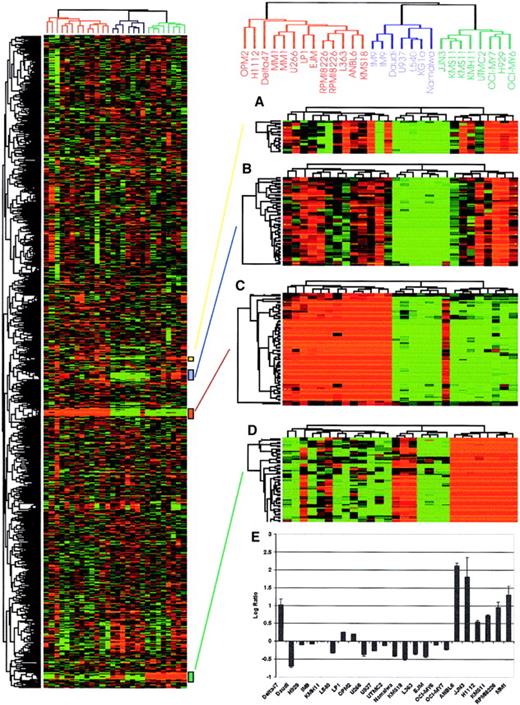
A 17800 Lymphochip, which contains cDNAs from germinal center B cells, lymphomas, and chronic lymphocytic leukemia, has previously been used to define the gene expression profile of B-cell lymphoma.42 A partial comparison of known genes spotted on the Lymphochip and in our sequenced myeloma cDNAs suggests that overlap between the 2 datasets is fairly low (about 7.1% when uncharacterized ESTs are excluded). Given the above and the preponderance of novel genes or cDNAs with only htgs or dbEST matches in our sequenced dataset, we next arrayed about 4300 myeloma cell–derived cDNAs on aminosilane-coated (CMT-GAPS) glass slides. Multiple copies of highly expressed genes identified by sequencing, such as immunoglobulin λ and κ light chains, immunoglobulin J chain, and hypothetical protein MGC3178 (Figure 4) were spotted at random positions on the array. To validate the myeloma-enriched array, we generated a molecular portrait of 18 myeloma cell lines and 6 hematopoietic nonmyeloma cell lines (Figure 4). A total of 5460 quality controlled spots corresponding to 2730 cDNAs were used to profile the cell lines in 28 hybridizations for a total of 152 880 data points. As initial validation, the array was demonstrated to accurately determine the clonal immunoglobulin light chain gene expressed in each cell line, and myeloma cell lines harboring a known c-maf (16q23) translocation4 could be accurately predicted (Figure 4). We then identified 52 genes that were differentially expressed in myeloma versus nonmyeloma cell lines using a supervised analysis method (Significance Analysis of Microarray [SAM]11) (Table 3, Figure5). This dataset not only includes genes known to be involved in plasma cell biology, such as MUM1/IRF4, BLyS/BAFF receptor (BCMA), CD138/syndecan,PIM2, and XBP1, but also less well characterized genes, such as hypothetical protein MGC3128, heat shock 70 kD protein 5, TRA1, protein phosphatase-2, and lymphocyte cytosolic protein-1 (Table 3). Additionally, novel ESTs and unannotated genes from uncharacterized chromosomal regions were identified as differentiating nonmyeloma cell lines from myeloma. Semiquantitative analysis of some of these genes by RT-PCR (Figure 5C) confirmed the biologic validity of the microarray results. Taken together, our initial hybridization data suggest that our myeloma-enriched array may prove useful in identifying novel genes that may help elucidate the biology of malignant plasma cells.
Hierarchical cluster analysis of myeloma cell lines.
Total RNA from myeloma and nonmyeloma cell lines (5 lymphoma and 1 leukemia) were labeled with Cy5 and hybridized to our 4300 myeloma cDNA microarray together with a Cy3-labeled standard reference pool. All the data were mean centered and clustered using a Pearson correlation coefficient as a similarity metric and average linkage hierarchical clustering.12 Levels of intensity of red squares correlate with the degree of gene expression in cell line experimental samples; conversely, green squares compare the absence of expression among cell lines at a scale relative to the color intensity. Black squares indicate the expression is average among the tested cell lines with ratio corresponding to 1.0 (or log2, ratio of 0), and gray squares represent missing data points. A cluster image representing 2750 of the cDNAs is shown on the left panel. Reproducibility of the array is confirmed by deliberately spotted replicate cDNAs that clustered closely together as shown on the right side of the figure. (A) Immunoglobulin J chain, (B) hypothetical protein MGC3178, (C) immunoglobulin λ light chain, and (D) immunogloblin κ light chain genes are shown on the right panel. (E) Expression of c-maf in different myeloma cell lines based on microarray data. The log2 ratio of fluorescence intensity is shown on the y-axis while myeloma cell lines are shown on the x-axis. The data correlate perfectly with the published literature with the exception of the cell line δ47, which is positive for c-maf expression on the array but is not previously reported to have up-regulated c-mafexpression.
Genes showing differential expression between myeloma and nonmyeloma cell lines.
Two-class SAM11 analysis was used to identify the genes differentially expressed in the myeloma and nonmyeloma cell lines. Using a false discovery rate of 0.5%, 94 genes were selected. Those genes showing statistically significant differences between the 2 groups are shown as a cluster image. (A) Two-dimensional heat map view. The dendrogram (top) indicates nonmyeloma hematopoietic cell lines (5 lymphoma and 1 leukemia) in red and myeloma cell lines in green. The myeloma cell lines cluster together, as do the nonmyeloma cell lines. The bar on the left of the 2-dimensional heat map indicates down-regulated genes in myeloma in green and up-regulated in red. The color at each position indicates the level of gene expression for a single cDNA in a cell line, with red indicating high expression and green indicating low expression. (B) Three-dimensional landscape view of cluster results. This view adds the level of gene expression as an additional dimension to the 2-dimensional view. The roughness on the landscape indicated the level of variability. Myeloma cell lines are on the right of the yellow axis bar, and nonmyeloma lies on the left. (C) The SAM analysis data, which generated 279 cDNAs that are up- or down-regulated between the 2 groups of cell lines, are illustrated graphically with δ = 1.4 and a false-positive rate of 0.5%. After immunoglobulin genes and duplicate cDNAs were removed, 94 genes were used to produce the heat map shown in panel A. Of the 94 genes, 52 were ranked based on the SAM result as shown in Table 3. (D) RT-PCR analysis of selected genes confirmed differential expression of representative differentially expressed genes shown in panel A.
Discussion
In setting out to further characterize the transcriptional profile of multiple myeloma, we first searched the public gene expression databases. Close to 60 000 3′ end single-pass gene sequences from cDNA libraries derived from normal and malignant human B cells have been deposited by the Cancer Genome Anatomy Project.43 All of these gene sequences, however, were derived from lymphoma, germinal center B cells, and chronic lymphocytic leukemia samples, and no sequences were derived from either normal or malignant plasma cells. We therefore constructed cDNA libraries from samples obtained from myeloma patients and acquired 5′ end single-pass sequence from 6622 cDNA clones. Our ensuing sequencing effort resulted in a sequenced gene expression dataset, the Myeloma Gene Index. Our initial functional classification of expressed genes in this dataset was reassuring in that it demonstrated a high respiratory activity, low cell cycle activity, and CD138+-expressing and immunoglobulin- and β2-microglobulin–producing cell population consistent with the known function of and markers for plasma cells. Thus, our sequencing effort seems representative of plasma cells and allows some confidence in mining this database for genes involved in myeloma/plasma cell growth and differentiation. This index was then expanded through use of microarray hybridizations to more completely catalog genes expressed in myeloma. The resulting Myeloma Gene Index currently contains 9732 nonredundant genes identified through high-throughput sequencing or microarray experiments as expressed in but not necessarily unique to myeloma. Nevertheless, the presence of numerous novel or poorly characterized genes in this compendium of genes, together with the lack of overlap on other cDNA arrays, stimulated our subsequent development of a high-density myeloma gene–enriched cDNA microarray that we validated through a study of the molecular profile of multiple myeloma cell lines.
Further analysis of our sequenced clones in the Myeloma Gene Index reveals some relevant findings of note in myeloma biology and reveals novel gene sequences of potential interest to the field. As one example, a list of receptors and growth factors that are expressed in myeloma was compiled and arrayed. This list includes theIL-6 receptor and the newly identified TNF-related cytokineBLyS/BAFF 14,15 together with its receptors,TACI and BCMA.21-23 Binding ofBLyS to its receptor provides survival signals to activated B cells by up-regulation of antiapoptotic proteins such asBcl-2 and down-regulation of proapoptotic protein such asBim.21-23 39 In this light, a cDNA clone of potential interest encoding a putative novel gene with homology to BH3-only protein BimL (PCL5805) was also identified in our sequencing effort. It is not yet known whether this gene is also a downstream target for the BlyS/BAFF signaling pathway.
Further analysis revealed a number of frequently sequenced and as yet poorly characterized genes, including DDX5 (DEAD/H box protein p68), an adenosine triphosphate (ATP)–dependent RNA helicase. Notably, DDX5 was originally identified due to its immunologic cross-reactivity with SV40 large T antigen, an ATP-dependent DNA helicase.44 Whether the pattern of expression of this gene in myeloma has any similarity with SV40 large T antigen mechanism of oncogenicity is unknown. The B-cell activation protein BL34 (also called regulator of G protein signalingRGS1) was also frequently sequenced. BL34 is involved in the regulation of B-cell activation and proliferation and functions by inhibiting signal transduction by increasing the GTPase activity of G protein α subunits into inactive GDP-bound form.45 It was originally identified to be highly expressed in the peripheral blood mononuclear cells of a patient with B-cell acute lymphocytic leukemia35 and is constitutively highly expressed in malignant B cells such as non-Hodgkin lymphoma and hairy cell leukemia. Other frequently sequenced genes include tumor rejection antigen TRA1 (also called endoplasmin precursor or glucose-regulated protein 94, GRP94) and translationally controlled tumor protein TCTP (also called histamine releasing factor). TCTP is known to be expressed in healthy and tumor cells, including erythrocytes, keratinocytes, macrophages, platelets, erythroleukemia cells, melanomas, hepatoblastomas, and lymphomas.46
As another example of sequenced database mining, we searched for potential tumor-specific antigens present on myeloma cells. Such antigen expression information can be used to develop immunotherapeutic strategies for the disease. In this regard, previous reports indicated a possible viral involvement in the pathogenesis of multiple myeloma.47 Nevertheless, excluding known oncogenes such asc-fos, c-myc, and c-jun, analysis of the myeloma sequences described above did not reveal any evidence of expressed viral genes that may support this hypothesis.
Others have also been exploring the gene expression profile of myeloma with impressive datasets already generated using commercially available array systems. In this regard it is of interest to compare our sequencing effort with the published microarray experiments of others. The genes we identified by sequencing partly overlapped with the genes up-regulated in multiple myeloma described recently.48Comparisons with our sequence data revealed that 11 of the 70 genes up-regulated in myeloma (EIF3S9, LAMC1, SSA2, EWSR1, KIAA0020, PHB, EVI2A, CASP1, SNURF, ATF3, and MYC) were also sequenced in our dataset.
Although we are only now turning our attention to the large-scale analysis of multiple primary patient samples and examining differential expression between normal and malignant plasma cells, we are confident that our array will provide useful and complementary data to that already published using Affymetrix-based array systems. The numerous novel or uncharacterized genes on our array and the lack of overlap with other array systems essentially guarantees novel findings, assuming our arrays can be demonstrated to be discriminatory. In this light our preliminary results are encouraging. For example, our array was able to discriminate myeloma from nonmyeloma cell lines. Furthermore, statistical analysis of our microarray data from myeloma and nonmyeloma cell lines identified 34 genes to be significantly up-regulated (after immunoglobulin λ, κ, and J chain genes were filtered out) and 18 genes to be down-regulated in the myeloma cell lines. The most significantly up-regulated gene (MGC3178) in 100% of the myeloma cell lines was identified to be a novel protein disulfide isomerase (PDI). The disulfide isomerase family of proteins is known to be involved in rearrangement of both intrachain and interchain disulfide bonds in proteins to form the native structures. However, MGC3178 may function as cysteine-type endopeptidase, protein disulfide isomerase, phospholipase, or a combination of these (SOURCE database). Other significantly up-regulated genes in this analysis include heat shock 70 kD protein 5 (also called immunoglobulin heavy chain binding protein), a gene known to be important in the folding and oxidation of antibodies in vitro.49 The interferon regulatory factor-4(MUM1/IRF4) is also significantly but not uniquely associated with the myeloma cell lines. MUM1/IRF4 gene expression has been suggested to relate to the stage of differentiation of malignant B plasma cells50 and has been identified as an oncogene transcriptionally activated by t(6;14)(p25;q32) chromosomal translocation in multiple myeloma.51
In conclusion, analysis of our sequence information reveals numerous poorly characterized genes of potential relevance to myeloma biology. Sequencing also made available the cDNAs necessary to spot a myeloma-enriched glass slide–based array, and initial results using this array demonstrate that it will prove of unique value in mining the biology of myeloma. The Myeloma Gene Index and myeloma gene–enriched microarray represent a valuable resource for investigators interested in dissecting the molecular basis of this disease.
We thank N. T. Claudio, H. Y. Wang, A. Dempsy, N. Pabalan, and S. Zhang for technical support; P. L. Bergsagel for myeloma cell lines; and A. Wechalekar for patient information.
Prepublished online as Blood First Edition Paper, May 31, 2002; DOI 10.1182/blood-2002-01-0008.
Supported by grants from the National Cancer Institute of Canada, Multiple Myeloma Research Foundation, Nelson Arthur Hyland Foundation, ABC group, and by Fellowship Awards from the Canadian Blood Services and Canadian Institutes of Health Research. J.O.C. was a recipient of Career Development Fellowship Award from the Canadian Blood Services and M.V. a recipient of CIHR Fellowship.
J.O.C. and E.M.-K. contributed equally to this work.
The publication costs of this article were defrayed in part by page charge payment. Therefore, and solely to indicate this fact, this article is hereby marked “advertisement” in accordance with 18 U.S.C. section 1734.
References
Author notes
A. Keith Stewart, Princess Margaret Hospital, University Health Network, 610 University Ave, Rm 5-126, Toronto, ON, M5G 2M9, Canada; e-mail: kstewart@uhnres.utoronto.ca.

