Key Points
Elevation of endogenous TFPI delays the initiation of thrombin generation in hospitalized patients with COVID-19.
Plasma TFPI is not associated with thrombosis or 30-day mortality.
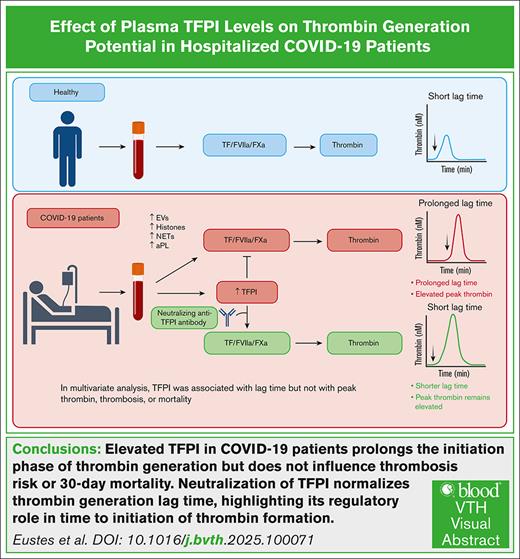
Visual Abstract
Plasma levels of tissue factor pathway inhibitor (TFPI) are elevated in many patients with COVID-19 but the role of TFPI in COVID-19 coagulopathy remains elusive. We sought to determine the contribution of TFPI to thrombin generation in patients with COVID-19 and assess its association with thrombosis and other clinical outcomes. We used blood samples from an early COVID-19 clinical trial of adult patients hospitalized with acute COVID-19 from April 2020 to January 2021 (ClinicalTrials.gov identifier: NCT04360824). Plasma TFPI was measured by enzyme-linked immunosorbent assay, and thrombin generation potential was measured in the presence or absence of TFPI neutralizing antibodies. Thromboelastography was performed with whole-blood samples. We found that plasma TFPI was elevated in patients with COVID-19 compared with healthy individuals. Thrombin generation triggered by exogenous TF and phospholipids was increased in COVID-19, reflected by greater peak thrombin, velocity index, and endogenous thrombin potential; however, the time to initiation of thrombin generation (lag time) was delayed. Addition of a neutralizing anti-TFPI antibody significantly shortened the lag time in COVID-19 and normalized the difference in lag time between those with COVID-19 and healthy individuals. Plasma TFPI was positively associated with lag time, time to peak thrombin, and time to initial clot formation in thromboelastography. Multivariate analysis demonstrated that TFPI correlated with lag time and time to reach peak thrombin but not with 30-day mortality, thrombosis, or other adverse clinical outcomes. We conclude that elevated plasma TFPI delays the initiation of thrombin generation and clot formation but is not associated with thrombosis in patients hospitalized with COVID-19.
Introduction
Coronavirus disease 2019 (COVID-19) is associated with arterial, venous, and microvascular thrombosis and has laboratory features of a systemic coagulopathic state.1 Many potential mediators of coagulopathy in COVID-19 have been proposed, including platelet activation,2,3 neutrophil extracellular traps,4-6 complement activation,4 antiphospholipid antibodies,7 and extracellular histones.8,9 Thrombin generation potential is increased in plasma samples from patients with COVID-19; however, the lag time to initiation of thrombin generation is paradoxically delayed.8,10-13
Tissue factor pathway inhibitor (TFPI) is an endogenous Kunitz-type serine protease inhibitor that dampens the initiation phase of coagulation before thrombin generation.14 Plasma levels of TFPI are often elevated in patients with COVID-19 compared with healthy individuals15-17 but the relationship between plasma TFPI and thrombin generation and its association with clinical thrombotic events in COVID-19 is poorly understood.12 Using plasma samples from a clinical trial of hospitalized patients with COVID-19,18 we investigated the mechanistic effects of plasma TFPI on thrombin generation and assessed its association with thrombosis, mortality, and other adverse clinical outcomes.
Methods
Human patients
Plasma samples were collected from adult patients hospitalized with COVID-19 from April 2020 to January 2021 as a part of an open-label, randomized, clinical trial comparing prophylactic vs intermediate-dose enoxaparin (ClinicalTrials.gov identifier: NCT04360824).18 Severe acute respiratory syndrome coronavirus 2 (SARS-CoV-2) infection was confirmed by polymerase chain reaction. Patients were eligible if they were admitted to an intensive care unit and/or had coagulopathy defined as a modified International Society on Thrombosis and Hemostasis overt disseminated intravascular coagulation score of ≥3. Patients were excluded if they had acute or chronic renal insufficiency with an estimated creatinine clearance of <30 mL/min calculated by the modified Cockcroft and Gault formula. Control plasma was collected from healthy donors who were free of cardiovascular and metabolic disease and were not taking any medications. Cholesterol, fasting glucose, blood pressure, and complete blood counts were measured to confirm their status as healthy individuals. Baseline characteristics and 30-day clinical outcomes of patients with COVID-19 in the intention-to-treat population were reported in the primary publication18 and effects of COVID-19 on platelet activation and platelet-dependent thrombin generation have been reported in a secondary publication.13
In this study, we used plasma samples from a subset of patients with COVID-19 enrolled in the primary trial18 and healthy control individuals to investigate the mechanistic effects of plasma TFPI on thrombin generation and assess its association with mortality and clinical outcomes. Written informed consent was obtained from all participants or their legally authorized representatives. All protocols were approved by the institutional review board of the University of Iowa.
Blood processing
Blood was collected in tubes containing 3.2% sodium citrate and centrifuged at 1000g for 10 minutes at room temperature to collect platelet-poor plasma, which was centrifuged further at 10 000g for 10 minutes to obtain platelet-free plasma (PFP).
Thrombin generation
Thrombin generation in PFP was measured using the calibrated automated thrombogram (Diagnostica Stago, Inc, Parsippany, NJ).19,20 All samples were treated with >125 IU/mL heparinase (Hepzyme; Siemens) to negate any effects of heparins present in the plasma. Thrombin generation was measured by addition of 20 μL of PPP-reagent LOW containing 1 pM TF and 4 μM phospholipids to 80 μL of PFP and incubation for 10 minutes at 37°C before addition of FluCa fluorogenic substrate (Z-GGR-AMC; catalog no. 102601-58-1; Bachem, Torrance, CA) containing CaCl2. Peak thrombin (nM), velocity index (nM/min), lag time (minutes), time to peak (Tmax; minutes), and endogenous thrombin potential (ETP; nM/min) were determined using Thrombinoscope 5.0 software. PFP was incubated at 37°C for 30 minutes with 150 nM anti-TFPI inhibitory antibody (Thermo Fisher Scientific; catalog no. PAI-43059), or sheep immunoglobulin G control (R&D Systems, Minneapolis, MN; catalog number 5-001-A) before measuring thrombin generation in some experiments.
TEG
Whole-blood thromboelastography (TEG) was performed using the Haemonetics TEG 5000 hemostasis analyzer (Haemonetics Corp, Boston, MA), software version 4.2.3, with kaolin to trigger coagulation. TEG parameters included the reaction time (time to initial clot formation), kinetics, α-angle, maximum amplitude, coagulation index, and clot strength.
Measurement of TFPI
Plasma total TFPI was measured by enzyme-linked immunosorbent assay (ELISA; catalog no. ELH-TFPI-1; RayBiotech, Peachtree Corners, GA). TFPIα was measured by isoform-specific ELISA using a monoclonal anti–TFPI-K2 antibody for capture and biotinylated monoclonal anti–TFPI-K3 (TFPIα) antibody for detection.21
Measurement of TF/annexin V double–positive EVs
Quantification of endogenous extracellular vesicles (EVs) containing TF present in plasma samples was performed as previously described.22 EVs were isolated from 200 μL of PFP and resuspended in flow cytometry buffer (Ca/Mg phosphate-buffered saline containing 0.1% bovine serum albumin, 0.1% NaNa3, and 20 units/mL DNase 1). Fc block (Bio-Rad, Hercules, CA) was added and EVs were stained with Alexa Fluor 647–conjugated annexin V (BioLegend, Inc, San Diego, CA; catalog no. 640943), and PE-Vio 770–conjugated TF (Miltenyi Biotec, Bergisch Gladbach, Germany) for 15 minutes at room temperature in the dark. Annexin V–binding buffer (BioLegend) was then added, and the samples were incubated for an additional 5 minutes. Samples were diluted in phosphate-buffered saline and analyzed on a Cytek Aurora Flow Cytometer 2 (Cytek, Fremont, CA). Events were quantitated and expressed as the count per μL of plasma. Compensation beads (3 μm) (BioLegend) served as a control for EV size.
Statistical analysis
All data were analyzed using GraphPad Prism. Outliers were identified and removed from further analysis using Rout (Q = 1%) analysis. Two control samples and 1 COVID-19 sample for TFPI assay, and 1 COVID-19 sample for thrombin generation assays were identified as outliers. Analysis for normal or lognormal distribution was performed using the D'Agostino and Pearson (n > 6) or Shapiro-Wilk (n < 6) tests. For data showing a normal or lognormal distribution, the unpaired Student t test, paired Student t test, or simple linear regression analysis were used. The nonparametric Mann-Whitney U or Wilcoxon matched-pairs signed-rank tests were used for data in a non-normal distribution. A multivariate analysis with Pearson correlation was performed to analyze associations among multiple variables.
Results
Initiation of thrombin generation is delayed in COVID-19
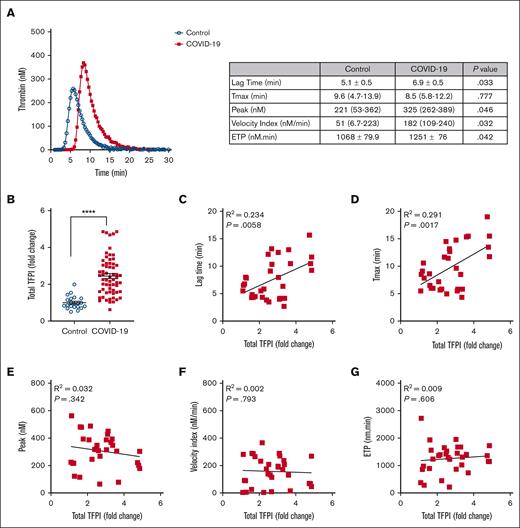
Table 1 summarizes the demographics, clinical characteristics, and clinical outcomes for the 81 patients with COVID-19 and 49 control participants included in this analysis. Thrombin generation potential was measured using PFP collected from patients with COVID-19 at baseline, defined as the day of enrollment in the previously reported clinical trial.18 Similar to previous reports,8,10-12 thrombin generation potential was greater in COVID-19 plasma than control plasma, reflected by greater peak thrombin (P < .05), velocity index (P < .05), and ETP (P < .01); paradoxically, however, the lag time was prolonged in COVID-19 plasma compared with control plasma (P < .05; Figure 1A).
Baseline characteristics and 30-day clinical outcomes
| Demographics . | Controls (N = 49) . | Patients with COVID-19 (N = 81) . |
|---|---|---|
| Median age, y (range) | 40.0 (20-77) | 64.0 (24-85) |
| Sex, n (%) male | 17 (34.7) | 49 (60.0) |
| Median BMI, kg/m2 (IQR) | 25.9 (19.2-31.5) | 33.2 (21.4-50.9) |
| Median laboratory values (IQR) | ||
| White blood cell count (×109/L) | 5.3 (2.4-6.0) | 10.1 (3.4-27.7) |
| Neutrophil count (×109/L) | 3.2 (1.7-3.3) | 7.6 (0.6-25.4) |
| Lymphocyte count (×109/L) | 1.6 (0.6-2.8) | 0.8 (0.1-3.1) |
| Monocyte count (×109/L) | 0.4 (0.1-0.9) | 0.5 (0.1-1.3) |
| Platelet count (×109/L) | 252 (158-442) | 242 (85-712) |
| Hemoglobin (g/dL) | 14.8 (13.8-16.1) | 12.4 (6.7-16.5) |
| Hematocrit (%) | 43.2 (40.3-46.5) | 38.0 (21.0-48.0) |
| D-dimer (μg/mL FEU) | ND∗ | 1.8 (0.2->35) |
| Fibrinogen (mg/dL) | ND∗ | 542 (174-1000) |
| Clinical outcomes | ||
| 30-Day mortality, n (%) | 0 | 19 (23.4) |
| ICU admission, n (%) | 0 | 59 (72.8) |
| Intubation, n (%) | 0 | 31 (38.3) |
| Acute kidney injury, n (%) | 0 | 18 (22.2) |
| Arterial thrombosis, n (%) | 0 | 5 (6.2) |
| Venous thrombosis, n (%) | 0 | 5 (6.2) |
| Major or minor bleeding, n (%) | 0 | 15 (18.5) |
| Median length of hospitalization, d (IQR) | 0 | 9.5 (1-24) |
BMI, body mass index; FEU, fibrinogen equivalent units; ICU, intensive care unit; IQR, interquartile range.
Not determined.
Baseline TFPI concentration is associated with delayed initiation of thrombin generation in COVID-19 plasma. (A) PFP from patients with COVID-19 (red squares) and healthy controls (blue circles) was treated with heparinase, and thrombin generation was triggered by 1 pM TF and phospholipids. Data were collected for lag time, Tmax, thrombin peak, velocity index, and ETP. Representative thrombin generation curves are presented, and the table shows comparisons of thrombin generation parameters between controls (n = 21) and patients with COVID-19 (n = 40). Data showing normal distribution are presented as mean ± standard error and were analyzed using the unpaired t test. Data not showing normal distribution are presented as median (interquartile range) and were analyzed using the Mann-Whitney U test. (B) Total TFPI levels in plasma from healthy controls (blue circles; n = 22) and patients with COVID-19 (red squares; n = 62) were measured by ELISA. Data are shown as fold change from the mean value of healthy controls, presented as mean ± standard error, and analyzed using the unpaired t test. ∗∗∗∗P < .0001. (C-G) Simple linear regression analysis of thrombin generation potential parameters and TFPI in COVID-19 plasma (n = 31).
Baseline TFPI concentration is associated with delayed initiation of thrombin generation in COVID-19 plasma. (A) PFP from patients with COVID-19 (red squares) and healthy controls (blue circles) was treated with heparinase, and thrombin generation was triggered by 1 pM TF and phospholipids. Data were collected for lag time, Tmax, thrombin peak, velocity index, and ETP. Representative thrombin generation curves are presented, and the table shows comparisons of thrombin generation parameters between controls (n = 21) and patients with COVID-19 (n = 40). Data showing normal distribution are presented as mean ± standard error and were analyzed using the unpaired t test. Data not showing normal distribution are presented as median (interquartile range) and were analyzed using the Mann-Whitney U test. (B) Total TFPI levels in plasma from healthy controls (blue circles; n = 22) and patients with COVID-19 (red squares; n = 62) were measured by ELISA. Data are shown as fold change from the mean value of healthy controls, presented as mean ± standard error, and analyzed using the unpaired t test. ∗∗∗∗P < .0001. (C-G) Simple linear regression analysis of thrombin generation potential parameters and TFPI in COVID-19 plasma (n = 31).
Delayed thrombin generation in COVID-19 is associated with elevated plasma TFPI
We hypothesized that elevated plasma TFPI, which inhibits the initiation of blood coagulation,14 is responsible for the prolonged lag time of thrombin generation in COVID-19 plasma. Elevated plasma TFPI has been observed in some previous studies of patients with COVID-19.12,15-17 In agreement with these previous reports, we found that plasma TFPI was higher in patients with COVID-19 than in controls (P < .0001; Figure 1B). Plasma TFPI was positively associated with lag time (P < .01) and Tmax (P < .01) in thrombin generation assays (Figure 1C-D). TFPI was not associated with peak thrombin, velocity index, or ETP (Figure 1E-G).
TFPI neutralization corrects the prolonged thrombin generation lag time in COVID-19
To confirm the mechanistic role of TFPI in delaying the initiation of thrombin generation in COVID-19 plasma, we treated PFP with either an anti-TFPI antibody or control immunoglobulin G. Addition of the anti-TFPI antibody shortened the lag time (P < .0001) and Tmax (P < .0001) in COVID-19 plasma to values indistinguishable from control plasma (Figure 2A-C). The anti-TFPI antibody also decreased ETP in COVID-19 plasma (P < .05; Figure 3D), suggesting a small effect in dampening overall thrombin generation potential.
TFPI prolongs the initiation of thrombin generation in plasma from patients with COVID-19. PFP from controls (n = 5) or patients with COVID-19 (n = 8) were first treated with heparinase and then incubated with either a neutralizing anti-TFPI antibody or control immunoglobulin G (IgG) for 30 minutes before triggering thrombin generation with TF and phospholipids. (A) Representative thrombin generation curves are presented, and the table shows comparisons of thrombin generation parameters between paired samples treated with anti-TFPI antibody vs control IgG. (B-D) Individual data points for lag time (B), Tmax (C), and ETP (D) are presented as mean ± standard error for all except the lag time for controls are presented as median (interquartile range). Data presented as mean ± standard error were analyzed using the paired t test, and those with median (interquartile range) were analyzed using the Wilcoxon matched-pairs signed-rank test. ns, P > .05; ∗P < .05; ∗∗∗∗P < .0001. ns, not significant.
TFPI prolongs the initiation of thrombin generation in plasma from patients with COVID-19. PFP from controls (n = 5) or patients with COVID-19 (n = 8) were first treated with heparinase and then incubated with either a neutralizing anti-TFPI antibody or control immunoglobulin G (IgG) for 30 minutes before triggering thrombin generation with TF and phospholipids. (A) Representative thrombin generation curves are presented, and the table shows comparisons of thrombin generation parameters between paired samples treated with anti-TFPI antibody vs control IgG. (B-D) Individual data points for lag time (B), Tmax (C), and ETP (D) are presented as mean ± standard error for all except the lag time for controls are presented as median (interquartile range). Data presented as mean ± standard error were analyzed using the paired t test, and those with median (interquartile range) were analyzed using the Wilcoxon matched-pairs signed-rank test. ns, P > .05; ∗P < .05; ∗∗∗∗P < .0001. ns, not significant.
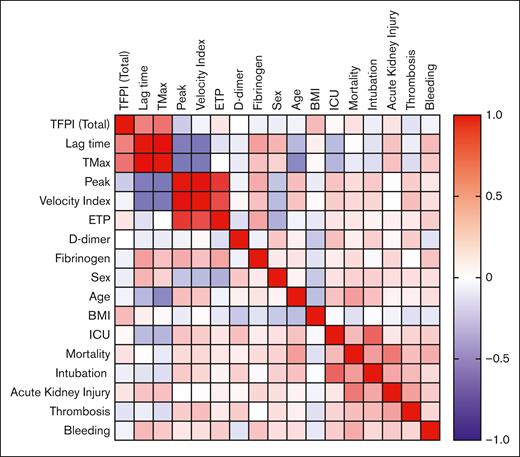
Multivariate analysis. A heat map showing multivariate analysis with Pearson correlation between plasma levels of TFPI, parameters of thrombin generation, demographic factors, and clinical outcomes. n = 81. Refer to supplemental Table 1 for R values and P values. BMI, body mass index; ICU, intensive care unit.
Multivariate analysis. A heat map showing multivariate analysis with Pearson correlation between plasma levels of TFPI, parameters of thrombin generation, demographic factors, and clinical outcomes. n = 81. Refer to supplemental Table 1 for R values and P values. BMI, body mass index; ICU, intensive care unit.
Multivariate correlation analysis
To assess the relationships between plasma TFPI, thrombin generation parameters, and clinical outcomes, a multivariate Pearson correlation analysis was performed using data from the 81 patients with COVID-19 (Figure 3; supplemental Table 1). Plasma TFPI correlated with lag time (R = 0.48; P < .01) and Tmax (R = 0.54; P < .01) but not with 30-day mortality or clinical outcomes. Lag time correlated directly with Tmax (R = 0.93; P < .0001) and inversely with peak thrombin (R = −0.46; P < .01) and velocity index (R = −0.49; P < .01). As expected,23 30-day mortality correlated with age (R = 0.37; P < .001) and indicators of COVID-19 clinical severity, including admission to an intensive care unit (R = 0.26; P < .05), intubation (R = 0.38; P < .001), acute kidney injury (R = 0.52; P < .0001), thrombosis (R = 0.24; P < .05), and major or minor bleeding (R = 0.32; P < .01).
Plasma TFPI is associated with TEG initial clot formation
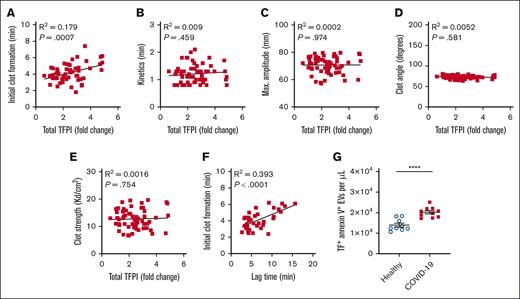
Whole-blood TEG was performed in 78 patients with COVID-19. The time to initial clot formation was positively associated with plasma TFPI (P < .001; Figure 4A). There were no significant associations between plasma TFPI and TEG kinetics, maximum amplitude, clot angle, or clot strength (Figures 4B-E). TEG initial clot formation was strongly associated with thrombin generation lag time (P < .0001; Figure 4F). The strong correlation between plasma TFPI and time to initial clot formation in TEG was observed despite TEG being triggered with the contact activator kaolin rather than TF. This association suggested an inhibitory activity of TFPI on endogenous TF in COVID-19 plasma. Accordingly, we found that the plasma concentration of TF/annexin V double–positive EVs was higher in COVID-19 plasma than in control plasma (P < .0001; Figure 4G).
TFPI is associated with initial clot formation in whole-blood TEG in COVID-19. (A-E) Simple linear regression analysis of plasma total TPFI vs whole-blood TEG parameters in COVID-19 (n = 60). (F) Simple linear regression analysis of TEG initial clot formation vs thrombin generation lag time (n = 38). (G) Plasma concentration of TF/annexin V double–positive EVs in healthy controls (n = 9) and patients with COVID-19 (n = 10). Data are presented as mean ± standard error and were analyzed using the unpaired t test. ∗∗∗∗P < .0001. max, maximum.
TFPI is associated with initial clot formation in whole-blood TEG in COVID-19. (A-E) Simple linear regression analysis of plasma total TPFI vs whole-blood TEG parameters in COVID-19 (n = 60). (F) Simple linear regression analysis of TEG initial clot formation vs thrombin generation lag time (n = 38). (G) Plasma concentration of TF/annexin V double–positive EVs in healthy controls (n = 9) and patients with COVID-19 (n = 10). Data are presented as mean ± standard error and were analyzed using the unpaired t test. ∗∗∗∗P < .0001. max, maximum.
Plasma TFPIα is elevated in COVID-19
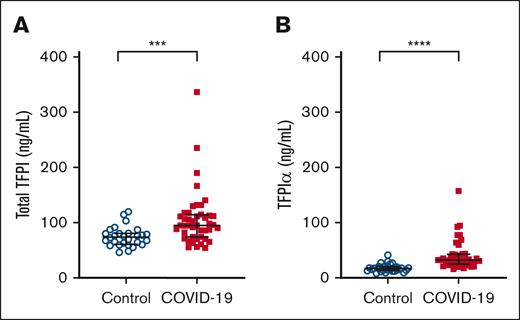
TFPI is expressed as multiple isoforms that are regulated through alternative splicing.14 TFPIα is expressed by endothelial cells and platelets and is the isoform of TFPI that is heparin releasable.21 Because most (>90%) of the patients with COVID-19 had received heparin or enoxaparin before blood sample collection, we performed an isoform-specific ELISA that uses a single capture antibody with isoform-specific secondary antibodies to measure plasma levels of both total TFPI and TFPIα in patients with COVID-19 and in controls. With this assay, we found that plasma levels of both total TFPI (P < .001; Figure 5A) and TFPIα (P < .0001; Figure 5B) were elevated in patients with COVID-19 compared to controls. In both COVID-19 and control plasma, TFPIα accounted for <35% of total TFPI, which is consistent with previous reports.21,24
Plasma TFPIα is elevated in COVID-19. The isoform distribution of plasma TFPI was determined by measuring total TFPI (A) and TFPIα (B) by ELISA using a monoclonal anti-TFPI-K2 antibody for capture and biotinylated monoclonal anti-TFPI-K1 (total TFPI) or anti-TFPI-K3 (TFPIα) antibodies in controls (n = 29) and patients with COVID-19 (n = 44). Data are presented as median (interquartile range) and were analyzed using the Mann-Whitney U test.
Plasma TFPIα is elevated in COVID-19. The isoform distribution of plasma TFPI was determined by measuring total TFPI (A) and TFPIα (B) by ELISA using a monoclonal anti-TFPI-K2 antibody for capture and biotinylated monoclonal anti-TFPI-K1 (total TFPI) or anti-TFPI-K3 (TFPIα) antibodies in controls (n = 29) and patients with COVID-19 (n = 44). Data are presented as median (interquartile range) and were analyzed using the Mann-Whitney U test.
Discussion
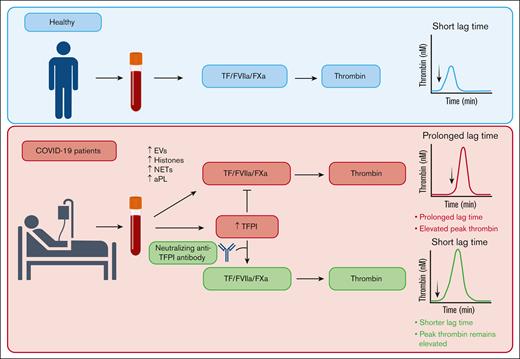
The prothrombotic state of COVID-19 is reflected by increased thrombin generation potential in patients with acute SARS-CoV-2 infection.8,10-13 In this study, we used plasma samples collected from hospitalized adult patients with COVID-19 enrolled in a clinical trial early in the COVID-19 pandemic18 to assess the contribution of TFPI to thrombin generation in patients with COVID-19 and assess its association with thrombosis and other clinical outcomes. We found that, despite an overall increase in thrombin generation potential, high levels of TFPI in COVID-19 plasma delayed thrombin generation, an effect that may be expected to protect from thrombotic disease. We demonstrated that a neutralizing anti-TFPI antibody not only shortened the lag time in COVID-19 plasma but also normalized the difference in lag time between controls and patients with COVID-19, with minimal or no effects on peak thrombin, velocity index, or ETP (Figure 6). Although elevated plasma TFPI delayed initiation of thrombin generation, it was not associated with mortality or the incidence of clinical thrombotic events in patients hospitalized with COVID-19.
Summary of effects of elevated plasma TFPI on thrombin generation in patients with COVID-19. COVID-19 enhances thrombin generation via multiple mechanisms, including EVs, histones, NETs, and aPL.13 Elevated plasma TFPI prolongs the lag time to thrombin generation but does not diminish peak thrombin. aPL, antiphospholipid antibody; FXa, factor Xa; FVIIa, factor VIIa; NET, neutrophil extracellular trap.
Summary of effects of elevated plasma TFPI on thrombin generation in patients with COVID-19. COVID-19 enhances thrombin generation via multiple mechanisms, including EVs, histones, NETs, and aPL.13 Elevated plasma TFPI prolongs the lag time to thrombin generation but does not diminish peak thrombin. aPL, antiphospholipid antibody; FXa, factor Xa; FVIIa, factor VIIa; NET, neutrophil extracellular trap.
Our results are consistent with some previous studies that also found a delayed lag time to initiation of thrombin generation in plasma from patients with COVID-19.8,10-12 However, the prognostic value of thrombin generation lag time and the role of TFPI in COVID-19 disease severity and clinical outcomes are uncertain.25 TFPI is an endogenous Kunitz-type serine protease inhibitor that is expressed by endothelial cells and platelets and inhibits both the TF/factor VIIa complex and early forms of prothrombinase.14,21 The results of the TFPI neutralization experiments (Figure 2) are concordant with those of Kelliher et al,12 who found that an anti-TFPI antibody shortened the thrombin generation lag time in a small cohort of patients with nonsevere COVID-19. Unlike the patients with more severe COVID-19 in our study, 73% of whom received critical care (Table 1), plasma levels of TFPI were not elevated in the patients with nonsevere COVID-19 in the Kelliher et al12 study.
Elevation of plasma TFPI in patients with COVID-19 also correlated with prolonged time to initial clot formation by kaolin-triggered TEG, in which coagulation is initiated by contact activation rather than TF. This correlation likely reflects TFPI inhibition of circulating TF in the form of TF-positive EVs26,27 (Figure 4G) and/or neutrophil extracellular traps4 in COVID-19 plasma. TFPI is also a direct inhibitor of factor Xa and inhibits early forms of the prothrombinase complex.28 These TFPI inhibitory activities also may contribute to the correlation between TFPI and the time to clot in the kaolin-initiated TEG. The relationship between TFPI, thrombin generation, and clot formation also may be affected by depletion of protein S from COVID-19 plasma.29 In addition to functioning as a cofactor for activated protein C, protein S promotes the anticoagulant activity of TFPIα.30 Loss of plasma protein S might be expected to blunt the effects of TPFI on lag time and initial clot formation and contribute to higher peak thrombin in COVID-19 plasma.
The causes of the elevation of circulating TFPI in patients with COVID-19 are likely to be multifactorial and may include proinflammatory effects of SARS-CoV-2 infection on expression of TFPI. It is also possible that treatment of patients with COVID-19 with heparin contributed to increased plasma levels of TFPI. Of patients with COVID-19 in our study, >90% had received enoxaparin and/or unfractionated heparin before baseline sample collection.18 Both low-molecular weight and unfractionated heparins are known to mediate increases in plasma TFPI concentration,31 likely via heparin-induced release of TFPIα from the extracellular matrix.21 We found that plasma levels of TFPIα were significantly elevated in COVID-19 compared with controls (Figure 5) but the fraction of total TFPI represented by TFPIα was <35% in both groups. These findings suggest that heparin-mediated release of TFPIα alone cannot account for the difference in total TFPI between COVID-19 and controls. Future studies should include measurement of TFPI and TFPIα before and after administration of heparin. Nevertheless, to preclude any effects of residual heparin on thrombin generation assays, we treated all plasma samples with heparinase before measuring thrombin generation.
Questions remain to be answered about the prothrombotic effects of infection with SARS-CoV-2. The relationships between thrombin generation parameters and thrombotic risk and clinical outcomes in COVID-19 remain largely undefined. The thromboinflammatory mechanisms are complex and likely differ between nonhospitalized patients, hospitalized patients with differing disease severity, and patients with postacute sequela of COVID-19. Critically ill patients with COVID-19 can progress to severe consumption coagulopathy that depletes clotting factors and may delay thrombin generation independently of TFPI. Additional studies are needed to clarify the distinct roles of TFPI isoforms in COVID-19–associated coagulopathy. We note that the samples in our analysis were collected relatively early in the COVID-19 pandemic, before the emergence of SARS-CoV-2 variants and subvariants, which may vary in their effects on hemostasis and thrombosis. These questions remain to be evaluated in future longitudinal studies.
Acknowledgments
The authors acknowledge Diagnostica Stago Inc (Parsippany, NJ) for loaning a Fluoroskan Ascent instrument for thrombin generation assays.
This work was supported by funding from the National Institutes of Health, National Institute of Allergy and Infectious Diseases and National Heart, Lung, and Blood Institute (awards R01 AI162778, HL168630, HL068835, and T32 HL007344), Department of Veterans Affairs grant I01CX001932, and a pilot grant from the Roy J. Carver Charitable Trust.
Authorship
Contribution: A.S.E. designed and conducted the experiments; M.K.P.K. provided scientific input; J.A.P. performed TFPI enzyme-linked immunosorbent assays; A.E.M. provided expertise with tissue factor pathway inhibitor assays and helped with interpretation; S.R.L. helped with patient recruitment and participated in designing experiments, and data interpretation; S.D. directed the project and participated in designing experiments and data interpretation; and all authors assisted with the preparation and editing of the manuscript.
Conflict-of-interest disclosure: The authors declare no competing financial interests.
Correspondence: Sanjana Dayal, Department of Internal Medicine, University of Iowa Carver College of Medicine, 100D, EMRB, 200 Hawkins Dr, Iowa City, IA 52242; email: sanjana-dayal@uiowa.edu.
References
Author notes
Data are available on request from the corresponding author, Sanjana Dayal (sanjana-dayal@uiowa.edu).
The online version of this article contains a data supplement.

