Key Points
TYK2 is essential for the amelioration of MPN features by IFN-α.
The mechanism of action of IFN-α is different between Jak2V617F HSCs and Jak2V617F progenitors.
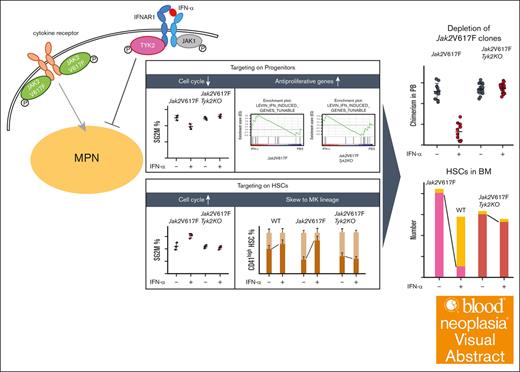
Visual Abstract
Interferon-α (IFN-α) exhibits antiviral and antiproliferative effects on normal and neoplastic cells. Intracellular signaling of IFN-α is mediated by tyrosine kinase 2 (TYK2) and janus kinase 1 (JAK1), followed by signal transducers and activators of transcription (STATs). TYK2 is redundant for the antiviral effect of IFN-α; however, the requirements for antiproliferative effects are unknown. We assessed the role of TYK2 in the effects of IFN-α in myeloproliferative neoplasm (MPN) model mice. Jak2V617F transgenic mice develop MPNs resembling human primary myelofibrosis, and ropeginterferon-α-2b ameliorated their features. However, these IFN-α effects were absent in Jak2V617F;Tyk2−/− mice. In mixed wild-type (WT)/Jak2V617F chimeric mice, IFN-α treatment induces Jak2V617F hematopoietic stem cells (HSCs) to enter the cell cycle and skew their differentiation into the megakaryocyte lineage, decreasing the number of Jak2V617F HSCs. The effects of IFN-α on Jak2V617F HSCs were not observed in mixed WT/Jak2V617F;Tyk2−/− mice, indicating that TYK2 is essential for the effects of IFN-α on both Jak2V617F progenitors and HSCs. The mechanism of IFN-α in Jak2V617F HSCs and progenitors differed: genes regulating the cell cycle were enriched in IFN-α–stimulated Jak2V617F HSCs, but not in Jak2V617F progenitors; genes regulating antiproliferation were enriched in IFN-α–stimulated Jak2V617F progenitors but not in Jak2V617F HSCs. The major IFN-α signaling molecule activated by JAKs is STAT1, which is essential for the antiviral effect. Most effects of IFN-α on Jak2V617F cells were preserved in Jak2V617F;Stat1−/− mice but to a moderate degree compared with Jak2V617F mice. Our study reveals essential roles of TYK2 for the preferential suppressive effect of IFN-α on Jak2V617F progenitors and HSCs.
Introduction
Myeloproliferative neoplasms (MPNs) are clonal hematopoietic stem cell (HSC) diseases characterized by enhanced production of differentiated blood cells.1 Classical MPNs are classified into 3 types: polycythemia vera (PV), essential thrombocythemia, and primary myelofibrosis (PMF). Most MPN cases harbor mutations in Janus kinase 2 (JAK2), CALR, or MPL,2 which induce constitutive activation of JAK2, leading to autonomous cell growth.2 Current therapies for MPNs include phlebotomy, hydroxyurea, anagrelide, interferon-α (IFN-α), JAK inhibitors, and allogeneic stem cell transplantation.3,4 Treatment with IFN-α can induce hematological remission, reduce JAK2V617F allele burden, and induce molecular remission in some patients with PV.5-10 Ropeginterferon-α-2b (ropeg-IFN-α) is a monopegylated IFN-α-2b that exhibits the clinical benefits in PV treatment.11,12
IFN-α exhibits antiviral and antiproliferative effects in normal and neoplastic cells.13-15 The binding of IFN-α to its high-affinity receptors on the cell surface results in the activation of JAK1 and tyrosine kinase 2 (TYK2), which are receptor-associated JAKs.16-19 Activated JAKs phosphorylate additional tyrosine residues on IFN-α receptors, followed by activation of many signaling molecules, including signal transducers and activators of transcription (STATs).20-22 One of the most important functions of IFN-α is its antiviral activity. Vesicular stomatitis virus produces all the cytopathic effects in embryonic fibroblasts, and IFN-α resists the cytopathic effects of vesicular stomatitis virus in wild-type (WT) fibroblasts in a dose-dependent manner. In Jak1-deficient fibroblasts and Stat1-deficient fibroblasts, the IFN-α–induced antiviral effect is completely abolished, indicating the essential role of JAK1 and STAT1 for the antiviral activity of IFN-α.23,24 In contrast, high concentrations of IFN-α can protect Tyk2-deficient embryonic fibroblasts, indicating that TYK2 is not required for IFN-α–induced antiviral activity.25 The antiproliferative effect is another important activity of IFN-α. The in vitro growth of B-cell progenitors, early erythroid progenitors, and myeloid progenitors (colony-forming unit–granulocyte macrophage [CFU-GM]) is suppressed in the presence of IFN-α. This suppression was partially inhibited by a deficiency in TYK2, suggesting that TYK2 may be needed to transduce the cell growth–inhibitory signals of IFN-α26,27; however, its roles on HSCs and malignant MPN clones and that in in vivo IFN-α signaling remain unknown.
Therefore, we aimed to clarify whether the therapeutic effects of IFN-α in Jak2V617F mice are mediated by TYK2.
Methods
Mice
Jak2V617F transgenic and Tyk2 deficient (Tyk2−/−) mice were previously generated.25,28 Of 2 lines of Jak2V617F transgenic mice, line 2, which exhibits characteristics resembling human PMF (such as leukocytosis, thrombocytosis, anemia, splenomegaly, and bone marrow [BM] fibrosis), was used.28Stat1-knockout mice (Stat1−/− mice)24 were purchased from Taconic Biosciences (Germantown, NY) while processing the backcrossing to the B6 strain. Mixed 129 and B6 chimeric mice were used for this experiment. All animal studies were performed in accordance with the ethics committee of the University of Miyazaki, Japan.
In vivo IFN-α treatment of mice
Mice were subcutaneously injected once a week for 8 weeks with 600 ng (25 μg/kg) of murine ropeg-IFN-α (provided by PharmaEssentia, Taipei, Taiwan) or phosphate-buffered saline (PBS), and analyzed 48 hours after the last injection. For RNA-sequencing analysis of CD150+, lineage negative (Lin−), Sca-1+, and c-Kit+ (CD150+LSK) cells and granulocyte–monocyte progenitors (GMPs; IL-7Rα−Lin−c-Kit+Sca-1−FcγR+CD34+), and for quantitative polymerase chain reaction of CD150+LSK cells, GMPs, and Lin− and c-Kit+ (LK) cells, ropeg-IFN-α or PBS were administered for 4 weeks.
Blood analysis
Peripheral blood (PB) was taken from the tail vein, and BM cells were obtained from 2 femurs and 1 tibia at 48 hours after the last injection.
Fibrocyte culture
BM cells in FibroLife (Lifeline Cell Technology, Oceanside, CA) were cultured at 2 × 10⁵ cells per well. After 7 days, the medium was changed and ropeg-IFN-α or PBS was added. The number of fibrocytes was counted on day 12.
Western blotting
BM and spleen cells were treated with murine IFN-α (1000 U/mL; #12100-1, PBL Assay Science, NJ) for 15 minutes. Western blot analysis was done as described in the Supplemental methods.
Statistical analysis
Statistical analysis was performed using the Student t test or Mann-Whitney U test for 2 groups, or 1-way analysis of variance with the post hoc Tukey test for comparison of >2 groups. Principal component analysis (PCA) assessed impacts of genetic and treatment variations across groups, detailed in the supplemental Information. Statistically significant differences were marked on the graphs to facilitate comparison. The 50% inhibitory concentration (IC50) was measured using a 4-parameter log-logistic model.
Results
TYK2 is essential for IFN-α–induced improvement of myeloproliferative features in Jak2V617F mice
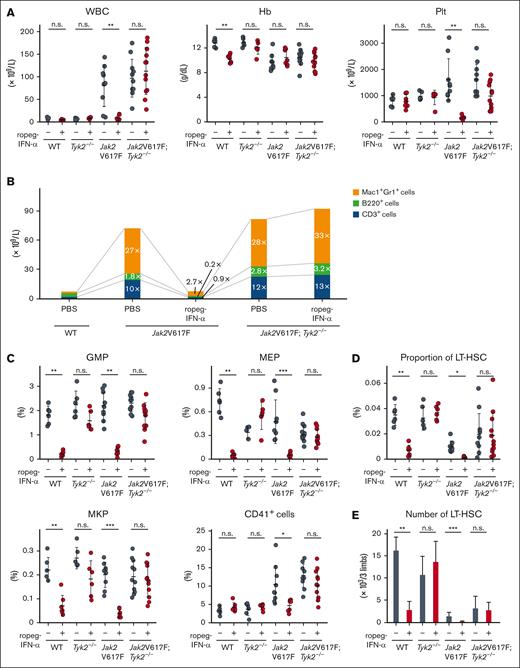
Jak2V617F mice develop human PMF-resembling features and Jak2V617F;Tyk2−/− mice exhibited myeloproliferative features similar to those observed in Jak2V617F mice.28,29 Eight-week-old Jak2V617F and Jak2V617F;Tyk2−/− mice were injected subcutaneously with 600 ng of ropeg-IFN-α or PBS, weekly for 8 weeks. Ropeg-IFN-α treatment was associated with a significant reduction in leukocyte and platelet counts in Jak2V617F mice but had no effect on hemoglobin levels (Figure 1A). The platelet count in WT mice remained consistent at 600 ng of ropeg-IFN-α but reduced by 900 ng of ropeg-IFN-α (supplemental Figure 1). In Jak2V617F;Tyk2−/− mice, the leukocyte and platelet counts remained unchanged after ropeg-IFN-α treatment. In Jak2V617F mice, the number of PB Mac1+Gr1+ myeloid cells, B220+ B cells, and CD3+ T cells increased by 27-fold, 1.8-fold, and 10-fold, respectively, compared with that in WT mice (Figure 1B). Ropeg-IFN-α treatment reduced the numbers of PB myeloid cells, B cells, and T cells by the same amount. In Jak2V617F;Tyk2−/− mice, the number of myeloid, B, and T lymphocytes in the PB was not affected by ropeg-IFNα treatment.
Effect of IFN-α on PB or BM cells in Jak2V617F and Jak2V617F;Tyk2−/− mice. (A) PB cell counts after treatment with ropeg-IFN-α. PBS or 600 ng of ropeg-IFN-α was injected weekly for 8 weeks. WT mice (n = 6 per PBS, and n = 7 per ropeg-IFN-α treatment); Tyk2−/− mice (n = 6 per PBS, and n = 6 per ropeg-IFN-α treatment); Jak2V617F mice (n = 9 per PBS, and n = 7 per ropeg-IFN-α treatment); and Jak2V617F;Tyk2−/− mice (n = 11 per PBS, and n = 12 per ropeg-IFN-α treatment). At 48 hours after the last treatment, PB leukocyte count, Hb level, and platelet count were measured. Data were presented as mean ± standard deviation (SD). (B) Changes in PB hematopoietic compartments after treatment with ropeg-IFN-α. The fold change of each Mac1+Gr1+ cell, B220+ cell, and CD3+ cell fraction in the PB from Jak2V617F and Jak2V617F;Tyk2−/− mice was presented as the comparison with those in the PB from WT mice treated with PBS. (C) BM progenitors after 8 weeks of treatment with ropeg-IFN-α. At 48 hours after the last treatment, the proportion of GMPs, MEPs, MKPs, and CD41+ cells in the BM was analyzed. Data are presented as mean ± SD. (D) The proportion of LT-HSCs in the BM after treatment with ropeg-IFN-α. A reduction in LT-HSC proportions was observed in ropeg-IFN-α–treated Jak2V617F mice, whereas no reduction was observed in Jak2V617F;Tyk2−/− mice. Data are presented as mean ± SD. (E) Analysis of the number of LT-HSCs after 8 weeks of treatment with ropeg-IFN-α. The total number of LT-HSCs in 2 femurs and 1 tibia is shown. Data are presented as mean ± SD. Statistical significance was determined by the Tukey test after 1-way analysis of variance (ANOVA). ∗P < .05; ∗∗P < .01; and ∗∗∗P < .001. WBC, white blood cell; Hb, hemoglobin; Plt, platelet; n.s., not significant.
Effect of IFN-α on PB or BM cells in Jak2V617F and Jak2V617F;Tyk2−/− mice. (A) PB cell counts after treatment with ropeg-IFN-α. PBS or 600 ng of ropeg-IFN-α was injected weekly for 8 weeks. WT mice (n = 6 per PBS, and n = 7 per ropeg-IFN-α treatment); Tyk2−/− mice (n = 6 per PBS, and n = 6 per ropeg-IFN-α treatment); Jak2V617F mice (n = 9 per PBS, and n = 7 per ropeg-IFN-α treatment); and Jak2V617F;Tyk2−/− mice (n = 11 per PBS, and n = 12 per ropeg-IFN-α treatment). At 48 hours after the last treatment, PB leukocyte count, Hb level, and platelet count were measured. Data were presented as mean ± standard deviation (SD). (B) Changes in PB hematopoietic compartments after treatment with ropeg-IFN-α. The fold change of each Mac1+Gr1+ cell, B220+ cell, and CD3+ cell fraction in the PB from Jak2V617F and Jak2V617F;Tyk2−/− mice was presented as the comparison with those in the PB from WT mice treated with PBS. (C) BM progenitors after 8 weeks of treatment with ropeg-IFN-α. At 48 hours after the last treatment, the proportion of GMPs, MEPs, MKPs, and CD41+ cells in the BM was analyzed. Data are presented as mean ± SD. (D) The proportion of LT-HSCs in the BM after treatment with ropeg-IFN-α. A reduction in LT-HSC proportions was observed in ropeg-IFN-α–treated Jak2V617F mice, whereas no reduction was observed in Jak2V617F;Tyk2−/− mice. Data are presented as mean ± SD. (E) Analysis of the number of LT-HSCs after 8 weeks of treatment with ropeg-IFN-α. The total number of LT-HSCs in 2 femurs and 1 tibia is shown. Data are presented as mean ± SD. Statistical significance was determined by the Tukey test after 1-way analysis of variance (ANOVA). ∗P < .05; ∗∗P < .01; and ∗∗∗P < .001. WBC, white blood cell; Hb, hemoglobin; Plt, platelet; n.s., not significant.
The number of nucleated cells in the sum of 2 femurs and 1 tibia was not changed by ropeg-IFN-α treatment in either Jak2V617F or Jak2V617F;Tyk2−/− mice (supplemental Figure 2). The proportions of BM progenitor cells, such as GMPs and megakaryocyte-erythroid progenitors (MEPs; IL-7Rα−Lin−c-Kit+Sca-1−FcγRloCD34−), and that of megakaryocyte lineage cells as megakaryocyte progenitors (MKPs; CD9+CD41+FcγRloc-Kit+Lin−) were markedly decreased by ropeg-IFN-α treatment in Jak2V617F mice. TYK2 deficiency abrogated these IFN-α effects, and their proportions did not change in Jak2V617F;Tyk2−/− mice after ropeg-IFN-α treatment (Figure 1C). The proportions of erythroid lineage cells, such as CD71+Ter119+ and CD71+Ter119− cells, were not changed by ropeg-IFN-α treatment in either Jak2V617F or Jak2V617F;Tyk2−/− mice (supplemental Figure 3). The proportion of long-term HSCs (LT-HSCs; CD150+48−Lin−Sca-1+c-Kit+) in the BM and the number of LT-HSCs in the sum of the 2 femurs and 1 tibia were decreased by ropeg-IFN-α treatment in Jak2V617F mice. However, a decrease in LT-HSCs by ropeg-IFN-α was not observed in Jak2V617F;Tyk2−/− mice (Figure 1D-E). The fraction of multipotent progenitor (MPP; CD150−48+ Lin−Sca-1+c-Kit+) in the BM increased after ropeg-IFNα treatment in Jak2V617F mice, but this increase was absent in Jak2V617F;Tyk2−/− mice (supplemental Figure 3).
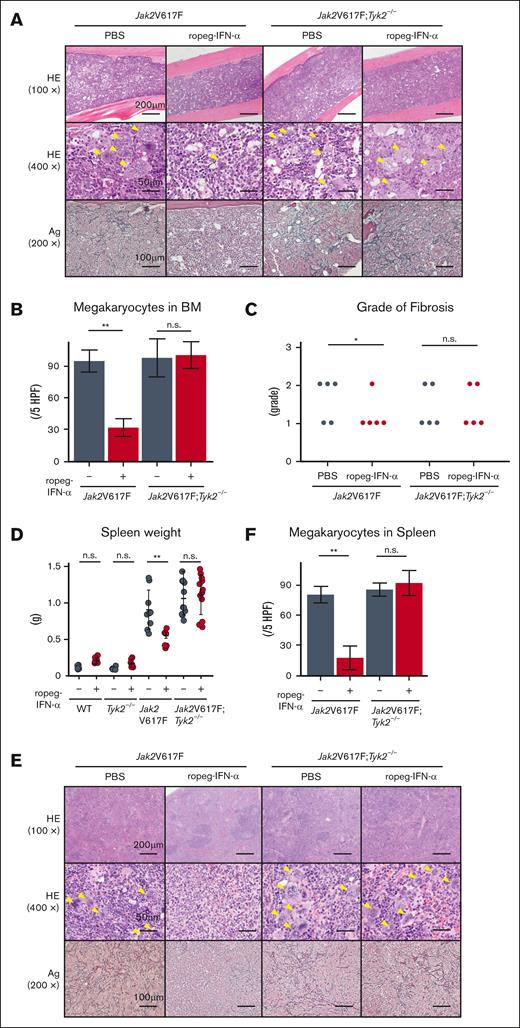
Jak2V617F mice developed BM fibrosis accompanied by an increase in the number of megakaryocytes (Figure 2A). A reduction in the number of megakaryocytes was also observed in Jak2V617F mice after ropeg-IFN-α treatment (Figure 2B). The grade of BM fibrosis was scored for each mouse. All PBS-treated Jak2V617F mice exhibited grade 1 or 2 fibrosis, whereas BM fibrosis disappeared in 4 Jak2V617F mice after an 8-week course of ropeg-IFNα treatment, and 1 Jak2V617F mouse continued to exhibit grade 1 fibrosis (Figure 2C). In Jak2V617F;Tyk2−/− mice, IFN-α–induced amelioration of BM fibrosis was not observed. All ropeg-IFN-α–treated Jak2V617F;Tyk2−/− mice exhibited a similar grade of fibrosis as PBS-treated mice, and the number of immature megakaryocytes remained high despite treatment. Jak2V617F mice exhibited splenomegaly (Figure 2D). Normal splenic architecture was destroyed, along with an increased proportion of myeloid progenitors and megakaryocytes (Figure 2E-F; supplemental Figure 4). Fibrosis was also observed. An 8-week ropeg-IFN-α treatment improved splenomegaly, restored splenic architecture, and resolved fibrosis in the Jak2V617F mice. The increased proportions of myeloid progenitors and of megakaryocyte lineage cells in the spleen were also reduced after ropeg-IFN-α treatment in Jak2V617F mice (supplemental Figure 4). These IFN-α effects on the spleen were not observed in Jak2V617F;Tyk2−/− mice. Splenomegaly, abnormal architecture, and fibrosis in the spleen were not ameliorated by ropeg-IFN-α treatment in Jak2V617F;Tyk2−/− mice. The proportion of myeloid progenitors and megakaryocyte lineage cells remained high in the spleen of Jak2V617F;Tyk2−/− mice after ropeg-IFN-α treatment.
Effect of IFN-α on histological features of the BM and spleen in Jak2V617F and Jak2V617F;Tyk2−/− mice. (A) The representative histological change in the BM after 8 weeks of 600 ng of ropeg-IFN-α treatment. Top, HE staining (100×); middle, HE staining (400×); bottom, silver (Ag) staining (200×). A yellow arrowhead indicates a megakaryocyte. (B) Megakaryocyte numbers in the BM after treatment with ropeg-IFN-α, assessed across 5 high-power fields (HPFs) per slide. Jak2V617F mice (n = 5 per each treatment group); Jak2V617F;Tyk2−/− mice (n = 5 per each treatment group). Data are presented as mean ± SD. Statistical significance was determined by the Tukey test after 1-way ANOVA. ∗∗P < .01. (C) Semiquantitative BM fibrosis grading (grades 0-3) after treatment with ropeg-IFN-α (n = 5 for each treatment group per each genotype). Statistical significance was determined by the Mann-Whitney U test for 2 groups; ∗P < .05. (D) Spleen weight after 8 weeks of treatment with ropeg-IFN-α. WT mice (n = 6 per PBS and n = 7 per ropeg-IFN-α treatment); Tyk2−/− mice (n = 6 per PBS and n = 6 per ropeg-IFN-α treatment); Jak2V617F mice (n = 9 per PBS and n = 7 per ropeg-IFN-α treatment); Jak2V617F;Tyk2−/− mice (n = 11 per PBS and n = 12 per ropeg-IFN-α treatment). Data are presented as mean ± SD. Statistical significance was determined by the Tukey test after 1-way ANOVA; ∗∗P < .01. (E) Histological changes in the spleen after treatment with ropeg-IFN-α. Top, HE staining (100×); middle, HE staining (400×); bottom, Ag staining (200×). A yellow arrowhead indicates a megakaryocyte. In Jak2V617F mice treated with PBS, myeloid lineage cells, including megakaryocytes, had invaded and destroyed normal splenic architecture, and fibrosis was evident. A ropeg-IFN-α treatment resolved fibrosis and restored the normal splenic architecture in these mice. Conversely, in Jak2V617F;Tyk2−/− mice, despite ropeg-IFN-α treatment, myeloid lineage cell invasion and fibrosis did not improve. (F) Megakaryocyte numbers in the spleen, assessed across 5 HPFs per slide. Jak2V617F mice (n = 5 per each treatment group); Jak2V617F;Tyk2−/− mice (n = 5 per each treatment group). Data are presented as mean ± SD. Statistical significance was determined by the Tukey test after 1-way ANOVA; ∗∗P < .01. HE, hematoxylin and eosin; n.s., not significant.
Effect of IFN-α on histological features of the BM and spleen in Jak2V617F and Jak2V617F;Tyk2−/− mice. (A) The representative histological change in the BM after 8 weeks of 600 ng of ropeg-IFN-α treatment. Top, HE staining (100×); middle, HE staining (400×); bottom, silver (Ag) staining (200×). A yellow arrowhead indicates a megakaryocyte. (B) Megakaryocyte numbers in the BM after treatment with ropeg-IFN-α, assessed across 5 high-power fields (HPFs) per slide. Jak2V617F mice (n = 5 per each treatment group); Jak2V617F;Tyk2−/− mice (n = 5 per each treatment group). Data are presented as mean ± SD. Statistical significance was determined by the Tukey test after 1-way ANOVA. ∗∗P < .01. (C) Semiquantitative BM fibrosis grading (grades 0-3) after treatment with ropeg-IFN-α (n = 5 for each treatment group per each genotype). Statistical significance was determined by the Mann-Whitney U test for 2 groups; ∗P < .05. (D) Spleen weight after 8 weeks of treatment with ropeg-IFN-α. WT mice (n = 6 per PBS and n = 7 per ropeg-IFN-α treatment); Tyk2−/− mice (n = 6 per PBS and n = 6 per ropeg-IFN-α treatment); Jak2V617F mice (n = 9 per PBS and n = 7 per ropeg-IFN-α treatment); Jak2V617F;Tyk2−/− mice (n = 11 per PBS and n = 12 per ropeg-IFN-α treatment). Data are presented as mean ± SD. Statistical significance was determined by the Tukey test after 1-way ANOVA; ∗∗P < .01. (E) Histological changes in the spleen after treatment with ropeg-IFN-α. Top, HE staining (100×); middle, HE staining (400×); bottom, Ag staining (200×). A yellow arrowhead indicates a megakaryocyte. In Jak2V617F mice treated with PBS, myeloid lineage cells, including megakaryocytes, had invaded and destroyed normal splenic architecture, and fibrosis was evident. A ropeg-IFN-α treatment resolved fibrosis and restored the normal splenic architecture in these mice. Conversely, in Jak2V617F;Tyk2−/− mice, despite ropeg-IFN-α treatment, myeloid lineage cell invasion and fibrosis did not improve. (F) Megakaryocyte numbers in the spleen, assessed across 5 HPFs per slide. Jak2V617F mice (n = 5 per each treatment group); Jak2V617F;Tyk2−/− mice (n = 5 per each treatment group). Data are presented as mean ± SD. Statistical significance was determined by the Tukey test after 1-way ANOVA; ∗∗P < .01. HE, hematoxylin and eosin; n.s., not significant.
In vitro growth inhibition of myeloid progenitors, MKPs, and fibrocytes by IFN-α
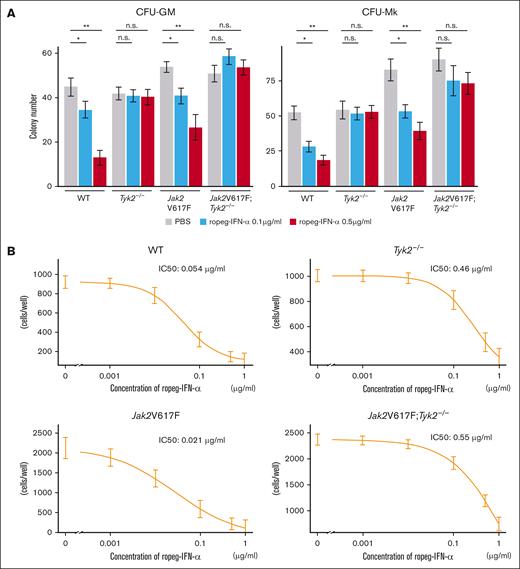
Next, we assessed the effects of IFN-α on cytokine-dependent colony formation. Colony numbers of CFU-GM and CFU-megakaryocyte from Jak2V617F mice were decreased to approximately half by treatment with 0.5 μg/mL ropeg-IFN-α (Figure 3A). In contrast, cytokine-dependent colony formation was not affected by the presence of IFN-α in Tyk2−/− and Jak2V617F;Tyk2−/− mice.
Effect of IFN-α on hematopoietic progenitors and fibrocytes in Jak2V617F and Jak2V617F;Tyk2−/− mice. (A) Number of hematopoietic progenitors, assessed by colony-forming assay. (Left) CFU-GM. (Right) CFU-Mk. BM cells (2 × 10⁴ per well) from WT, Tyk2−/−, Jak2V617F, and Jak2V617F;Tyk2−/− mice were plated in methylcellulose containing erythropoietin, interleukin-3 (IL-3), stem cell factor, and IL-6 for CFU-GM, and containing thrombopoietin, IL-3, IL-6, and IL-11 for CFU-Mk in the presence or absence of ropeg-IFN-α (0.1 and 0.5 μg/mL). The numbers of CFU-GMs and CFU-Mks were quantified after 7 days of culture. Each experiment was performed in duplicate, and 3 independent experiments were performed. Data are presented as mean ± standard error (SE) of 3 experiments. P values were calculated by the Tukey test after 1-way ANOVA; ∗P < .05; ∗∗P < .01. (B) Number of fibrocytes. BM cells (2 × 10⁵ per well) from each genotype mouse were cultured for 7 days under conditions that promote the differentiation of fibrocytes. After a medium change, ropeg-IFN-α or PBS was added, followed by a further 5 days of culture. The number of spindle-shaped cells was counted using a phase-contrast microscope. Each culture was performed in triplicate, and 3 independent experiments were performed. Data are presented as mean ± SE. IC50 was measured using a 4-parameter log-logistic model. n.s., not significant.
Effect of IFN-α on hematopoietic progenitors and fibrocytes in Jak2V617F and Jak2V617F;Tyk2−/− mice. (A) Number of hematopoietic progenitors, assessed by colony-forming assay. (Left) CFU-GM. (Right) CFU-Mk. BM cells (2 × 10⁴ per well) from WT, Tyk2−/−, Jak2V617F, and Jak2V617F;Tyk2−/− mice were plated in methylcellulose containing erythropoietin, interleukin-3 (IL-3), stem cell factor, and IL-6 for CFU-GM, and containing thrombopoietin, IL-3, IL-6, and IL-11 for CFU-Mk in the presence or absence of ropeg-IFN-α (0.1 and 0.5 μg/mL). The numbers of CFU-GMs and CFU-Mks were quantified after 7 days of culture. Each experiment was performed in duplicate, and 3 independent experiments were performed. Data are presented as mean ± standard error (SE) of 3 experiments. P values were calculated by the Tukey test after 1-way ANOVA; ∗P < .05; ∗∗P < .01. (B) Number of fibrocytes. BM cells (2 × 10⁵ per well) from each genotype mouse were cultured for 7 days under conditions that promote the differentiation of fibrocytes. After a medium change, ropeg-IFN-α or PBS was added, followed by a further 5 days of culture. The number of spindle-shaped cells was counted using a phase-contrast microscope. Each culture was performed in triplicate, and 3 independent experiments were performed. Data are presented as mean ± SE. IC50 was measured using a 4-parameter log-logistic model. n.s., not significant.
BM fibrosis in Jak2V617F mice is attributable to an increased number of neoplastic fibrocytes that differentiated from monocytes bearing Jak2V617F.30 When BM cells were cultured in vitro for 7 days, spindle-shaped adherent fibrocytes were observed. The number of fibrocytes differentiated from 2 × 10⁵ BM cells from Jak2V617F mice was approximately twice that of those differentiated from the same number of BM cells from WT mice (Figure 3B). Ropeg-IFN-α abrogated the in vitro growth of WT and neoplastic fibrocytes from WT and Jak2V617F mice, respectively, in a dose-dependent manner, with an IC50 of 0.05 μg/mL and 0.02 μg/mL, respectively. Fibrocytes from Tyk2−/− and Jak2V617F;Tyk2−/− mice were resistant to ropeg-IFN-α, with IC50 of 0.46 and 0.55 μg/mL, respectively.
TYK2 is essential for IFN-α effects on Jak2V617F HSCs
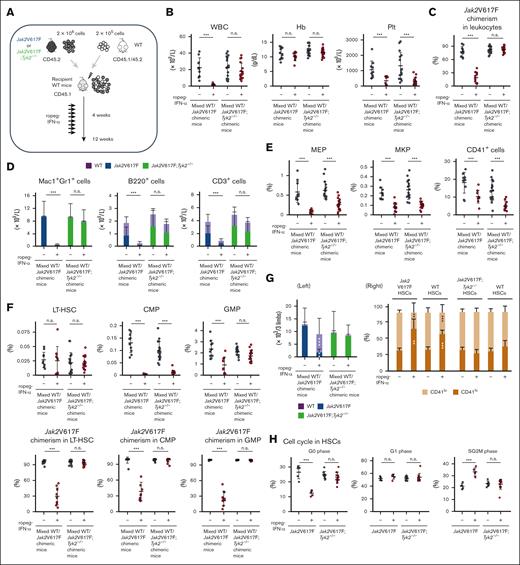
To characterize the effect of IFN-α on Jak2V617F HSCs in detail, we generated mixed WT/Jak2V617F chimeric mice (competitive transplantation, donor; Jak2V617F BM cells with competitor WT BM cells, recipient; WT mice) or mixed WT/Jak2V617F;Tyk2−/− chimeric mice (competitive transplantation, donor; Jak2V617F;Tyk2−/− BM cells with competitor WT BM cells, recipient; WT mice; Figure 4A). Four weeks after transplantation, recipient mice were treated with PBS or ropeg-IFN-α for 8 weeks. Mixed WT/Jak2V617F chimeric mice treated with PBS exhibited leukocytosis, and the median Jak2V617F chimerism in the PB leukocytes was ∼80% (Figure 4B-C). Most Mac1+Gr1+ leukocytes were composed of Jak2V617F cells, whereas B and T cells consisted of WT and Jak2V617F cells in an ∼1:1 ratio (Figure 4D). An 8-week ropeg-IFN-α treatment resulted in a reduced number of PB leukocytes and platelets (Figure 4B). In the BM, the proportions of progenitors decreased after IFN-α treatment (Figure 4E-F). Jak2V617F chimerism in BM LT-HSCs, BM progenitors, and PB leukocytes from mixed WT/Jak2V617F chimeric mice was decreased by IFN-α treatment (Figure 4C,F; supplemental Figure 5). In mixed WT/Jak2V617F chimeric mice, IFN-α treatment reduced the proportions of Jak2V617F HSCs and progenitors, whereas it restored the diminished proportions of WT HSCs and GMPs but not those of WT common myeloid progenitors (CMPs; IL-7Rα−Lin−c-Kit+Sca-1−FcγRloCD34+) (supplemental Figure 6). Consequently, the proportions of LT-HSCs and short-term HSCs, comprising both Jak2V617F and WT cells, were consistent after IFN-α treatment, despite some individual variations. However, the proportions of CMPs remarkably decreased (Figure 4F; supplemental Figure 7). After 8 weeks of IFN-α treatment, LT-HSCs were almost entirely composed of WT LT-HSCs (Figure 4G left). IFN-α also affected the status of Jak2V617F LT-HSCs. IFN-α treatment shifted Jak2V617F LT-HSCs to CD41hi megakaryocyte-skewed HSCs and induced cell cycle progression in Jak2V617F LT-HSCs, decreasing the proportion of cells in the G0 phase and increasing the number of cells in the SG2M phase (Figure 4G right-H). Similar results were observed for Jak2V617F spleen cells (supplemental Figure 8). These observations indicated that Jak2V617F HSCs are more susceptible to IFN-α than WT cells.
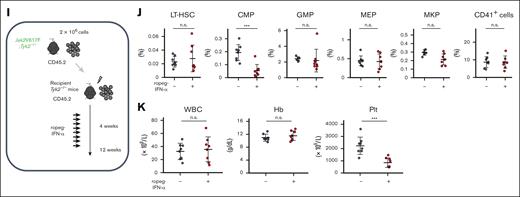
The effect of IFN-α on Jak2V617F;Tyk2−/− progenitors and HSCs in a chimeric BM transplant model. (A) Schematic representation of the generation of mixed WT/Jak2V617F chimeric mice (competitive transplantation, donor; 2 × 10⁶Jak2V617F BM cells with competitor 2 × 10⁵ WT BM cells, recipient; WT mice) or mixed WT/Jak2V617F;Tyk2−/− chimeric mice (competitive transplantation, donor; 2 × 10⁶Jak2V617F;Tyk2−/− BM cells with competitor 2 × 10⁵ WT BM cells, recipient; WT mice). After 4 weeks, recipient mice were treated with PBS or 600 ng of ropeg-IFN-α for 8 weeks. PBS-treated mixed WT/Jak2V617F chimeric mice (n = 10), ropeg-IFN-α–treated mixed WT/Jak2V617F chimeric mice (n = 10), PBS-treated mixed WT/Jak2V617F;Tyk2−/− chimeric mice (n = 17), and ropeg-IFN-α–treated mixed WT/Jak2V617F;Tyk2−/− chimeric mice (n = 17); shown in panels B-G, respectively. (B) Complete blood cell count after 8 weeks of PBS or ropeg-IFN-α treatment in mixed WT/Jak2V617F chimeric mice and mixed WT/Jak2V617F;Tyk2−/− chimeric mice. The absence of inhibitory effects of IFN-α on leukocyte count and Jak2V617F chimerism in leukocytes in mixed WT/Jak2V617F;Tyk2−/− chimeric mice. (C) The change in Jak2V617F chimerism in PB leukocytes. The decrement of Jak2V617F chimerism in PB leukocytes from mixed WT/Jak2V617F chimeric mice after ropeg-IFN-α treatment was absent in mixed WT/Jak2V617F;Tyk2−/− chimeric mice. (D) The change in hematopoietic compartments of the PB after 8 weeks of PBS or ropeg-IFN-α treatment. Purple bar, WT cells; blue bar, Jak2V617F cells; green bar, Jak2V617F;Tyk2−/− cells. (E) The proportion of MKPs after treatment with ropeg-IFN-α in the BM from mixed WT/Jak2V617F chimeric mice and mixed WT/Jak2V617F;Tyk2−/− chimeric mice. At 48 hours after the last treatment, the proportion of MEPs, MKPs, and CD41+ cells in the BM was analyzed. Data are presented as mean ± SD. (F) Upper: the proportion of LT-HSCs and other progenitors after treatment with ropeg-IFN-α in the BM from mixed WT/Jak2V617F chimeric mice and mixed WT/Jak2V617F;Tyk2−/− chimeric mice. At 48 hours after the last treatment, the proportions of LT-HSCs, CMPs, and GMPs in the BM were analyzed. Data are presented as mean ± SD. Lower: the change in Jak2V617F chimerism in LT-HSCs and progenitors after 8 weeks of PBS or ropeg-IFN-α treatment. The decrement of Jak2V617F chimerism in LT-HSCs, CMPs, and GMPs from mixed WT/Jak2V617F chimeric mice after ropeg-IFN-α treatment was absent in mixed WT/Jak2V617F;Tyk2−/− chimeric mice. (G) Analysis of the number of Jak2V617F HSCs and their subpopulations after 8 weeks of treatment with ropeg-IFN-α. Left: the total number of LT-HSCs in 2 femurs and 1 tibia from mixed WT/Jak2V617F chimeric mice and mixed WT/Jak2V617F;Tyk2−/− chimeric mice. Purple bar, WT LT-HSCs; blue bar, Jak2V617F LT-HSCs; green bar, Jak2V617F;Tyk2−/− LT-HSCs. Right: percentage of CD41hi and CD41lo LT-HSCs. Orange bar, CD41lo LT-HSCs; dark orange bar, CD41hi LT-HSCs. (H) Effects of IFN-α treatment on HSC cell cycles in Jak2V617F and Jak2V617F;Tyk2−/− mice. BM cells from 2 mice of each type were mixed, and cell cycle analysis was performed. The sample size for each treatment group: PBS-treated mixed WT/Jak2V617F chimeric mice (n = 5), ropeg-IFN-α–treated mixed WT/Jak2V617F chimeric mice (n = 5), PBS-treated mixed WT/Jak2V617F;Tyk2−/− chimeric mice (n = 8), and ropeg-IFN-α–treated mixed WT/Jak2V617F;Tyk2−/− chimeric mice (n = 8). Left: G0 phase (Ki67lowH333422n). Middle: G1 phase (Ki67+H333422n). Right: SG2M phase (Ki67+H333424n). Reduction in quiescent (Ki67lowH333422n) Jak2V617F HSCs but not in Jak2V617F;Tyk2−/− HSCs after IFN-α treatment. Increase in actively cycling HSCs (Ki67+H333424n) in Jak2V617F HSCs but not in Jak2V617F;Tyk2−/− HSCs after IFN-α treatment. Data are presented as mean ± SD. Statistical significance was determined by the Tukey test after 1-way ANOVA; ∗P < .05; ∗∗P < .01; ∗∗∗P < .001. (I) Schematic representation of generation of Tyk2−/−/Jak2V617F;Tyk2−/− chimeric mice (noncompetitive transplantation, donor; 2 × 10⁶Jak2V617F;Tyk2−/− BM cells, recipient; Tyk2−/− mice). After 4 weeks, recipient mice were treated with PBS or 600 ng of ropeg-IFN-α for 8 weeks. PBS-treated Tyk2−/−/Jak2V617F;Tyk2−/− chimeric mice (n = 8) and ropeg-IFN-α–treated Tyk2−/−/Jak2V617F;Tyk2−/− chimeric mice (n = 8; panels J and K, respectively). (J) The proportion of HSCs and progenitors in BM from Tyk2−/−/Jak2V617F;Tyk2−/− chimeric mice after treatment with ropeg-IFN-α. At 48 hours after the last treatment, the proportion of LT-HSCs, CMPs, GMPs, MEPs, MKPs, and CD41+ cells in the BM was analyzed. Data are presented as mean ± SD. The absence of inhibitory effects of IFN-α on the proportion of MKPs from Tyk2−/−/Jak2V617F;Tyk2−/− chimeric mice. (K) PB complete cell count in leukocytes after 8 weeks of PBS or ropeg-IFN-α treatment in Tyk2−/−/Jak2V617F;Tyk2−/− chimeric mice. The absence of inhibitory effects of IFN-α on leukocyte count but not on platelet count in Tyk2−/−/Jak2V617F;Tyk2−/− chimeric mice. WBC, white blood cell; Hb, hemoglobin; Plt, platelet; n.s., not significant.
The effect of IFN-α on Jak2V617F;Tyk2−/− progenitors and HSCs in a chimeric BM transplant model. (A) Schematic representation of the generation of mixed WT/Jak2V617F chimeric mice (competitive transplantation, donor; 2 × 10⁶Jak2V617F BM cells with competitor 2 × 10⁵ WT BM cells, recipient; WT mice) or mixed WT/Jak2V617F;Tyk2−/− chimeric mice (competitive transplantation, donor; 2 × 10⁶Jak2V617F;Tyk2−/− BM cells with competitor 2 × 10⁵ WT BM cells, recipient; WT mice). After 4 weeks, recipient mice were treated with PBS or 600 ng of ropeg-IFN-α for 8 weeks. PBS-treated mixed WT/Jak2V617F chimeric mice (n = 10), ropeg-IFN-α–treated mixed WT/Jak2V617F chimeric mice (n = 10), PBS-treated mixed WT/Jak2V617F;Tyk2−/− chimeric mice (n = 17), and ropeg-IFN-α–treated mixed WT/Jak2V617F;Tyk2−/− chimeric mice (n = 17); shown in panels B-G, respectively. (B) Complete blood cell count after 8 weeks of PBS or ropeg-IFN-α treatment in mixed WT/Jak2V617F chimeric mice and mixed WT/Jak2V617F;Tyk2−/− chimeric mice. The absence of inhibitory effects of IFN-α on leukocyte count and Jak2V617F chimerism in leukocytes in mixed WT/Jak2V617F;Tyk2−/− chimeric mice. (C) The change in Jak2V617F chimerism in PB leukocytes. The decrement of Jak2V617F chimerism in PB leukocytes from mixed WT/Jak2V617F chimeric mice after ropeg-IFN-α treatment was absent in mixed WT/Jak2V617F;Tyk2−/− chimeric mice. (D) The change in hematopoietic compartments of the PB after 8 weeks of PBS or ropeg-IFN-α treatment. Purple bar, WT cells; blue bar, Jak2V617F cells; green bar, Jak2V617F;Tyk2−/− cells. (E) The proportion of MKPs after treatment with ropeg-IFN-α in the BM from mixed WT/Jak2V617F chimeric mice and mixed WT/Jak2V617F;Tyk2−/− chimeric mice. At 48 hours after the last treatment, the proportion of MEPs, MKPs, and CD41+ cells in the BM was analyzed. Data are presented as mean ± SD. (F) Upper: the proportion of LT-HSCs and other progenitors after treatment with ropeg-IFN-α in the BM from mixed WT/Jak2V617F chimeric mice and mixed WT/Jak2V617F;Tyk2−/− chimeric mice. At 48 hours after the last treatment, the proportions of LT-HSCs, CMPs, and GMPs in the BM were analyzed. Data are presented as mean ± SD. Lower: the change in Jak2V617F chimerism in LT-HSCs and progenitors after 8 weeks of PBS or ropeg-IFN-α treatment. The decrement of Jak2V617F chimerism in LT-HSCs, CMPs, and GMPs from mixed WT/Jak2V617F chimeric mice after ropeg-IFN-α treatment was absent in mixed WT/Jak2V617F;Tyk2−/− chimeric mice. (G) Analysis of the number of Jak2V617F HSCs and their subpopulations after 8 weeks of treatment with ropeg-IFN-α. Left: the total number of LT-HSCs in 2 femurs and 1 tibia from mixed WT/Jak2V617F chimeric mice and mixed WT/Jak2V617F;Tyk2−/− chimeric mice. Purple bar, WT LT-HSCs; blue bar, Jak2V617F LT-HSCs; green bar, Jak2V617F;Tyk2−/− LT-HSCs. Right: percentage of CD41hi and CD41lo LT-HSCs. Orange bar, CD41lo LT-HSCs; dark orange bar, CD41hi LT-HSCs. (H) Effects of IFN-α treatment on HSC cell cycles in Jak2V617F and Jak2V617F;Tyk2−/− mice. BM cells from 2 mice of each type were mixed, and cell cycle analysis was performed. The sample size for each treatment group: PBS-treated mixed WT/Jak2V617F chimeric mice (n = 5), ropeg-IFN-α–treated mixed WT/Jak2V617F chimeric mice (n = 5), PBS-treated mixed WT/Jak2V617F;Tyk2−/− chimeric mice (n = 8), and ropeg-IFN-α–treated mixed WT/Jak2V617F;Tyk2−/− chimeric mice (n = 8). Left: G0 phase (Ki67lowH333422n). Middle: G1 phase (Ki67+H333422n). Right: SG2M phase (Ki67+H333424n). Reduction in quiescent (Ki67lowH333422n) Jak2V617F HSCs but not in Jak2V617F;Tyk2−/− HSCs after IFN-α treatment. Increase in actively cycling HSCs (Ki67+H333424n) in Jak2V617F HSCs but not in Jak2V617F;Tyk2−/− HSCs after IFN-α treatment. Data are presented as mean ± SD. Statistical significance was determined by the Tukey test after 1-way ANOVA; ∗P < .05; ∗∗P < .01; ∗∗∗P < .001. (I) Schematic representation of generation of Tyk2−/−/Jak2V617F;Tyk2−/− chimeric mice (noncompetitive transplantation, donor; 2 × 10⁶Jak2V617F;Tyk2−/− BM cells, recipient; Tyk2−/− mice). After 4 weeks, recipient mice were treated with PBS or 600 ng of ropeg-IFN-α for 8 weeks. PBS-treated Tyk2−/−/Jak2V617F;Tyk2−/− chimeric mice (n = 8) and ropeg-IFN-α–treated Tyk2−/−/Jak2V617F;Tyk2−/− chimeric mice (n = 8; panels J and K, respectively). (J) The proportion of HSCs and progenitors in BM from Tyk2−/−/Jak2V617F;Tyk2−/− chimeric mice after treatment with ropeg-IFN-α. At 48 hours after the last treatment, the proportion of LT-HSCs, CMPs, GMPs, MEPs, MKPs, and CD41+ cells in the BM was analyzed. Data are presented as mean ± SD. The absence of inhibitory effects of IFN-α on the proportion of MKPs from Tyk2−/−/Jak2V617F;Tyk2−/− chimeric mice. (K) PB complete cell count in leukocytes after 8 weeks of PBS or ropeg-IFN-α treatment in Tyk2−/−/Jak2V617F;Tyk2−/− chimeric mice. The absence of inhibitory effects of IFN-α on leukocyte count but not on platelet count in Tyk2−/−/Jak2V617F;Tyk2−/− chimeric mice. WBC, white blood cell; Hb, hemoglobin; Plt, platelet; n.s., not significant.
These IFN-α effects in vivo were completely diminished except for the effect on platelets in mixed WT/Jak2V617F;Tyk2−/− chimeric mice. The PB leukocyte count, and Jak2V617F chimerism in PB leukocytes and BM LT-HSCs were not decreased by IFN-α treatment in mixed WT/Jak2V617F;Tyk2−/− chimeric mice (Figure 4B-C,F). The total number of LT-HSCs in 2 femurs and 1 tibia from mixed WT/Jak2V617F;Tyk2−/− chimeric mice did not change after 8 weeks of IFN-α treatment (Figure 4G). After IFN-α treatment, LT-HSCs in mixed WT/Jak2V617F;Tyk2−/− chimeric mice were still composed of mainly Jak2V617F cells, and megakaryocyte skewing and increased cell cycle entry were not observed (Figure 4F-H). These observations showed that TYK2 was essential for the effect of IFN-α on Jak2V617F HSCs. In addition, IFN-α was thought to act directly on Jak2V617F HSCs and progenitors and exhibit its effect because the effect of IFN-α on Jak2V617F progenitors and HSCs was absent in mixed WT/Jak2V617F;Tyk2−/− chimeric mice, in which WT lymphocytes were present (Figure 4D). Most of the IFN-α effects were abrogated in mixed WT/Jak2V617F;Tyk2−/− cells; however, the PB platelet count was decreased by IFN-α treatment in mixed WT/Jak2V617F;Tyk2−/− chimeric mice, similar to that in mixed WT/Jak2V617F chimeric mice (Figure 4B). The proportions of megakaryocyte lineage progenitors, MEPs, MKPs, and CD41+ cells in the BM, including Jak2V617F;Tyk2−/− and WT cells, as well as the proportion of Jak2V617F;Tyk2−/− CMPs, were also decreased by IFN-α treatment in mixed WT/Jak2V617F;Tyk2−/− chimeric mice (Figure 4E; supplemental Figure 6). Given that WT lymphocytes accounted for ∼40% of lymphocytes in the PB from mixed WT/Jak2V617F;Tyk2−/− chimeric mice (Figure 4D), we generated Tyk2−/−/Jak2V617F;Tyk2−/− chimeric mice (noncompetitive transplantation, donor; Jak2V617F;Tyk2−/− BM cells, recipient; Tyk2−/− mice) to eliminate the influence of WT lymphocytes (Figure 4I). As shown in Figure 4J, the proportion of MKPs did not decrease after ropeg-IFN-α treatment in Tyk2−/−/Jak2V617F;Tyk2−/− chimeric mice, consistent with Jak2V617F transgenic mice (Figure 1C) but contrary to the mixed WT/Jak2V617F;Tyk2−/− chimeric mice (Figure 4E). A reduction in PB platelet count and the proportion of Jak2V617F;Tyk2−/− CMPs after ropeg-IFN-α treatment was still observed in the Tyk2−/−/Jak2V617F;Tyk2−/− chimeric mice, similar to the mixed WT/Jak2V617F;Tyk2−/− chimeric mice (Figure 4B,F,J-K).
The different effect of IFN-α on Jak2V617F progenitors and HSCs
Mutant IFN-α2, which binds tightly to INF-α/β receptor 2 but has reduced binding to INF-α/β receptor 1, retains antiviral activity but loses its antiproliferative activity. Levin et al identified a gene set related to IFN-α–induced antiproliferative activity by comparing genes induced by IFN-α with those induced by mutant IFN-α2 in several cell lines.31
We performed gene set enrichment analysis using this gene set, along with a gene set regulating the cell cycle to analyze the mechanism of action of interferon in HSCs and progenitors.
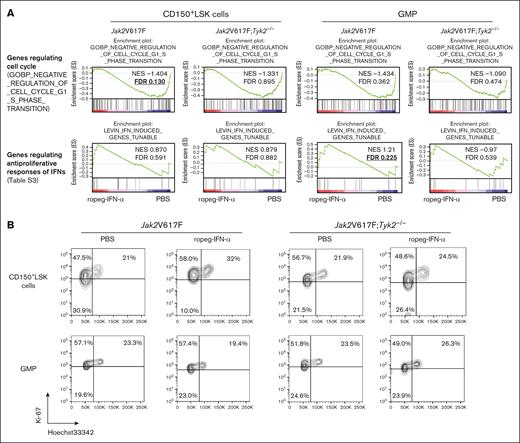
Because GMPs account for 76% and 79% of the progenitors (CMPs, GMPs, and MEPs) present in the BM of Jak2V617F and Jak2V617F;Tyk2−/− mice, respectively, we adopted GMPs as representative of the progenitors. Gene set enrichment analysis showed that the gene set associated with negative regulation of the cell cycle (negative regulation of cell cycle G1 S phase transition) was negatively enriched in Jak2V617F CD150+LSK cells but not in Jak2V617F GMPs after IFN-α treatment (Figure 5A). In contrast, the gene set associated with IFN-α–induced antiproliferative activity (supplemental Table 3) was enriched in Jak2V617F GMPs but not in Jak2V617F CD150+LSK cells after IFN-α treatment. These IFN-α effects were not observed in the absence of TYK2.
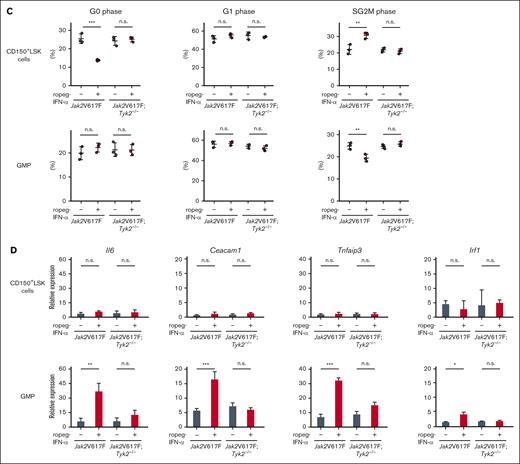
Effect of IFN-α on the gene expressions of stem/progenitor cells in Jak2V617F and Jak2V617F;Tyk2−/− mice. (A) Gene set enrichment analysis (GSEA) of genes regulating cell cycle (negative regulation of cell cycle G1 S phase transition) and genes regulating antiproliferative responses of IFNs. Upper: negative enrichment of genes for negative regulation of cell cycle G1 S phase transition in Jak2V617F CD150+LSK cells after IFN-α treatment but not in Jak2V617F GMPs. The gene expression data in CD150+LSK cells and GMPs in each genotype mice were obtained from 4 weeks of PBS- or ropeg-IFN-α–treated Jak2V617F and Jak2V617F;Tyk2−/− mice. Jak2V617F treated with PBS (n = 3), Jak2V617F treated with ropeg-IFN-α (n = 4), Jak2V617F;Tyk2−/−treated with PBS (n = 4), and Jak2V617F;Tyk2−/− treated with ropeg-IFN-α (n = 5). Lower: enrichment of genes regulating antiproliferative responses of IFNs in Jak2V617F GMPs but not in Jak2V617F CD150+LSK cells. Genes regulating the antiproliferative responses of IFNs are listed in supplemental Table 3. GSEA was performed using a false discovery rate (FDR) cutoff of ≤0.25. Enrichment plots for each gene set are shown with NESs and FDRs. (B) Representative flow cytometry plots showing the cell cycle in CD150+LSK cells and GMPs after 2 weeks of PBS or ropeg-IFN-α treatment in Jak2V617F and Jak2V617F;Tyk2−/− mice. G0 (quiescent) cells were Ki-67lowH33342,2n G1 cells were Ki-67+ H33342,2n and SG2M cells were Ki67+H333424 n. (C) Effect of IFN-α treatment on cell cycle of CD150+LSK cells and GMPs in Jak2V617F and Jak2V617F;Tyk2−/− mice. Upper: reduction in quiescent CD150+LSK cells (Ki-67lowH333422n) and increase in actively cycling CD150+LSK cells (Ki67lowH333422n) after IFN-α treatment in Jak2V617F mice. These IFN-α effects on CD150+LSK cells were absent in Jak2V617F;Tyk2−/− mice. Lower: reduction in actively cycling GMPs (Ki67+H333424n) after IFN-α treatment in Jak2V617F mice but not in Jak2V617F;Tyk2−/− mice. BM cells from 3 mice of each type were mixed, and cell cycle analysis was performed. The sample size for each treatment group was 3. Results are shown as mean ± SD of 3 samples. (D) Normalized expression levels of selected genes that regulate the antiproliferative responses to IFN-α. CD150+LSK cells and GMPs were isolated from the BM of Jak2V617F and Jak2V617F;Tyk2−/− mice treated with 600 ng of ropeg-IFN-α for 4 weeks. After normalization to the expression levels of Gapdh, the expression levels of each gene in each mouse genotype are shown as relative ratios to those in WT mice. Results are shown as mean ± SD of 3 samples. Statistical significance was determined using the Tukey test after 1-way ANOVA; ∗P < .05; ∗∗P < .01; ∗∗∗P < .001. NES, normalized enrichment scores; n.s., not significant.
Effect of IFN-α on the gene expressions of stem/progenitor cells in Jak2V617F and Jak2V617F;Tyk2−/− mice. (A) Gene set enrichment analysis (GSEA) of genes regulating cell cycle (negative regulation of cell cycle G1 S phase transition) and genes regulating antiproliferative responses of IFNs. Upper: negative enrichment of genes for negative regulation of cell cycle G1 S phase transition in Jak2V617F CD150+LSK cells after IFN-α treatment but not in Jak2V617F GMPs. The gene expression data in CD150+LSK cells and GMPs in each genotype mice were obtained from 4 weeks of PBS- or ropeg-IFN-α–treated Jak2V617F and Jak2V617F;Tyk2−/− mice. Jak2V617F treated with PBS (n = 3), Jak2V617F treated with ropeg-IFN-α (n = 4), Jak2V617F;Tyk2−/−treated with PBS (n = 4), and Jak2V617F;Tyk2−/− treated with ropeg-IFN-α (n = 5). Lower: enrichment of genes regulating antiproliferative responses of IFNs in Jak2V617F GMPs but not in Jak2V617F CD150+LSK cells. Genes regulating the antiproliferative responses of IFNs are listed in supplemental Table 3. GSEA was performed using a false discovery rate (FDR) cutoff of ≤0.25. Enrichment plots for each gene set are shown with NESs and FDRs. (B) Representative flow cytometry plots showing the cell cycle in CD150+LSK cells and GMPs after 2 weeks of PBS or ropeg-IFN-α treatment in Jak2V617F and Jak2V617F;Tyk2−/− mice. G0 (quiescent) cells were Ki-67lowH33342,2n G1 cells were Ki-67+ H33342,2n and SG2M cells were Ki67+H333424 n. (C) Effect of IFN-α treatment on cell cycle of CD150+LSK cells and GMPs in Jak2V617F and Jak2V617F;Tyk2−/− mice. Upper: reduction in quiescent CD150+LSK cells (Ki-67lowH333422n) and increase in actively cycling CD150+LSK cells (Ki67lowH333422n) after IFN-α treatment in Jak2V617F mice. These IFN-α effects on CD150+LSK cells were absent in Jak2V617F;Tyk2−/− mice. Lower: reduction in actively cycling GMPs (Ki67+H333424n) after IFN-α treatment in Jak2V617F mice but not in Jak2V617F;Tyk2−/− mice. BM cells from 3 mice of each type were mixed, and cell cycle analysis was performed. The sample size for each treatment group was 3. Results are shown as mean ± SD of 3 samples. (D) Normalized expression levels of selected genes that regulate the antiproliferative responses to IFN-α. CD150+LSK cells and GMPs were isolated from the BM of Jak2V617F and Jak2V617F;Tyk2−/− mice treated with 600 ng of ropeg-IFN-α for 4 weeks. After normalization to the expression levels of Gapdh, the expression levels of each gene in each mouse genotype are shown as relative ratios to those in WT mice. Results are shown as mean ± SD of 3 samples. Statistical significance was determined using the Tukey test after 1-way ANOVA; ∗P < .05; ∗∗P < .01; ∗∗∗P < .001. NES, normalized enrichment scores; n.s., not significant.
IFN-α treatment activated the cell cycle and increased the population of Jak2V617F CD150+LSK cells in the SG2M phase (Figure 5B-C). In contrast, the proportion of GMPs in the SG2M phase was decreased by IFN-α treatment in Jak2V617F mice, which is consistent with the results of the gene expression analysis. Again, the activation of cell cycle entry by IFN-α was not observed in CD150+LSK cells from Jak2V617F;Tyk2−/− mice. Similar results as in GMPs were observed in LK cells (supplemental Figure 9). The gene set regulating IFN-α–induced antiproliferative activity included Il-6, Ceacam1, Tnfaip3, and Irf1. The real-time polymerase chain reaction analysis showed that the expression of Il-6, Ceacam1, Tnfaip3, and Irf1 was induced in Jak2V617F GMPs but not in Jak2V617F CD150+LSK cells after 4 weeks of ropeg-IFN-α treatment (Figure 5D). The expression of Il-6, Ceacam1, Tnfaip3, and Irf1 was not induced by ropeg-IFN-α treatment in Jak2V617F;Tyk2−/− GMPs, indicating an essential role of TYK2 in the induction of IFN-α antiproliferative genes. Similar results as in GMPs were observed in LKs (supplemental Figure 9).
STAT1 is not indispensable for the antiproliferative activity of IFN-α on Jak2V617F cells
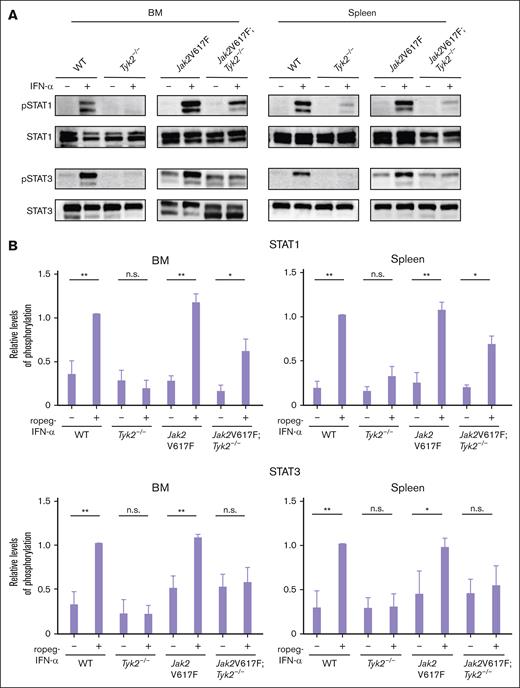
The major IFN-α signaling molecule activated by JAKs are STATs. The IFN-α–induced strong phosphorylation of STAT1, observed in Jak2V617F mice, was reduced in BM and spleen cells of Jak2V617F;Tyk2−/− mice but still present (Figure 6A-B). In contrast, the activation of STAT3 by IFN-α was absent in cells from Jak2V617F;Tyk2−/− mice.
Intracellular signaling by IFN-α in cells from Jak2V617F and Jak2V617F;Tyk2−/− mice. (A) Phosphorylation of STAT1 and STAT3 in response to IFN-α stimulation in BM (left) and spleen (right) cells from WT, Tyk2−/−, Jak2V617F, and Jak2V617F;Tyk2−/− mice. Cells from each genotype were treated with murine IFN-α (1000 U/mL) for 15 minutes and lysed. Western blotting was performed with the indicated antibodies. Three independent experiments were performed, and the representative result was shown here. (B) The expression level of phosphoprotein in each type of mice is shown as the relative ratio to that in the total amount of each STAT (n = 3 for each genotype group). A bar graph depicts the results from 3 replicate experiments. P values were calculated using the Tukey test after 1-way ANOVA; ∗P < .05; ∗∗P < .01. n.s., not significant; pSTAT, phospho-signal transducers and activators of transcription.
Intracellular signaling by IFN-α in cells from Jak2V617F and Jak2V617F;Tyk2−/− mice. (A) Phosphorylation of STAT1 and STAT3 in response to IFN-α stimulation in BM (left) and spleen (right) cells from WT, Tyk2−/−, Jak2V617F, and Jak2V617F;Tyk2−/− mice. Cells from each genotype were treated with murine IFN-α (1000 U/mL) for 15 minutes and lysed. Western blotting was performed with the indicated antibodies. Three independent experiments were performed, and the representative result was shown here. (B) The expression level of phosphoprotein in each type of mice is shown as the relative ratio to that in the total amount of each STAT (n = 3 for each genotype group). A bar graph depicts the results from 3 replicate experiments. P values were calculated using the Tukey test after 1-way ANOVA; ∗P < .05; ∗∗P < .01. n.s., not significant; pSTAT, phospho-signal transducers and activators of transcription.
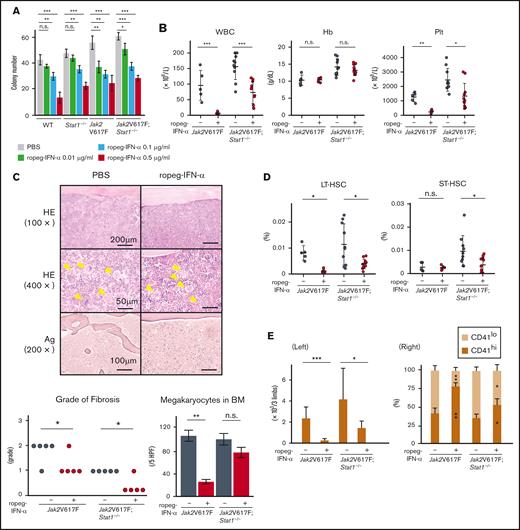
Because Stat1-deficient mice fail to exhibit antiviral activity induced by IFN-α24 and the activation of STAT1 by IFN-α was drastically decreased in the absence of TYK2, we analyzed whether STAT1 was involved in IFN-α–induced antiproliferative activity. Colony numbers of CFU-GM generated from Stat1−/− BM cells and Jak2V617F;Stat1−/− BM cells were decreased to approximately half in the presence of 0.5 μg/mL ropeg-IFN-α, as were in Jak2V617F BM cells (Figure 7A). We extended this analysis to investigate the in vivo effects of IFN-α in Jak2V617F;Stat1−/− mice. Eight weeks of ropeg-IFN-α treatment was associated with a reduction in leukocyte and platelet count in Jak2V617F;Stat1−/− mice (Figure 7B). The numbers of PB myeloid cells, B cells, and T cells were reduced in Jak2V617F;Stat1−/− mice after ropeg-IFNα treatment (supplemental Figure 10). BM fibrosis disappeared in 4 of 5 Jak2V617F;Stat1−/− mice after an 8-week course of ropeg-IFN-α treatment (Figure 7C). The destroyed splenic architecture was restored, and fibrosis was resolved by ropeg-IFN-α treatment in Jak2V617F;Stat1−/− mice (supplemental Figure 11). In the BM and spleen of Jak2V617F;Stat1−/− mice, ropeg-IFNα treatment decreased the proportions of LT-HSCs and short-term HSCs (Figure 7D; supplemental Figure 12). The total number of LT-HSCs in 2 femurs and 1 tibia and in the spleen decreased by approximately one-fourth and one-third, respectively, after IFN-α treatment, consistent with the effect of IFN-α in Jak2V617F mice (Figures 1E and 7E; supplemental Figure 13). The effect of IFN-α on the shift of LT-HSCs toward CD41hi proportion was observed in Jak2V617F;Stat1−/− mice. These observations indicate that STAT1 is not indispensable for the effect of IFN-α on Jak2V617F cells. However, these IFN-α effects in Jak2V617F;Stat1−/− mice were more moderate for the reduction in number of PB leukocytes, thrombocytes, and BM LT-HSCs, and the shift of LT-HSCs to CD41hi proportions than those in Jak2V617F mice (Figures 1A,E, and 7B,E). In addition, IFN-α effect on LT-HSCs entering cell cycle was not observed in Jak2V617F;Stat1−/− mice (supplemental Figure 14). IFN-α treatment had little effect on the number of megakaryocytes and the proportion of progenitors, including CMPs, GMPs, MEPs, and MKPs, in the BM of Jak2V617F;Stat1−/− mice (Figure 7C; supplemental Figure 15).
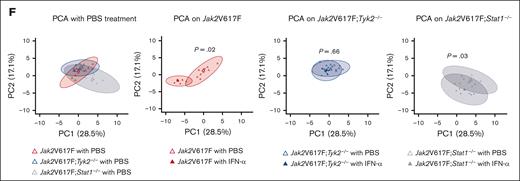
Effects of IFN-α in Jak2V617F;Stat1−/− mice. (A) The number of CFU-GM from WT, Stat1−/−, Jak2V617F, and Jak2V617F;Stat1−/− mice in the presence of ropeg-IFN-α (0.01, 0.1, or 0.5 μg/mL). BM cells (2 × 10⁴ per well) from each genotype were plated in methylcellulose containing erythropoietin, IL-3, stem cell factor, and IL-6. The numbers of CFU-GM were quantified after 7 days of culture. Each experiment was performed in duplicate, and 3 independent experiments were performed. Data are presented as mean ± SE of 3 experiments. P values were calculated by the Tukey test after 1-way ANOVA; ∗P < .05; ∗∗P < .01; ∗∗∗P < .001. (B) PB complete cell count after 8 weeks of ropeg-IFN-α treatment in Jak2V617F and Jak2V617F;Stat1−/− mice. Jak2V617F mice (n = 5 per PBS and n = 5 per ropeg-IFN-α treatment); and Jak2V617F;Stat1−/− mice (n = 10 per PBS and n = 11 per ropeg-IFN-α treatment); shown in panels B, D-E, respectively. Data are presented as mean ± SD. P values were calculated by the Tukey test after 1-way ANOVA; ∗P < .05; ∗∗P < .01; ∗∗∗P < .001. (C) Histological changes in the BM from Jak2V617F;Stat1−/− mice after 8 weeks of ropeg-IFN-α treatment. Top: HE staining (100×); middle: HE staining (400×); bottom: Ag staining (200×). A yellow arrowhead indicates a megakaryocyte. Mild BM fibrosis in Jak2V617F;Stat1−/− mice disappeared after 8 weeks of ropeg-IFN-α treatment. Lower, left: the grade of fibrosis according to 4 grades (n = 5 per each treatment group). Statistical significance was determined by Mann-Whitney U test for 2 groups. ∗P < .05. Lower, right: the average number of megakaryocytes in 5 HPFs (n = 5 per each treatment group). Data are presented as mean ± SD. P values were calculated by the Tukey test after 1-way ANOVA. (D) The decrement in the proportion of LT-HSCs and short-term HSCs (ST-HSCs) in the BM from Jak2V617F and Jak2V617F;Stat1−/− mice after 8 weeks of ropeg-IFN-α treatment. Data are presented as mean ± SD. P values were calculated by the Tukey test after 1-way ANOVA; ∗P < .05. (E) Analysis of the number of Jak2V617F and Jak2V617F;Stat1−/− HSCs and their subpopulations after 8 weeks of treatment with ropeg-IFN-α. Left: the total number of LT-HSCs in 2 femurs and 1 tibia from Jak2V617F and Jak2V617F;Stat1−/− mice. Right: percentage of CD41hi and CD41lo LT-HSCs. Orange bar, CD41lo LT-HSCs; dark orange bar, CD41hi LT-HSCs. Data are presented as mean ± SD. P values were calculated by the Tukey test after 1-way ANOVA. ∗P < .05. (F) PCA after 8-week treatment with ropeg-IFN-α, performed on Jak2V617F, Jak2V617F;Tyk2−/−, and Jak2V617F;Stat1−/− mice. PCA was integrated with 35 parameters described in the supplemental Methods. First from the left: PCA after PBS treatment on Jak2V617F, Jak2V617F;Tyk2−/−, and Jak2V617F;Stat1−/− mice; (second from the left) PCA with either PBS or ropeg-IFN-α treatment on Jak2V617F mice; (third from the left) PCA with either PBS or ropeg-IFN-α treatment on Jak2V617F;Tyk2−/− mice; (fourth from the left) PCA with either PBS or ropeg-IFN-α treatment performed on Jak2V617F;Stat1−/− mice. WBC, white blood cell; Hb, hemoglobin; Plt, platelet; n.s., not significant.
Effects of IFN-α in Jak2V617F;Stat1−/− mice. (A) The number of CFU-GM from WT, Stat1−/−, Jak2V617F, and Jak2V617F;Stat1−/− mice in the presence of ropeg-IFN-α (0.01, 0.1, or 0.5 μg/mL). BM cells (2 × 10⁴ per well) from each genotype were plated in methylcellulose containing erythropoietin, IL-3, stem cell factor, and IL-6. The numbers of CFU-GM were quantified after 7 days of culture. Each experiment was performed in duplicate, and 3 independent experiments were performed. Data are presented as mean ± SE of 3 experiments. P values were calculated by the Tukey test after 1-way ANOVA; ∗P < .05; ∗∗P < .01; ∗∗∗P < .001. (B) PB complete cell count after 8 weeks of ropeg-IFN-α treatment in Jak2V617F and Jak2V617F;Stat1−/− mice. Jak2V617F mice (n = 5 per PBS and n = 5 per ropeg-IFN-α treatment); and Jak2V617F;Stat1−/− mice (n = 10 per PBS and n = 11 per ropeg-IFN-α treatment); shown in panels B, D-E, respectively. Data are presented as mean ± SD. P values were calculated by the Tukey test after 1-way ANOVA; ∗P < .05; ∗∗P < .01; ∗∗∗P < .001. (C) Histological changes in the BM from Jak2V617F;Stat1−/− mice after 8 weeks of ropeg-IFN-α treatment. Top: HE staining (100×); middle: HE staining (400×); bottom: Ag staining (200×). A yellow arrowhead indicates a megakaryocyte. Mild BM fibrosis in Jak2V617F;Stat1−/− mice disappeared after 8 weeks of ropeg-IFN-α treatment. Lower, left: the grade of fibrosis according to 4 grades (n = 5 per each treatment group). Statistical significance was determined by Mann-Whitney U test for 2 groups. ∗P < .05. Lower, right: the average number of megakaryocytes in 5 HPFs (n = 5 per each treatment group). Data are presented as mean ± SD. P values were calculated by the Tukey test after 1-way ANOVA. (D) The decrement in the proportion of LT-HSCs and short-term HSCs (ST-HSCs) in the BM from Jak2V617F and Jak2V617F;Stat1−/− mice after 8 weeks of ropeg-IFN-α treatment. Data are presented as mean ± SD. P values were calculated by the Tukey test after 1-way ANOVA; ∗P < .05. (E) Analysis of the number of Jak2V617F and Jak2V617F;Stat1−/− HSCs and their subpopulations after 8 weeks of treatment with ropeg-IFN-α. Left: the total number of LT-HSCs in 2 femurs and 1 tibia from Jak2V617F and Jak2V617F;Stat1−/− mice. Right: percentage of CD41hi and CD41lo LT-HSCs. Orange bar, CD41lo LT-HSCs; dark orange bar, CD41hi LT-HSCs. Data are presented as mean ± SD. P values were calculated by the Tukey test after 1-way ANOVA. ∗P < .05. (F) PCA after 8-week treatment with ropeg-IFN-α, performed on Jak2V617F, Jak2V617F;Tyk2−/−, and Jak2V617F;Stat1−/− mice. PCA was integrated with 35 parameters described in the supplemental Methods. First from the left: PCA after PBS treatment on Jak2V617F, Jak2V617F;Tyk2−/−, and Jak2V617F;Stat1−/− mice; (second from the left) PCA with either PBS or ropeg-IFN-α treatment on Jak2V617F mice; (third from the left) PCA with either PBS or ropeg-IFN-α treatment on Jak2V617F;Tyk2−/− mice; (fourth from the left) PCA with either PBS or ropeg-IFN-α treatment performed on Jak2V617F;Stat1−/− mice. WBC, white blood cell; Hb, hemoglobin; Plt, platelet; n.s., not significant.
Because the absence of STAT1 did not consistently affect the phenotypes of Jak2V617F mice treated with IFN-α, we integrated 35 hematological parameters in Jak2V617F, Jak2V617F;Tyk2−/−, and Jak2V617F;Stat1−/− mice, and performed principal component analysis (PCA) (supplemental Table 4; Figure 7F). The first 2 PCs identified by PCA accounted for approximately half of the variation (PC1, 28.5%; PC2, 17.1%). When PC1 and PC2 were plotted on a 2-dimensional plane, PBS-treated Jak2V617F mice and Jak2V617F;Tyk2−/− mice overlapped (P = .14), whereas Jak2V617F;Stat1−/− mice generated a distinct group from Jak2V617F mice (P = .02) or Jak2V617F;Tyk2−/− mice (P = .02). This indicates that STAT1 deficiency affects the phenotypes induced by Jak2V617F. In comparison with PBS treatment, IFN-α treatment generated a different group in Jak2V617F mice (P = .02) and in Jak2V617F;Stat1−/− mice (P = .03) but not in Jak2V617F;Tyk2−/− mice (P = .66). This suggests that the absence of STAT1 had little effect on the hematological parameters in response to IFN-α treatment in Jak2V617F mice.
Discussion
We demonstrated that TYK2 is indispensable for the amelioration of MPN features in Jak2V617F mice, as well as the decrease in Jak2V617F HSCs and progenitors by IFN-α. The mechanism of IFN-α in Jak2V617F HSCs and progenitors differed: IFN-α entered Jak2V617F HSCs into the cell cycle and induced megakaryocyte differentiation, whereas IFN-α exhibited an antiproliferative effect on Jak2V617F progenitors.
IFN-α has therapeutic efficacy against MPN,12,32-35 and ropeg-IFN-α treatment ameliorates MPN features in Jak2V617F mice. The inhibitory effect of IFN-α on PB leukocytes and BM myeloid and MKPs was dependent on TYK2. In Jak2V617F;Tyk2−/− mice, these IFN-α suppressive effects on hematopoietic cells were not observed. Consistent with this finding, an in vitro colony assay revealed that growth of TYK2-deficient Jak2V617F BM progenitors was not abrogated in the presence of IFN-α. The requirement of TYK2 in the IFN-α signaling cascade might differ with IFN-α function; the essential role of TYK2 in IFN-α induced antiproliferative effects on hematopoietic cells, in contrast to its dispensable role in IFN-α induced antiviral effects.25 Although TYK2 was indispensable for the inhibitory effect of IFN-α on hematological cells including HSCs, the amount in platelets was reduced by IFN-α in mixed WT/Jak2V617F;Tyk2−/− chimeric mice and mixed Tyk2−/−/Jak2V617F;Tyk2−/− chimeric mice but not in Jak2V617F;Tyk2−/− mice. The cause of the difference in the effect of IFN-α on platelet production among the models is unclear at this time.
BM fibrosis in Jak2V617F mice was resolved by 8 weeks of ropeg-IFN-α treatment. We previously reported that fibrocytes differentiated from Jak2V617F monocytes caused BM fibrosis in Jak2V617F mice.30 Because Jak2V617F fibrocytes were sensitive to IFN-α in vitro, the resolution of BM fibrosis in Jak2V617F mice after ropeg-IFN-α treatment could be because of a decrease in the number of neoplastic Jak2V617F fibrocytes. Additionally, TYK2 was required for IFN-α–induced growth suppression of neoplastic fibrocytes in vitro and the resolution of BM fibrosis in Jak2V617F mice.
The mechanism of action of IFN-α targeting Jak2V617F HSCs and Jak2V617F progenitors differed. The gene set associated with negative regulation of the cell cycle was negatively enriched in IFN-α–treated Jak2V617F HSCs, and IFN-α induced a decrease in quiescent HSCs and accumulation of HSCs in the G1 phase and cell cycling (SG2M). In addition, IFN-α induced an increase in CD41hi HSCs, which were skewed to megakaryocyte lineage differentiation and had reduced long term reconstitution potential compared with CD41lo HSCs, consistent with a report by Rao et al.35 In contrast, the gene set regulating antiproliferation was not enriched in IFN-α–treated Jak2V617F HSCs. In IFN-α–treated Jak2V617F progenitors, the gene set regulating the cell cycle was not enriched, the proportion of cells in the SG2M phase decreased, and the gene sets regulating antiproliferation were positively enriched. TYK2 was essential for the effects of IFN-α on Jak2V617F HSCs entering the cell cycle and skewing megakaryocyte differentiation, in addition to its essential role in the antiproliferative effect on Jak2V617F progenitors by IFN-α.
The involvement of T and natural killer cells for the development of antitumor responses by IFN-α has been reported.36-38 Because the antiproliferative effect of IFN-α was absent despite the presence of WT lymphocytes in mixed WT/Jak2V617F;Tyk2−/− chimeric mice, IFN-α was thought to act directly on Jak2V617F HSCs and progenitors. This direct effect of IFN-α on Jak2V617F clones was consistent with the previous report by Mullally et al.32 In contrast, the suppressive effect of IFN-α on MKPs may have been an indirect effect via WT lymphocytes.
Loss of TYK2 resulted in the reduction of IFN-α–induced STAT1 phosphorylation in BM and spleen cells. This differs from our previous observations in Tyk2-deficient embryonic fibroblasts, in which IFN-α–induced STAT1 phosphorylation was not abrogated by the absence of TYK2.25 The requirement for TYK2 differs among cell types. STAT1 is the major transducer of IFN-α signaling, including its antiviral activity 24; however, STAT1 is dispensable for in vitro abrogation of B-cell progenitor growth by IFN-α/β.26,39 In line with this, IFN-α exhibited the suppressive effect on myeloid colony formation in vitro generated from Jak2V617F;Stat1−/− BM cells. Nevertheless, we cannot completely rule out the possibility that the inhibitory effect of IFN-α is sustained by the truncated STAT1 protein detected in Stat1−/− cells used in this experiment, which retains its DNA binding activity after IFN-γ stimulation.24 PCA showed that IFN-α treatment in vivo generated distinct groups in Jak2V617F;Stat1−/− mice compared with PBS treatment. In addition, the promoter regions of genes involved in the antiproliferative activities of IFN-α have been reported to show no enrichment of ISRE (interferon-stimulated response element) sequences, which are the binding sites of the STAT1-STAT2-IRF9 complex.31 Taken together, STAT1 is dispensable for the suppressive effect of IFN-α on hematopoietic cells in Jak2V617F mice. The antiproliferative activity of IFN-α2b was reported to be abrogated by STAT3 depletion using STAT3 small-interfering RNA in WISH cells.40 The absence of STAT3 phosphorylation by IFN-α in Jak2V617F;Tyk2−/− cells may explain the lack of IFN-α suppressive effect in the absence of TYK2.
In summary, IFN-α selectively and directly suppressed Jak2V617F clones and ameliorated MPN features in Jak2V617F mice. TYK2 was essential for this IFN-α effect, but STAT1 is not indispensable. The mechanism of action of IFN-α in Jak2V617F HSCs and Jak2V617F progenitors differs. This is completely different from the IFN-α antiviral effect signaling pathway, in which TYK2 is dispensable but STAT1 is essential.
Acknowledgments
The authors thank M. Matsushita, T. Shinmori, S. Saito, and Y. Kawagoe for their technical assistance.
This work was supported by grants-in-aid for scientific research (grant number 23K07817; K. Shide, 23H02938; K. Shimoda) from the Japan Society for the Promotion of Science, and research funding from PharmaEssentia. This work was also supported by a grant-in-aid for clinical research from the University of Miyazaki Hospital (Y.T.).
Authorship
Contribution: Y.T., K. Shide, T.K., T. Uchida, and A.K. performed the research; K. Shide, T.K., J.B., M.T. and G.S. performed RNA-sequencing analysis; T. Uto, T.F., S.M., K. Sato, K.A., Y.K., M.K., R.I., K.M., K.K., Y.U., H.U. and H.Y. analyzed and interpreted the data; and K. Shimoda conceived the research, directed the project, supervised the study, and wrote the manuscript.
Conflict-of-interest disclosure: K. Shimoda has received research funding from PharmaEssentia. Murine ropeginterferon-α-2b was a gift from PharmaEssentia. The remaining authors declare no competing financial interests.
Correspondence: Kazuya Shimoda, Division of Hematology, Diabetes, and Endocrinology, Department of Internal Medicine, Faculty of Medicine, University of Miyazaki, Miyazaki, 889-1692, Japan; email: kshimoda@med.miyazaki-u.ac.jp.
References
Author notes
Gene expression datasets obtained from mouse samples will be deposited at the DNA Data Bank of Japan. Data are available on request from the corresponding author, Kazuya Shimoda (kshimoda@med.miyazaki-u.ac.jp).
The full-text version of this article contains a data supplement.

