Key Points
PBL-like lymphoma cell subpopulation is enriched in some patients with PCNSL.
This study suggests a novel rationale for using the PBL-like subpopulation as a potential therapeutic target in patients with PCNSL.
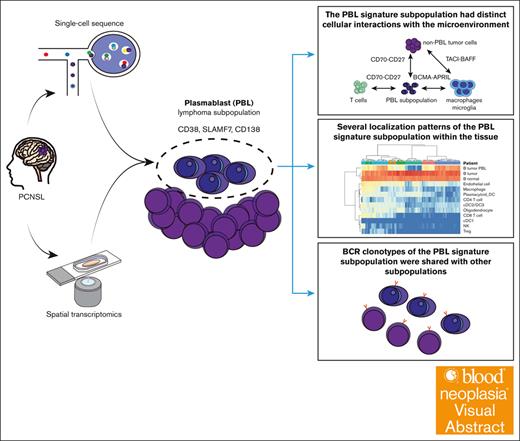
Visual Abstract
Primary central nervous system lymphoma (PCNSL) is a rare, aggressive type of lymphoma, most often histologically diagnosed as diffuse large B-cell lymphoma (DLBCL). Recent advancements in single-cell sequencing have elucidated that the diverse germinal center states in systemic DLBCL manifest as tumor cell diversity, intricately linked to variations in the microenvironment. However, detailed characterization of intratumoral heterogeneity reflecting B-cell states in PCNSL remains elusive. Here, we conducted single-cell and spatial multiomic analyses to elucidate the cellular and spatial heterogeneity and the microenvironment in PCNSL. We identified a distinctive lymphoma subpopulation with gene and protein expression similar to that of plasmablasts (PBLs), enriched in some patients with PCNSL. B-cell receptor (BCR) analysis revealed that BCR clonotypes of the PBL signature subpopulation were shared with other subpopulations, suggesting a common origin with other lymphoma cell subtypes. Spatial analysis additionally revealed several localization patterns of PBL signature subpopulations within the tissue, indicating spatial heterogeneity. An expansion study showed that ∼40% of patients with PCNSL had a PBL signature subpopulation, as defined by CD138 immunohistochemistry staining. Additionally, patients with a PBL signature subpopulation and low CD3+ cell infiltration exhibited a worse prognosis. Finally, intercellular communication analysis suggested that the PBL signature subpopulation had distinct cellular interactions with the microenvironment. In summary, our study identified a tumor subpopulation with a PBL signature in PCNSL, suggesting distinct molecular and spatial cross talk with the microenvironment. These findings provided new insights into the biological mechanisms of PCNSL.
Introduction
Primary central nervous system lymphoma (PCNSL) is a rare aggressive type of non-Hodgkin lymphoma that develops in the central nervous system (CNS).1,2 Approximately 90% of PCNSL cases are diagnosed as diffuse large B-cell lymphoma (DLBCL), mainly the activated B-cell-like (ABC) subtype based on the gene expression profile.3 However, molecular analyses using bulk samples have provided limited insights into the heterogeneity of lymphoma cells in PCNSL.
Recent breakthroughs in single-cell RNA sequencing (scRNA-seq) have enabled advanced interpretations of tumor heterogeneity and the tumor microenvironment (TME) in lymphoma. For example, single-cell expression profiling of germinal centers (GCs) has delineated the dynamics of physiological human GC B-cell development, and the resultant GC gene expression signature has facilitated novel subgroup classification of systemic DLBCL.4 Additionally, scRNA-seq uncovered malignant subpopulations in DLBCL that responded differently to antitumor drugs, implying an association between intratumor heterogeneity and treatment resistance.5 Another DLBCL scRNA-seq study showed that 5 B-cell states among malignant DLBCL cells, and cells with diverse states were present within a single tumor specimen.6 Thus, systemic DLBCL exhibits intratumor heterogeneity that reflects the GC states of B-cells.
A recent study on CNS lymphoma showed transcriptional heterogeneity of the malignant B-cells in the cerebrospinal fluid, manifested in the cell cycle and GC states.7 Other studies have identified specific cell subpopulations that are enriched in PCNSL compared with systemic DLBCL and demonstrated upregulated immune checkpoint molecules in the expanded T cells.8,9 However, the association between cell subpopulations reflecting the GC states and the pathogenesis of PCNSL remains unexplored. Notably, in systemic DLBCL, the tumor B-cell GC states influence prognosis, which has been attributed to differences in the major histocompatibility complex class 2 expression levels and the immune microenvironment,10-12 underscoring the pivotal role of GC states in systemic DLBCL.
Over the past decade, mounting evidence has shown that the composition of the TME has a prognostic impact on lymphoma, including PCNSL. PCNSL exhibits a less favorable immune infiltration pattern compared with systemic DLBCL.13 The presence of a low number of cytotoxic T cells in tumors is associated with an unfavorable prognosis.14,15 Moreover, recent single-cell studies have revealed upregulated immune checkpoint molecules in expanded tumor-infiltrating CD8 T cells, leading to immune evasion of PCNSL cells.8,9 However, the differences in the molecular and spatial interactions of the tumor subpopulations with the microenvironment remain largely unclear.
To address this issue, we conducted multimodal single-cell and spatial analyses to characterize the molecular and spatial heterogeneity of PCNSL cells and elucidate the relationship between tumor heterogeneity and infiltrating immune cells. We identified the differentiation of lymphoma cells into plasmablasts (PBLs) in some regions of PCNSL. The cellular communication analysis implied that PBL lymphoma cells had different interactions with the surrounding cells from that of lymphoma cells.
Methods
Human sample collection
Seven human PCNSL tumor samples for single-cell sequencing were obtained through stereotactic biopsies performed by neurosurgeons between August 2021 and October 2022 at the Okayama University Hospital (Okayama, Japan). All tumor samples were collected at the time of diagnosis. PCNSL was diagnosed by expert hematopathologists. None of the patients had received chemotherapy or steroid therapy prior to the biopsy. Two reactive lymph node (RLN) samples were collected between January 2022 and December 2022. Written informed consent was obtained from all participants. The study was conducted in accordance with the Declaration of Helsinki and approved by the Ethics Committee of Okayama University Hospital (approval number 1608-026 and 2012-025). The clinical data of the enrolled patients are summarized in supplemental Table 1.
Single-cell sample preparation and data processing
Single-cell sequencing was performed using a chromium system (10× Genomics, Pleasanton, CA). Briefly, a viable single-cell solution was processed using a Chromium single cell reagent kit (10× Genomics, Pleasanton, CA) with the associated products. The libraries were sequenced to provide an adequate sequence depth (supplemental Table 12).
Four PCNSL samples were analyzed only by transcriptomics, and 3 cases and 2 RLN samples were analyzed by a combination of transcriptomics, B-cell receptor (BCR), T-cell receptor (TCR), and surface proteins (Figure 1A; supplemental Table 12). The sample preparation and data processing methods are described in detail in the supplemental Material.
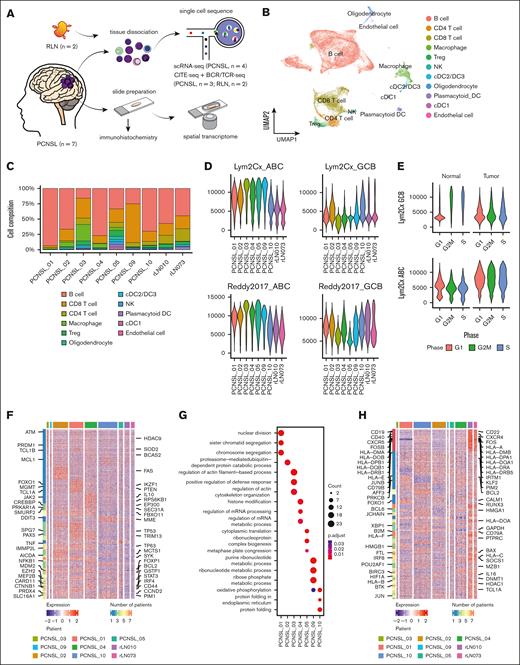
Landscape of single-cell analysis and interpatient heterogeneity in PCNSL. (A) Schematic of the workflow for single-cell sequencing, spatial transcriptomics, and IHC analyses. (B) Uniform manifold approximation and projection (UMAP) plot of all cells after the integration assay colored according to the cell type. (C) Bar chart shows the proportion of each cell type split by samples. (D) Violin plot of GCB and ABC signature scores based on 2 different gene lists (Scott et al16 and Reddy et al17). (E) Violin plot shows the distribution of the GCB signature score between tumor and reactive samples. (F) Heat map of the top differentially upregulated genes in each sample. (G) Dot plot shows representative biological pathways enriched in each patient using Gene Ontology Biological Process. (H) Heat map of the top differentially downregulated genes in each sample. DC, dendric cell; NK, natural killer cell; Treg, regulatory T cell.
Landscape of single-cell analysis and interpatient heterogeneity in PCNSL. (A) Schematic of the workflow for single-cell sequencing, spatial transcriptomics, and IHC analyses. (B) Uniform manifold approximation and projection (UMAP) plot of all cells after the integration assay colored according to the cell type. (C) Bar chart shows the proportion of each cell type split by samples. (D) Violin plot of GCB and ABC signature scores based on 2 different gene lists (Scott et al16 and Reddy et al17). (E) Violin plot shows the distribution of the GCB signature score between tumor and reactive samples. (F) Heat map of the top differentially upregulated genes in each sample. (G) Dot plot shows representative biological pathways enriched in each patient using Gene Ontology Biological Process. (H) Heat map of the top differentially downregulated genes in each sample. DC, dendric cell; NK, natural killer cell; Treg, regulatory T cell.
Sample preparation and data analysis for DSP
Six formalin-fixed paraffin-embedded (FFPE) tissue samples subjected to single-cell sequencing were chosen for GeoMx digital spatial profiling (DSP) analysis. PCNSL_03 was excluded because of limited tissue availability. The GeoMx DSP preparation process and downstream analysis are described in detail in the supplemental Material.
IHC staining
In addition to single-cell analysis, immunohistochemistry (IHC) was performed on the brain biopsy samples using antibodies against CD20, CD3, CD8, CD68, CD10, BCL6, MUM1, CD38, CD39, SLAMF7, and CD138 (supplemental Table 3). This method is described in detail in the supplemental Material.
Survival analyses
Survival was analyzed using the Kaplan-Meier method and compared using the log-rank test by using the survival (version 3.5) and survminer (version 0.4.9) packages. The optimal cutoff point of CD3, CD8, and CD68 cell counts for progression-free survival (PFS) and overall survival (OS) was calculated using the surv_cutoff function, which could provide a value of a cutoff point that corresponds to the most significant relation with survival. The Cox proportional hazard model was used to calculate the hazard ratio (HR) for survival.
Results
Single-cell transcriptomic and phenotypic profile of PCNSL
We applied scRNA-seq for 4 PCNSL samples and cellular indexing of transcriptomes and epitopes by sequencing (CITE-seq) for 3 PCNSL samples (Figure 1A; supplemental Table 1). The B-cell population was observed as distinct clusters corresponding to the individuals, highlighting interpatient tumor heterogeneity (supplemental Figure 1A-D). Similar heterogeneity has been reported in other PCNSL and DLBCL studies.7,18
Upon correcting for batch effects, 11 major cell lineages were identified based on known marker genes and surface antigens (Figure 1B; supplemental Figure 2A-E). The cell composition varied significantly among patients (Figure 1C). The identified major nonlymphoma cell lineages were T-cells and macrophages.
Intertumor heterogeneity of PCNSL
Next, we extracted only the B-cell cluster (supplemental Figure 3A). To categorize the cell of origin (COO) at each cell level, gene set enrichment analysis was performed using known COO gene sets.16,17 Cells with high ABC scores and cells with high GC B-cell (GCB) scores were exclusively distributed (supplemental Figure 3B). Basically, most malignant cells showed high ABC scores. Especially, malignant cells from PCNSL_03 and PCNSL_05 were predominantly of the ABC subtype. Notably, PCNSL_10 cells coexisted with cells with high GCB and ABC scores (Figure 1D; supplemental Figure 3C). Intriguingly, the G2/M and S cell cycle states were associated with elevated GCB subtype scores in nonmalignant B cells; conversely, the tumor cells displayed no discernible correlation between the cell cycle state and COO subtype score (Figure 1E).
To investigate intertumor heterogeneity, we conducted differential expression genes (DEG) analyses comparing B cells from each tumor sample with those from RLN samples (supplemental Table 4 and 5). Using a curated gene set for DLBCL (C0079744) from DisGeNET,19 which includes genes associated with DLBCL biology, we observed that the number of lymphoma-related genes consistently upregulated across all PCNSL samples was fewer than those upregulated in individual samples (Figure 1F; supplemental Figure 4A). Gene ontology analyses revealed distinct cellular processes for each tumor sample (Figure 1G). In contrast, genes related to HLA and B-cell markers (CD19 and CD79A) were frequently downregulated in all PCNSL samples compared with in RLN samples (Figure 1H; supplemental Figure 4B-C). The downregulation of major histocompatibility complex class 2 is known to contribute to immune evasion and poor prognosis in systemic DLBCL.20 These results suggest that although each tumor sample exhibits a unique gene expression profile, there are common molecular features among malignant cells, including the downregulation of HLA-related gene expression.
PBL signature subcluster has a distinct gene expression profile
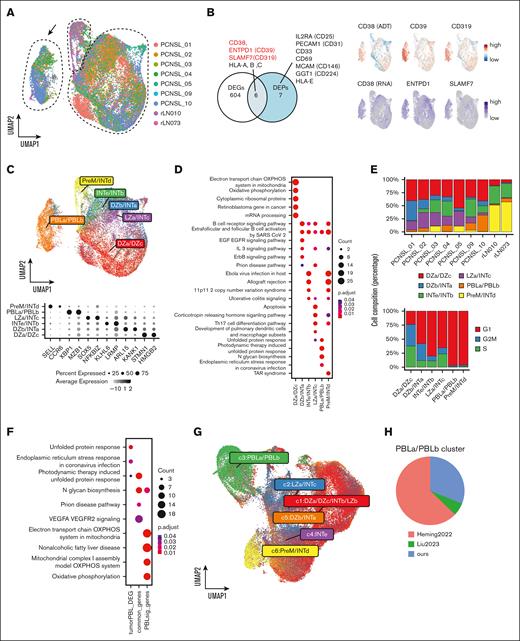
To classify the features of lymphoma cells, B-cell subsets were processed using batch effects correction (Figure 2A; supplemental Figure 5A-B). We identified 3 major clusters: the largest cluster comprised all patients with PCNSL, its connecting cluster included nonmalignant B-cells, whereas the third cluster contained some patients that were apparently separated from the other 2 clusters (Figure 2A, arrow). Although surface antigen data was derived from 3 of 7 PCNSL samples, DEG and differentially expressed protein analysis showed that the separate cluster exhibited upregulation of differentiated B-cell markers (CD38, ENTPD1, and SLAMF7), suggesting that a phenotypic resemblance to PBLs (Figure 2B; supplemental Table 6). The separate cluster highly expressed PBL-related transcription factors including XBP1 and MZB1, and slightly expressed SDC1 (supplemental Figure 5C).
Intratumor heterogeneity and identification of PBL signature lymphoma cells. (A) UMAP plot of B cells colored according to the samples. The black arrow shows the separated cell subpopulation (PBL subcluster). (B) Venn diagram shows the overlap between the DEGs and differential expression proteins (DEPs) of the distinct PBL subcluster compared with other B-cell subclusters. DEPs are displayed. The UMAP plot shows the gene and protein expression levels of CD38, CD39 (ENTPD1), and CD319 (SLAMF7). (C) The UMAP plot shows nonnegative matrix factorization clustering (NMF) based on the GC signature score, and the dot plot shows the representative genes of each GC signature. (D) Dot plot showing the pathway upregulated in GC signature subclusters using WikiPathways. (E) Upper bar chart shows the proportion of the GC signature subcluster in each patient. Lower bar chart shows cell cycle stages in each GC signature subcluster. (F) Dot plot shows the enriched pathways in tumor PBL cells, commonly upregulated pathways in tumor PBL and normal PBL cells, and differentially upregulated pathways in normal PBL cells using WikiPathways. (G) UMAP plot of NMF clustering based on the GC signature score in our data and publicly available single-cell PCNSL data after integration assay (Heming et al8 and Liu et al9). (H) The pie chart shows the fraction of the PBLa/PBLb cluster originating from each data set. PBL, plasmablast; DEGs, differential expression genes; PreM, precursor memory B-cell; INT, intermediate zone; LZ, light zone; dark zone; UMAP, Uniform Manifold Approximation and Projection.
Intratumor heterogeneity and identification of PBL signature lymphoma cells. (A) UMAP plot of B cells colored according to the samples. The black arrow shows the separated cell subpopulation (PBL subcluster). (B) Venn diagram shows the overlap between the DEGs and differential expression proteins (DEPs) of the distinct PBL subcluster compared with other B-cell subclusters. DEPs are displayed. The UMAP plot shows the gene and protein expression levels of CD38, CD39 (ENTPD1), and CD319 (SLAMF7). (C) The UMAP plot shows nonnegative matrix factorization clustering (NMF) based on the GC signature score, and the dot plot shows the representative genes of each GC signature. (D) Dot plot showing the pathway upregulated in GC signature subclusters using WikiPathways. (E) Upper bar chart shows the proportion of the GC signature subcluster in each patient. Lower bar chart shows cell cycle stages in each GC signature subcluster. (F) Dot plot shows the enriched pathways in tumor PBL cells, commonly upregulated pathways in tumor PBL and normal PBL cells, and differentially upregulated pathways in normal PBL cells using WikiPathways. (G) UMAP plot of NMF clustering based on the GC signature score in our data and publicly available single-cell PCNSL data after integration assay (Heming et al8 and Liu et al9). (H) The pie chart shows the fraction of the PBLa/PBLb cluster originating from each data set. PBL, plasmablast; DEGs, differential expression genes; PreM, precursor memory B-cell; INT, intermediate zone; LZ, light zone; dark zone; UMAP, Uniform Manifold Approximation and Projection.
Nonnegative matrix factorization clustering based on the enrichment score of gene signatures in normal GC processing
Next, we performed enrichment analysis using 13 gene sets corresponding to the GC process.4 Each GC signature score showed its own distribution pattern; precursor memory B-cell (PreM) scores were high in the normal B-cell cluster and PBL scores were enriched in the separated cluster (supplemental Figure 5D). Based on GC signature scores, we divided the samples into 6 clusters using a nonnegative matrix factorization algorithm: dark zone a (DZa)/DZc, light zone a/intermediate zone c (INTc), DZb/INTa, INTe/INTb, PreM/INTd, and PBLa/PBLb (Figure 2C). DEGs and their functions in each subcluster were identified, with the top upregulated genes in the DZa/DZc, PreM/INTd, and PBLa/PBLb subclusters being cluster specific (Figure 2D; supplemental Figure 6; supplemental Table 7) Figure 2. Some GC signatures reflect cell cycling, particularly in the dark zone4; however, our clustering was not biased along the cell cycle as shown by the variation within each cluster (Figure 2E). Notably, each PCNSL sample contained several GC states, indicating intratumor heterogeneity.
Characterization of PBL signature lymphoma cells in PCNSL
To reveal differences between physiological and malignant PBLs, we compared the GC gene sets4 for normal PBLa/PBLb with the identified DEGs in our PBL subcluster (supplemental Table 8). Approximately half of the upregulated DEGs in the PBL subcluster overlapped with the normal PBLa/PBLb GC signature genes. This observation suggests that malignant cells in the PBL subcluster shared functional similarities with normal PBL cells (Figure 2F). Conversely, an intrinsic distinction was observed between the oxidative phosphorylation systems of normal and malignant PBL cells.
To validate the presence of tumor PBL cells, we integrated our data set with 2 publicly accessible scRNA-seq data sets of PCNSL8,9 and eventually confirmed the existence of the PBLa/PBLb signature cells in the combined data sets (Figure 2G). The PBLa/PBLb clusters were primarily derived from our data set and that of Heming et al8 (Figure 2H). Additionally, we compared the presence of PBL signature lymphoma cells in patients with PCNSL with that in patients with systemic DLBCL5,6 (supplemental Figure 7A-C).
Decomposition of publicly available bulk RNA-seq data in PCNSL
Next, we performed decomposition of publicly available bulk RNA-seq data in PCNSL. For validation, we obtained comparable cell composition from the pseudo-bulk data of our scRNA-seq data set by using the Bisque algorithm (supplemental Figure 8A). Decomposition of the public data21-23 showed that malignant B cells were the predominant fraction in almost all samples, and some PCNSL samples had the malignant PBL composition (supplemental Figure 8B).
Clonal analysis of tumor B cells
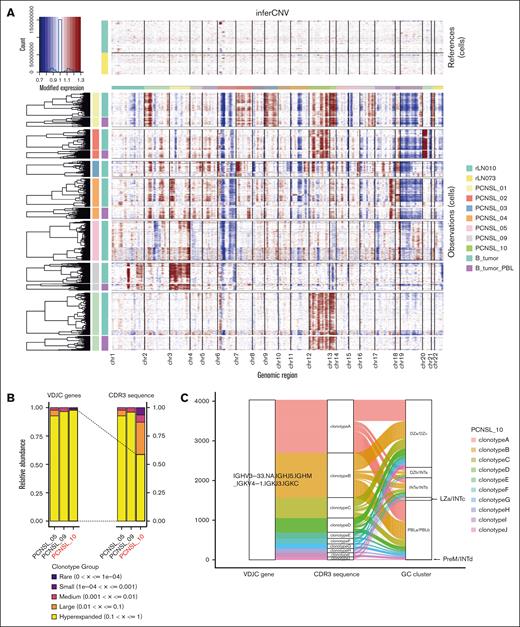
To estimate tumor clonality in patients, copy number variants were inferred using the infercnv package. We confirmed known copy number alterations, such as amplification of chromosome 12 and deletion of chromosomes 6 and 19 in our cohort (Figure 3A). We could validate the intertumor differences; however, intratumor differences among the malignant B-cell subtypes were not observed (Figure 3A).
Ongoing somatic hypermutation in PCNSL and the relationship between clonotypes and GC signature subclusters. (A) Heat map showing copy number variation profiles of each sample split into PBL and non-PBL subclusters. Amplification of chromosomal regions is colored in red, whereas deletion of chromosomal regions is shown in blue. (B) Bar chart showing the abundance of clonotypes according to the expansion status of each patient. The sample of PCNSL_10 experienced ongoing somatic hypermutation. (C) Sanky diagram showing the relationship between the clonotypes based on the VDJC gene (left), clonotypes based on the CDR3 sequence (middle), and GC signature subclusters (right) in PCNSL_10. GC, germinal center; PBL, plasmablast; DZ, dark zone; INT, intermediate zone; LZ, light zone; PreM, precursor memory B-cell.
Ongoing somatic hypermutation in PCNSL and the relationship between clonotypes and GC signature subclusters. (A) Heat map showing copy number variation profiles of each sample split into PBL and non-PBL subclusters. Amplification of chromosomal regions is colored in red, whereas deletion of chromosomal regions is shown in blue. (B) Bar chart showing the abundance of clonotypes according to the expansion status of each patient. The sample of PCNSL_10 experienced ongoing somatic hypermutation. (C) Sanky diagram showing the relationship between the clonotypes based on the VDJC gene (left), clonotypes based on the CDR3 sequence (middle), and GC signature subclusters (right) in PCNSL_10. GC, germinal center; PBL, plasmablast; DZ, dark zone; INT, intermediate zone; LZ, light zone; PreM, precursor memory B-cell.
Next, we conducted single-cell BCR repertoire analysis. B-cells from PCNSL samples displayed a monoclonal pattern characterized by the predominant use of a single BCR-VDJC gene (Figure 3B). However, clonal diversity analysis based on the nucleotide sequence of CDR3 revealed that B-cells in PCNSL_10 had multiple clonotypes. The CDR3 clonotypes were derived from the same BCR VDJC clone (Figure 3C). These findings indicate the occurrence of somatic hypermutation after tumor development in this specific case. A reanalysis of previous data sets confirmed the occurrence of BCR somatic hypermutation in 1 of 7 patients (supplemental Figure 9A-B). Notably, each clonotype was distributed in each GC cluster with a similar composition (Figure 3C), indicating that malignant PBLs originated from a specific clone.
Spatial analysis confirmed cellular heterogeneity across patients
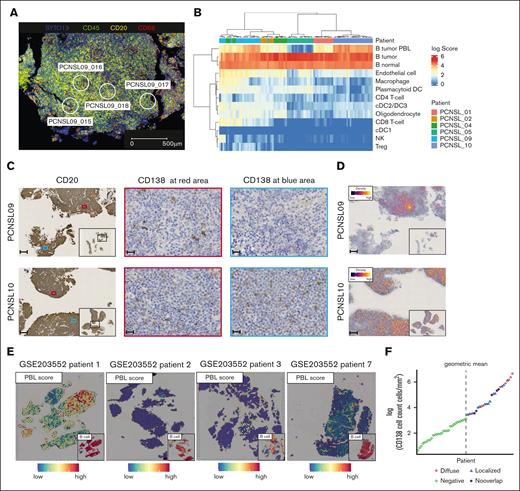
Next, we performed transcriptomic profiling of tumor cells on FFPE slides using GeoMx. In 6 FFPE specimens, 94 regions covering representative tumor areas were analyzed (Figure 4A; supplemental Figure 10A). We confirmed that the DEGs among patients obtained from GeoMx were consistent with those detected by scRNA-seq (supplemental Figure 10B-C). Deconvolution of the gene profile of each region to cell composition revealed diverse cell subtypes (Figure 4B). The PBL scores were consistent with the results from scRNA-seq, showing higher scores in PCNSL_09 and PCNSL_10 and a lower score in PCNSL_05. Notably, PCNSL_10 demonstrated high PBL scores across all regions (diffuse pattern), whereas PCNSL_09 exhibited spatial variation among the regions (localized pattern). We validated the presence of PBL signature lymphoma cells through IHC. Based on the results of our analysis and previous reports,24 we identified CD38, CD39, SLAMF7, and CD138 as potential markers for the PBL signature cells. However, it was difficult to distinguish whether tumor cells expressed CD38, CD39, or SLAMF7 because other microenvironment cells also expressed these antigens.25 Therefore, we used CD138 staining to identify the samples with PBL signature cells, and we confirmed the presence and the distribution pattern of PBL signature cells through CD138 IHC (Figure 4C-D). In a previous spatial transcriptome analysis of PCNSL,8 the malignant PBL signature cells were found in 1 of 4 patients in a specific area of the tumor biopsy (Figure 4E).
Spatial analyses of the heterogeneity of distribution of PBL signature positive cells. (A) Representative immunofluorescence image of GeoMx DSP shows the selected region of interests in PCNSL_09. Blue, nuclei stain (SYTO13); green, anti-CD45; yellow, anti-CD20; red, anti-CD68. Scale bar shows 500 μm. (B) Heat map of the estimated cell proportion in each area of interest (AOI) shows higher variation across samples than within samples. Each column represents an AOI. (C) Representative images of CD20 and CD138 IHC in 2 samples with PBL signature cells. In PCNSL_09, the distribution of CD138+ cells varies within the tumor, whereas in patient 10, CD138+ cells are uniformly distributed throughout the tumor. Small panel of CD20 staining shows an overall image of the tumor. Scale bar shows 200 μm (CD20) or 20 μm (CD138). (D) Representative density map of CD138 IHC in PCNSL_09 and PCNSL_10. Yellow lines represent CD138+ cells. Scale bar shows 200 μm. (E) Spatial feature plot shows the PBL signature score and B cells in publicly available data (Heming et al8). Patient 1 harbors PBL signature lymphoma cells and their distribution varies within the tumor, whereas other patients hardly harbor high PBL score areas. (F) Dot plot shows the logarithmic number of CD138+ cells per square millimeter in each sample. The dotted line denotes the determined cutoff value, derived as the geometric mean of CD138+ cell counts per square millimeter. The term "Diffuse" designates a uniform distribution of CD138+ cells throughout the tumor (the presence of CD138+ cells in more than two-thirds of the CD20+ area). "Localized" indicates a variable distribution of CD138+ cells within the tumor (the presence of CD138+ cells in less than two-thirds of the regions). “Negative” denotes instances where the count of CD138+ cells falls below the established cutoff value. “No overlap” indicates CD138+ cells are present outside the CD20+ regions. PBL, plasmablast; DC, dendric cell; NK, natural killer cell; Treg, regulatory T cell.
Spatial analyses of the heterogeneity of distribution of PBL signature positive cells. (A) Representative immunofluorescence image of GeoMx DSP shows the selected region of interests in PCNSL_09. Blue, nuclei stain (SYTO13); green, anti-CD45; yellow, anti-CD20; red, anti-CD68. Scale bar shows 500 μm. (B) Heat map of the estimated cell proportion in each area of interest (AOI) shows higher variation across samples than within samples. Each column represents an AOI. (C) Representative images of CD20 and CD138 IHC in 2 samples with PBL signature cells. In PCNSL_09, the distribution of CD138+ cells varies within the tumor, whereas in patient 10, CD138+ cells are uniformly distributed throughout the tumor. Small panel of CD20 staining shows an overall image of the tumor. Scale bar shows 200 μm (CD20) or 20 μm (CD138). (D) Representative density map of CD138 IHC in PCNSL_09 and PCNSL_10. Yellow lines represent CD138+ cells. Scale bar shows 200 μm. (E) Spatial feature plot shows the PBL signature score and B cells in publicly available data (Heming et al8). Patient 1 harbors PBL signature lymphoma cells and their distribution varies within the tumor, whereas other patients hardly harbor high PBL score areas. (F) Dot plot shows the logarithmic number of CD138+ cells per square millimeter in each sample. The dotted line denotes the determined cutoff value, derived as the geometric mean of CD138+ cell counts per square millimeter. The term "Diffuse" designates a uniform distribution of CD138+ cells throughout the tumor (the presence of CD138+ cells in more than two-thirds of the CD20+ area). "Localized" indicates a variable distribution of CD138+ cells within the tumor (the presence of CD138+ cells in less than two-thirds of the regions). “Negative” denotes instances where the count of CD138+ cells falls below the established cutoff value. “No overlap” indicates CD138+ cells are present outside the CD20+ regions. PBL, plasmablast; DC, dendric cell; NK, natural killer cell; Treg, regulatory T cell.
To determine the phenotypic and clinical relevance of the PBL signature cells, we expanded our cohort by using archived PCNSL tissues (n = 56). Approximately three-quarters of patients in the expanded cohort received high-dose methotrexate (HD-MTX)-based chemotherapy (supplemental Tables 7 and 9 and 10). By using the cutoff point (supplemental Methods), 22 of 56 patient samples (39%) were classified as CD138+ (Figure 4F; supplemental Table 9). Notably, patients with CD138+ samples were significantly older than those with CD138− samples; they also tended to show low Eastern Cooperative Oncology Group performance status and Memorial Sloan-Kettering Cancer Center scores (supplemental Table 9). Among patients with CD138+, approximately one-third exhibited a diffuse distribution pattern (Figure 4F; supplemental Figure 11).
Difference in immune cell infiltration was associated with prognosis in PCNSL
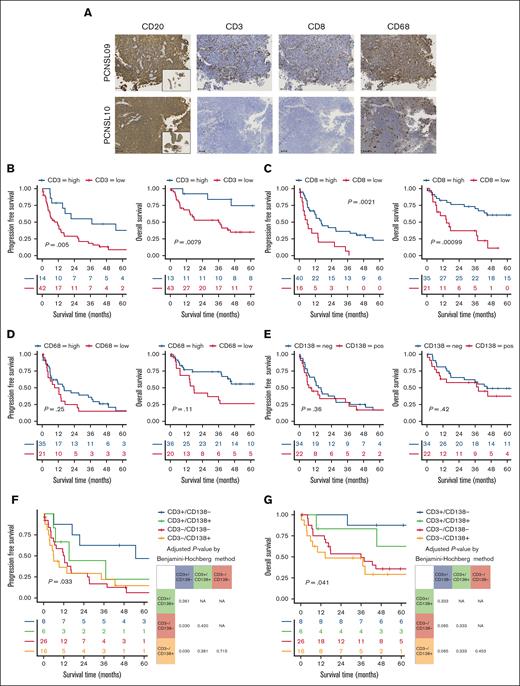
Regarding tumor-infiltrating immune cells, spatial analysis revealed both intertumor and intratumor differences. PCNSL_02, _04, and _09 displayed a higher proportion of immune cells (T-cells and macrophages) than the other samples. Moreover, PCNSL_04 and PCNSL_09 exhibited distinct cell compositions among the regions of interest (Figure 4B). Immunostaining for CD3, CD8, and CD68 showed the infiltrating immune cells coexisting with tumor cells, consistent with the results of GeoMx analysis (Figure 5A).
Low T-cell infiltration PBL signature PCNSL shows unfavorable prognosis. (A) Representative IHC images of 2 samples show tumor cells diffusely positive for CD20 and the variations in the infiltration of CD3+, CD8+, and CD68+ cells. Small panel of CD20 staining shows an overall image of the tumor. Scale bar shows 100 μm. (B) Kaplan-Meier survival curves of PFS (left) and OS (right) for patients with high or low CD3+ infiltration. (C) Kaplan-Meier survival curves of PFS (left) and OS (right) for patients with high or low CD8+ infiltration. (D) Kaplan-Meier survival curves of PFS (left) and OS (right) for patients with high or low CD68+ infiltration. (E) Kaplan-Meier survival curves show no significant difference in PFS (left) or OS (right) between patients with or without CD13+ lymphoma cells. Kaplan-Meier survival curves for PFS (F) and OS (G) according to the presence of CD138+ cells and the degree of CD3+ cell infiltration. The tables show adjusted P value using the Benjamini-Hochberg method, with P values <.05 highlighted in red.
Low T-cell infiltration PBL signature PCNSL shows unfavorable prognosis. (A) Representative IHC images of 2 samples show tumor cells diffusely positive for CD20 and the variations in the infiltration of CD3+, CD8+, and CD68+ cells. Small panel of CD20 staining shows an overall image of the tumor. Scale bar shows 100 μm. (B) Kaplan-Meier survival curves of PFS (left) and OS (right) for patients with high or low CD3+ infiltration. (C) Kaplan-Meier survival curves of PFS (left) and OS (right) for patients with high or low CD8+ infiltration. (D) Kaplan-Meier survival curves of PFS (left) and OS (right) for patients with high or low CD68+ infiltration. (E) Kaplan-Meier survival curves show no significant difference in PFS (left) or OS (right) between patients with or without CD13+ lymphoma cells. Kaplan-Meier survival curves for PFS (F) and OS (G) according to the presence of CD138+ cells and the degree of CD3+ cell infiltration. The tables show adjusted P value using the Benjamini-Hochberg method, with P values <.05 highlighted in red.
In the expanded cohort, we confirmed variations in the density of immune cell infiltration and its association with survival outcomes. Samples with higher infiltration of CD3+ cells demonstrated significantly longer median PFS (37.1 vs 11.3 months; P = .005) and OS (not reached vs 35.9 months; P = .008; Figure 5B). Similarly, higher CD8+ cell infiltration was significantly associated with extended median PFS (16.4 vs 5.9 months; P = .002) and OS (78.0 vs 14.5 months; P < .001; Figure 5C). In contrast, the number of CD68+ cells did not show a significant association with longer PFS (16.2 vs 10.8 months; P = .25) or OS (67.3 vs 17.6 months; P = .11; Figure 5D).
Low T-cell infiltration PBL signature lymphoma was associated with poor prognosis
We focused on the association between immune cell infiltration and CD138+ lymphoma cells. Survival analysis indicated no significant differences in PFS and OS between patients with and without CD138+ cells (8.2 vs 16.2 months; P = .36; 38.3 vs 44.8 months; P = .42, respectively; Figure 5E). When comparing the 4 subgroups based on CD138 positivity and T-cell infiltration (CD3 positivity), our analysis demonstrated that patients with both CD138+ lymphoma cells and low T-cell infiltration had the poorest median PFS (CD3+/CD138–, 54.9 months vs CD3+/CD138+, 15.2 months vs CD3–/CD138–, 12.4 months vs CD3–/CD138+, 5.9 months; P = .033) and OS (CD3+/CD138–, not reached vs CD3+/CD138+, 71.8 months vs CD3–/CD138–, 35.9 months vs CD3–/CD138+, 14.5 months; P = .041; Figure 5F-G). Adjusted P values for PFS differences between the CD3–/CD138– and CD3–/CD138+ groups relative to the CD3+/CD138– group were 0.03. Multivariate analyses demonstrated that a positive PBL signature and low CD3 infiltration were independent prognostic factors for PFS when adjusted for age and Eastern Cooperative Oncology Group performance status (HR, 3.56; 95% confidence interval, 1.15-10.97; P = .027), or Memorial Sloan Kettering Cancer Center score (HR, 3.68; 95% confidence interval, 1.19-11.4; P = .024) (supplemental Table 11).
Among patients who received HD-MTX–based chemotherapy, those with CD138– lymphoma cells and low T-cell infiltration exhibited the poorest prognosis within the subgroup (supplemental Figure 12A-B). This result indicates that the poor prognosis in the low T-cell infiltration and PBL signature group is partly associated with not receiving HD-MTX–based chemotherapy because of age and performance status.
Estimated intercellular communication in PCNSL
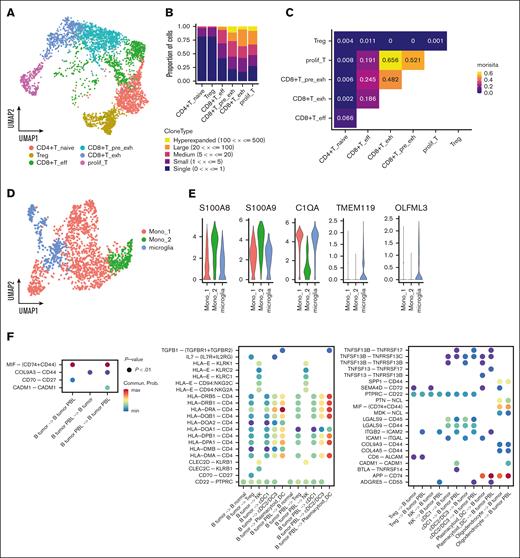
For a comprehensive understanding of the intercellular interactions, T-cell and macrophage subcluster analyses were conducted. Six T-cell subclusters were identified (Figure 6A; supplemental Figure 13A). Our scTCR-seq data showed that exhausted CD8 and proliferative T-cells exhibited TCR expansion (Figure 6B; supplemental Figure 13B), and that the clonotypes were highly shared among CD8 and proliferative T-cells (Figure 6C). Analysis of an independent PCNSL cohort9 further validated the TCR expansion in these cell types (supplemental Figure 13C-E). We also identified 2 macrophage and 1 microglial subcluster according to previously reported marker genes18,26 (Figure 6D-E).
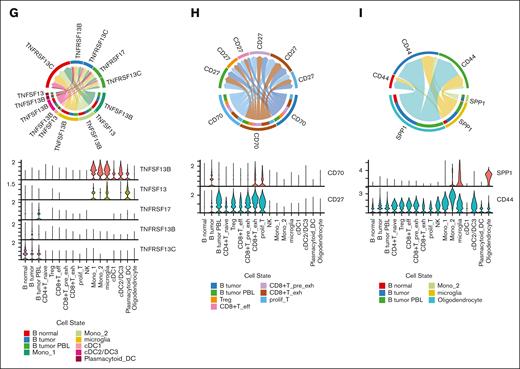
Cellular interactions between malignant cells and TME cells. (A) UMAP plot of T-cells colored by T-cell subtypes. (B) Bar chart shows abundance of clonotypes by the expansion status in each T-cell subcluster. (C) Quantification of TCR similarity index (Morisita index) between each pair of T-cell subclusters. (D) UMAP plot of macrophage/microglia colored by the cell subtypes. (E) Violin plot shows the marker gene expression of each subcluster. (F) Left bubble plot shows the significant interaction among tumor B-cells. Middle bubble plot shows the enhanced interaction of the malignant B-cells with the TME. Right bubble plot shows the significant interaction of the immune cells with the tumor B-cells. (G) Chord diagram and violin plot of interactions associated with TNFSF13B (BAFF) and TNFSF13 (APRIL). (H) Chord diagram and violin plot of CD70-CD27 interactions. (I) Chord diagram and violin plot of SPP1-CD44 interactions. CD4+T_naive, CD4+ naïve T-cell; CD8+T_pre_exh, CD8+ pre-exhausted T-cell; CD8+T_eff, CD8+ effector T-cell; CD8+T_exh, CD8+ exhausted T-cell; DC, dendric cell; Mono, monocyte; prolif_T, proliferative T-cell; Treg, regulatory T-cell.
Cellular interactions between malignant cells and TME cells. (A) UMAP plot of T-cells colored by T-cell subtypes. (B) Bar chart shows abundance of clonotypes by the expansion status in each T-cell subcluster. (C) Quantification of TCR similarity index (Morisita index) between each pair of T-cell subclusters. (D) UMAP plot of macrophage/microglia colored by the cell subtypes. (E) Violin plot shows the marker gene expression of each subcluster. (F) Left bubble plot shows the significant interaction among tumor B-cells. Middle bubble plot shows the enhanced interaction of the malignant B-cells with the TME. Right bubble plot shows the significant interaction of the immune cells with the tumor B-cells. (G) Chord diagram and violin plot of interactions associated with TNFSF13B (BAFF) and TNFSF13 (APRIL). (H) Chord diagram and violin plot of CD70-CD27 interactions. (I) Chord diagram and violin plot of SPP1-CD44 interactions. CD4+T_naive, CD4+ naïve T-cell; CD8+T_pre_exh, CD8+ pre-exhausted T-cell; CD8+T_eff, CD8+ effector T-cell; CD8+T_exh, CD8+ exhausted T-cell; DC, dendric cell; Mono, monocyte; prolif_T, proliferative T-cell; Treg, regulatory T-cell.
Next, we detected the predicted interactions between immune cells and malignant cells, as well as among the tumor cells based on scRNA-seq data (Figure 6F). Our analysis suggests potential interactions between myeloid cells and B-cells through Tumor necrosis factor superfamily (TNFSF)13 (A proliferation inducing ligand [APRIL]) and TNFSF13B (B-cell activating factor [BAFF]) signaling. Specifically, PBL tumor cells may receive signals through TNF receptor superfamily (TNFRSF)17 (B-cell maturation antigen [BCMA]), whereas non-PBL tumor cells express TNFRSF13C (BAFF-receptor [BAFF-R]) and may be influenced by TNFSF13B (Figure 6G). We observed an association between CD70 and CD27 in malignant B- and T-cells (Figure 6H). The expression of CD70 in proliferative T-cells was higher in patients with a PBL signature than in those without (supplemental Figure 14), which might have different influences on T or PBL signature cells. Additionally, our analysis indicated that SPP1-CD44 signaling molecules may mediate interactions between the tumor and glial cells (Figure 6I).
Discussion
The present study encompassed single-cell and spatial transcriptome analyses to explore heterogeneity in PCNSL. Our findings indicated a distinct PBL-like subpopulation with a unique cell-cell communication pattern within the microenvironment compared with other tumor B-cells. Spatial transcriptomics revealed case-specific variability in the distribution patterns of PBL signature lymphoma cells. Furthermore, using IHC, we identified CD138 as a marker of PBL-like lymphoma cells.
A previous study demonstrated that ∼80% of PCNSL cases exhibit the ABC phenotype.3 ABC subtype lymphoma cells depend on the activation of the NF-κB pathway through sustained active BCR signaling,27 which can lead to morphological features of plasma cell differentiation in some DLBCL cases.28 However, because the PBL signature subpopulation constitutes a minor fraction, confirming the association between the PBL signature subpopulation and ABC subtype remains challenging.
The identification of PBL signature tumor cells via bulk sequencing techniques poses challenges, whereas the single-cell analysis enables the identification of this minor cellular subpopulation. Additionally, our immunostaining findings highlighted that approximately one-third of patients with PCNSL harbor PBL-like lymphoma cells, although the data have not been validated by an independent cohort.
Our analysis indicated that T-cell–rich tumors are associated with better outcomes, as previously reported.14,15 A recent report indicated an immune-hot TME in PCSNL evolves into an immune-cold TME or immunosuppressed TME.29 Because the immune-cold TME represents a later stage in tumor development, patients with this phenotype may have a poorer prognosis. The prognostic value of the density of myeloid cells in PCNSL is controversial.30-32 Although myeloid cells interact with malignant B-cells through BAFF and APRIL signals, our analysis indicated that myeloid cell infiltration has no significant impact on survival (Figure 5D). Therefore, the T-cell–mediated immune microenvironment can have a clinical impact, supporting the use of immune-associated therapies.
Intratumor heterogeneity is a pivotal cause of therapeutic resistance.33 Our findings, supported by CITE-seq data, demonstrated that PBL signature cells had elevated surface antigen expression of CD38 and CD319 (SLAMF7) than other lymphoma cell subtypes (Figure 2B; supplemental Figure 3B). However, it is important to note that the surface antigen data were derived from only 3 of 7 PCNSL samples. In our analysis, the presence of the PBL signature subpopulation itself was not directly associated with prognosis. Although bulk RNA-seq reanalysis suggested that patients with a high PBL signature score had a poorer prognosis than those with a low PBL score,9 it is crucial to consider that the PBL gene set in this study included several immune-associated genes (eg, CSF2RA, CCR10, and CD27). Consequently, this score reflects not only the PBL signature but also aspects of the immune microenvironment. Thus, our findings suggest that the combination of PBL signature cells and T-cell–poor microenvironment can more accurately predict worse outcomes in patients with PCNSL.
The interaction between CD70 and CD27 was increased in PBL tumor cells. The role of CD70 in follicular lymphoma and systemic DLBCL has garnered increasing attention.18,34 In follicular lymphoma, CD70 facilitates lymphoma cell infiltration during tumor progression.34 Thus, non-PBL malignant cells and exhausted T cells may be associated with the invasion and survival of PBL signature cells. Another notable finding was the predicted SPP1-CD44 interaction involving glial and B cells. Previous studies have indicated elevated SPP1 gene expression in PCNSL than systemic DLBCL.35 Given the presence of glial cells in the CNS, the SPP1-CD44 interaction assumes crucial importance with regard to PCNSL composition.
Our study has several limitations. The small cohort and biopsy sample sizes may have limited our ability to fully capture the tumor heterogeneity in patients with PCNSL. We applied scRNA-seq to 4 PCNSL samples and CITE-seq to 3 PCNSL samples. Additionally, although most PCNSL samples were fresh, all RLN samples were frozen. The use of different reagents and preservation methods may have influenced the interpretation of the results to some extent. Our single-cell cohort included 3 PCNSL samples classified as GCB subtype according to the Hans criteria, leading to an overrepresentation of this subtype. We were also unable to perform gene expression profiling on bulk specimens because of the limited number of available samples. Cell composition estimates from single-cell analysis may not fully represent the original tumor heterogeneity, because certain cell types might be lost during processing. Moreover, the biopsies did not capture the complete diversity of the tumors, as evidenced by the limited number of vascular endothelial cells and the absence of astrocytes and nerve cells in our data. Finally, the interpretation of our findings, including the prognostic impact of the combined immune status and CD138 positivity, is limited by the lack of validation in an independent cohort.
Altogether, malignant cells harboring the PBL-like phenotype were observed in some patients with PCNSL, coexisting with the other conventional malignant states. These findings provide new insights into the biological mechanisms of PCNSL.
Acknowledgments
The authors thank Yukari Kawai and Hirofumi Inoue for assistance with the experimental procedure.
This work was supported by Grants-in-Aid for Scientific Research (KAKENHI: 19K07774, 22K19546, and 23H02934) (D.E.) and the Japan Agency for Medical Research and Development (grant number 22ama221516h0001) (D.E.).
Authorship
Contribution: H.K., R.C., and D.E. designed and performed the research, analyzed and interpreted data, and wrote the manuscript; Y.N. performed the research and analyzed and interpreted data; R.M., K.F., Y.O., and J.I. collected the human samples and provided clinical data; H.M., H.U., K.I., and T.U. performed experiments and analyzed data; K.S., H.F., N.A., N.F., and K.M. provided clinical data; and Y.S., Y.M., and D.E. supervised, reviewed, and edited the manuscript.
Conflict-of-interest disclosure: D.E. reports research funding from Nippon Shinyaku, Chugai, and Eisai; and honoraria from Eisai, Kyowa Kirin, Chugai, SymBio, Bristol Myers Squibb, and Nippon Shinyaku. The remaining authors declare no competing financial interests.
Correspondence: Daisuke Ennishi, Center for Comprehensive Genomic Medicine, Okayama University Hospital, 2-5-1 Shikata-cho, Kita-ku Okayama City, Okayama 700-8558, Japan; email: daisukeennishi@okayama-u.ac.jp.
References
Author notes
H.K. and R.C. contributed equally to this study.
All raw data from single-cell RNA sequencing, single-cell B-cell receptor sequencing, single-cell T-cell receptor sequencing, and single-cell antibody derived tags data have been deposited in the European Genome-phenome Archive (accession numbers EGAD50000000685 and EGAD50000000538).
The processed single-cell and spatial transcriptomics data with custom codes are available in Zenodo (https://doi.org/10.5281/zenodo.10656046).
The full-text version of this article contains a data supplement.

