
Skip Nav Destination
Close Modal
1-20 of 23861
Follow your search
Access your saved searches in your account
Would you like to receive an alert when new items match your search?
1
Journal Articles
A new sUSPect in T-ALL risk stratification
Open Access
Journal:
Blood Advances
Blood Adv (2025) 9 (24): 6467–6468.
Published: 2025
Journal Articles
Progressive NK-cell dysfunction and ILC imbalance favor immune evasion in multiple myeloma
Open Access
Journal:
Blood Advances
Blood Adv (2025) 9 (24): 6246–6251.
Published: 2025
Includes: Supplemental data
in Progressive NK-cell dysfunction and ILC imbalance favor immune evasion in multiple myeloma
> Blood Advances
Published: 2025
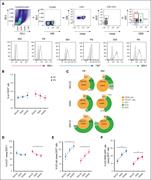
Figure 1. NK cells in MM progression. (A) The plot represents the percentages of NK cells (CD56 + CD3 – ) among CD45 + cells expressed as median values ± standard error of the mean (SEM) in PB and BM of patients with MM among the different stages (MGUS, SMM, and NDMM). A Mann-Whitney t test w... More about this image found in NK cells in MM progression. (A) The plot represents the percentages of NK ...
in Progressive NK-cell dysfunction and ILC imbalance favor immune evasion in multiple myeloma
> Blood Advances
Published: 2025
Figure 2. ILCs in MM progression. (A) Gating strategy for ILC identification and transcription factor expression in different ILC subsets present in BM and PB. (B) The plot represents the percentages of ILCs (Lin – /CD127 + ) expressed as median values ± SEM in PB and BM of patients with MM amon... More about this image found in ILCs in MM progression. (A) Gating strategy for ILC identification and tra...
Journal Articles
Clinical Trials & Observations
Journal:
Blood Advances
Blood Adv (2025) 9 (24): 6292–6304.
Published: 2025
Includes: Supplemental data
Journal Articles
Journal:
Blood Advances
Blood Adv (2025) 9 (24): 6237–6245.
Published: 2025
Includes: Supplemental data
Journal Articles
Journal:
Blood Advances
Blood Adv (2025) 9 (24): 6267–6278.
Published: 2025
Includes: Supplemental data
Journal Articles
Fifteen years of use of functional imaging in multiple myeloma: where we started and where we are going
Open Access
Journal:
Blood Advances
Blood Adv (2025) 9 (24): 6252–6266.
Published: 2025
Journal Articles
Clinical Trials & Observations
Journal:
Blood Advances
Blood Adv (2025) 9 (24): 6279–6291.
Published: 2025
Includes: Supplemental data
Journal Articles
Journal:
Blood Advances
Blood Adv (2025) 9 (24): 6314–6325.
Published: 2025
Includes: Supplemental data
Journal Articles
Journal:
Blood Advances
Blood Adv (2025) 9 (24): 6394–6401.
Published: 2025
Includes: Supplemental data
Journal Articles
Dual anti-CD19/22 and anti-BCMA CAR T-cell therapy in a patient with multiple myeloma and secondary B-ALL
Open Access
Journal:
Blood Advances
Blood Adv (2025) 9 (24): 6340–6344.
Published: 2025
Journal Articles
A novel isoform of tensin-1 promotes actin filament assembly for efficient erythroblast enucleation
Open Access
Journal:
Blood Advances
Blood Adv (2025) 9 (24): 6356–6369.
Published: 2025
Includes: Supplemental data
Journal Articles
in Fifteen years of use of functional imaging in multiple myeloma: where we started and where we are going
> Blood Advances
Published: 2025
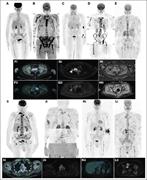
Figure 1. Disease patterns by 18 F-FDG–PET/CT and WB-DW-MRI. (A) DD by 18 F-FDG–PET/CT; (B) DD by WB-DW-MRI; (C) focal on DD by 18 F-FDG–PET/CT; (D) focal on DD by WB-DW-MRI; (E) micronodular disease by WB-DW-MRI; (F) focal disease by 18 F-FDG–PET/CT before (i) and after (ii) treatment; (G-H... More about this image found in Disease patterns by 18 F-FDG–PET/CT and WB-DW-MRI. (A) DD by 18 F-FDG–PE...
in Fifteen years of use of functional imaging in multiple myeloma: where we started and where we are going
> Blood Advances
Published: 2025
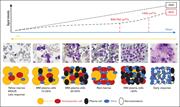
Figure 2. Relation between ADC values, signal intensity in DWI sequences, and BM cellular density during disease course and response to therapy. MGUS, monoclonal gammopathy of undetermined significance. Adapted from Dutoit et al 92 and Ormond et al. 93 More about this image found in Relation between ADC values, signal intensity in DWI sequences, and BM cell...
in Monoclonal gammopathy defines distinct clinical subsets in chronic lymphocytic leukemia across therapeutic eras
> Blood Advances
Published: 2025
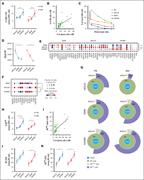
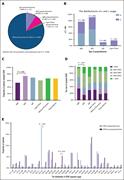
Figure 1. The distribution of MG in CLL and its relationship to IGHV gene. (A) Distribution of different subtypes of MG. (B) The distribution of lambda and kappa light-chain use in different types of paraproteinemia. (C) Proportion of patients with mutated IGHV in different MG group. (D) Rel... More about this image found in The distribution of MG in CLL and its relationship to IGHV gene. (A) Dis...
in Monoclonal gammopathy defines distinct clinical subsets in chronic lymphocytic leukemia across therapeutic eras
> Blood Advances
Published: 2025
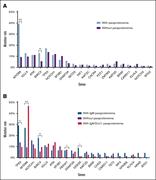
Figure 2. Gene mutation spectrum detected by next-generation target sequencing. (A) Gene mutation rate in MG-positive and MG-negative patients with CLL. (B) Mutation rates in patients with different types of paraproteinemia. ∗ P < .05; ∗∗ P < .01; ∗∗∗ P < .001. More about this image found in Gene mutation spectrum detected by next-generation target sequencing. (A) ...
in Monoclonal gammopathy defines distinct clinical subsets in chronic lymphocytic leukemia across therapeutic eras
> Blood Advances
Published: 2025
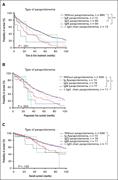
Figure 3. Survival analysis of MG-positive and MG-negative patients with CLL. (A) TTFT. (B) PFS. (C) OS. ∗ P < .05; ∗∗ P < .01; ∗∗∗ P < .001. More about this image found in Survival analysis of MG-positive and MG-negative patients with CLL. (A) TT...
in Monoclonal gammopathy defines distinct clinical subsets in chronic lymphocytic leukemia across therapeutic eras
> Blood Advances
Published: 2025
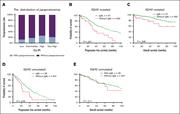
Figure 4. Subgroup survival analysis of patients with MG stratified by IGHV mutation status. (A) The proportion of patients with MG in each risk group of CLL-IPI. (B-C) PFS and OS in patients with CLL with mutated IGHV . (D-E) PFS and OS in patients with CLL with unmutated IGHV . More about this image found in Subgroup survival analysis of patients with MG stratified by IGHV mutatio...
1

