Key Points
The enzyme ACLY is required for the transformation of thymic immature progenitors upon PTEN loss.
ACLY activation represents a metabolic vulnerability with therapeutic potential in high-risk PTEN-altered human T-ALL.
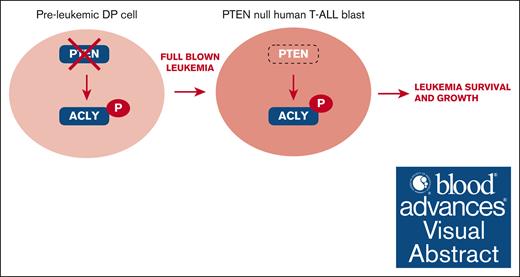
Visual Abstract
Alterations inactivating the tumor suppressor gene PTEN drive the development of solid and hematologic cancers, such as T-cell acute lymphoblastic leukemia (T-ALL), in which phosphatase and tensin homolog (PTEN) loss defines poor-prognosis patients. We investigated the metabolic rewiring induced by PTEN loss in T-ALL, aiming to identify novel metabolic vulnerabilities. We showed that the enzyme adenosine triphosphate (ATP) citrate lyase (ACLY) is strictly required for the transformation of thymic immature progenitors and the growth of human T-ALL, which remain dependent on ACLY activity even upon transformation. Although Pten-mutant mice all died within 17 weeks, the concomitant Acly deletion prevented disease initiation in 70% of the animals. In these animals, ACLY promoted B-cell lymphoma (BCL-2) epigenetic upregulation and prevented the apoptosis of premalignant double-positive thymocytes. Transcriptomic and metabolic analysis of primary T-ALL cells next translated our findings to the human pathology, showing that PTEN-altered T-ALL cells activate ACLY and are sensitive to its genetic targeting. ACLY activation thus represents a metabolic vulnerability with therapeutic potential for high-risk patients with T-ALL.
Introduction
The phosphoinositide 3-kinase/protein kinase B (PI3K/AKT) signaling pathway regulates essential cellular functions such as proliferation, survival, migration, and metabolism. Directly opposing PI3K/AKT activation, the lipid phosphatase PTEN (phosphatase and tensin homolog) deleted on chromosome 10 fine-tunes these functions, ensuring the maintenance of tissue homeostasis. PI3K-AKT–activating mutations and/or alterations inactivating PTEN lead to the development of distinct human pathologies including cancer, in which they are among the most frequent oncogenic events. This holds true not only for solid tumors but also for numerous hematologic malignancies such as those arising from the transformation of thymic progenitor cells. During physiological conditions, PTEN regulates major developmental checkpoints in these cells, namely the beta selection.1 and the positive and the negative selections.2 During pathological conditions, instead, these cells undergo multiple genomic and nongenomic mechanisms that inactivate PTEN,3,4 thus driving transformation. As such, PTEN function is lost in both adult and pediatric T-cell acute lymphoblastic leukemia (T-ALL).3,5 Similarly, PTEN alterations have been found also in pediatric T-cell lymphoblastic lymphoma,6 a closely related immature T-cell neoplasm.7 In both these malignancies, genomic PTEN alterations have a negative prognostic impact, and they identify a subgroup of patients at high risk of relapse.5,6,8-10 Genomic PTEN inactivation, moreover, correlates with therapy resistance in T-ALL cohorts.5,10,11 An unmet clinical challenge is, therefore, to provide novel therapies for these PTEN-altered patients with dismal outcomes.
PTEN supraphysiological expression induces a switch in the cellular metabolism, which protects the cells from the oncogenic transformation.12 Conversely, in distinct cell types, PTEN loss increases lipid biogenesis, glycolysis, and protein synthesis and affects mitochondrial metabolism.13 Similar to solid tumors, leukemic cells need to rewire their metabolism to face cell growth and survival. In this context, PTEN loss is likely to play an important role. We addressed this aspect in T-ALL cells to identify novel metabolic vulnerabilities and related therapeutic targets. Combining metabolic and transcriptomic profiling, a murine T-ALL/lymphoma model, and T-ALL patient-derived xenografts (PDXs), we identified adenosine triphosphate (ATP) citrate lyase (ACLY) as a crucial player in the metabolic rewiring induced upon PTEN loss during T-ALL development. This central metabolic enzyme uses coenzyme A (CoA) and mitochondrial citrate to synthesize acetyl-CoA, which is indispensable for multiple anabolic reactions, such as the synthesis of fatty acids, cholesterol, and specific amino acids.14 Activated by AKT1 in response to oncogenic signaling and cytokine stimulation,15 ACLY promotes histone acetylation in both cancer and immune cells because acetyl-CoA is also the essential cofactor of histone acetyltransferases.16-19 In this study, we demonstrated that ACLY is a metabolic player required for the oncogenic transformation of thymic T-cell progenitors as well as for the growth of established human T-ALL cells, in which it opens a therapeutic vulnerability.
Methods
Mice
PTENflox/flox (B6.129S4-Ptentm1Hwu/J), CD4Cre (B6.Cg-Tg(Cd4-cre)1Cwi/BfluJ), ROSAYFPflox/flox (B6.129X1-Gt(ROSA)26Sortm1(EYFP)Cos/J), and ACLYflox/flox mice (Aclytm1.1Welk/Mmjax) were purchased from The Jackson Laboratory, and NOD Scid gamma (NSG) mice (NOD.Cg-Prkdc<scid>Il2rg<tm1Wjl>/SzJ) were from Charles River Laboratories. Mice were maintained as described in supplemental Methods. All experiments were ethically approved (APAFIS number 25489-2019091313386161v3).
RNA sequencing of patient samples
Diagnostic peripheral blood or bone marrow samples from adult patients with T-ALL were analyzed after informed consent was obtained according to the Declaration of Helsinki. Patients were included in the GRAALL03/05 trials (registered at www.ClinicalTrials.gov identifiers: NCT00222027 [GRAALL-2003] and NCT00327678 [GRAALL-2005]). The screening of oncogenetic abnormalities and immuno-phenotype was performed as previously described.20
Total RNA extraction was performed using the RNeasy Mini Kit (Qiagen) and converted into complementary DNA using SuperScript III Reverse transcription (Thermo Fisher Scientific). Libraries were prepared using the SureSelect XT HS2 RNA System (Agilent) and sequenced on a NovaSeq (Illumina). Differential expression and pathway enrichment analyses were performed as previously described.20 For metabolic-specific analyses, the entire data set was reduced to metabolic genes as described.21 Analyses were performed on a subset of 4871 metabolic genes obtained from the Reactome Pathway database (ID R-HSA-1430728). PROGENy scores were computed on the entire transcriptome as previously reported.20,22
In vitro stable isotope tracing
Cells were seeded in Dulbecco modified Eagle's medium (DMEM) deprived of glucose and supplemented with 10% fetal bovine serum (FBS) and chased with 1 mM labeled [13C] glucose for 1, 4, or 24 hours. A total of 106 live cells per replicate were collected, washed twice in prechilled PBS (400g, 5 minutes, 15°C centrifugation), snap frozen, and stored at –80°C for further liquid chromatography–mass spectrometry (LC-MS)–based metabolomic analyses.
Metabolic analysis
Targeted LC-MS metabolomics analyses were conducted on a QExactive Plus Orbitrap mass spectrometer equipped with an Ion Max source and a HESI II probe coupled to a Dionex UltiMate 3000 uHPLC system (Thermo) as detailed in supplemental Methods. Intracellular cholesterol levels were quantified in 2 × 10⁶ viable PDX blasts using the Amplex Red Cholesterol Assay Kit (Invitrogen), according to the manufacturer's instructions.
Statistical analysis
Unless otherwise indicated, significance levels of data were determined by Student t test, analysis of variance, or nonparametric equivalent tests, depending on the normality of the data for the differences in mean values. Unless otherwise indicated, data are shown as average ± SE in at least 3 independent experiments, each including at least 2 per group. Asterisks in the figures refer to the following P values: ∗P <.05; ∗∗P <.01; ∗∗∗P <.001; ∗∗∗∗P <.0001.
Results
Pten deletion activates ACLY in preleukemic thymic cells
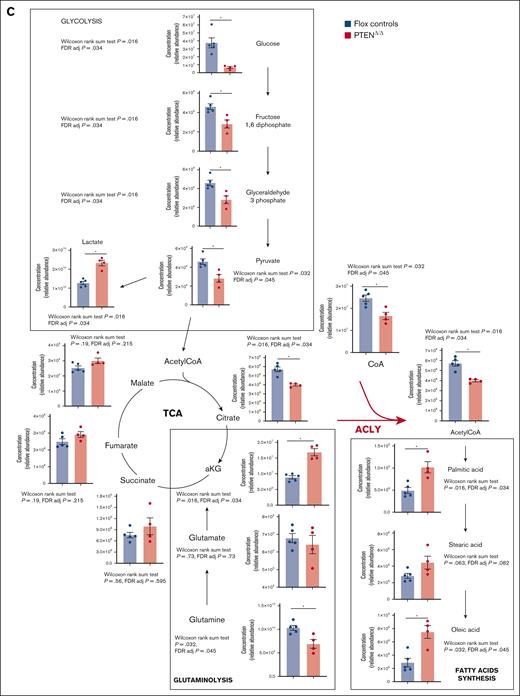
Because PTEN regulates cellular metabolism in distinct tissues, we hypothesized that PTEN loss could transform thymocytes by altering their cellular metabolism. To address this point, we used a CD4Cre;PTENflox2;ROSAYFPflox2 model, in which Pten deletion occurs in late double-negative (DN) thymic progenitors, and it can be monitored based on the expression of the yellow fluorescent protein (YFP) reporter. Using this model, which recapitulates PTEN loss–induced T-ALL/lymphoma development,1,23,24 we performed targeted metabolomic profiling of premalignant PTEN-mutant thymocytes (hereafter referred to as PTENΔ/Δ1,2,24; data not shown) and flox controls. Consistent with PTEN-mediated regulation of glycolysis,24,25 preleukemic mutant thymocytes showed decreased glucose and glycolytic intermediates (fructose 1,6 diphosphate, glyceraldehyde 3 phosphate, and pyruvate) and a parallel increase in lactate production (Figure 1A-D). Mutant cells also depicted a decrease in glutamine, which paralleled an increase in α-ketoglutarate. Interestingly, moreover, fatty acids such as palmitic and oleic acids were among the most upregulated metabolites in the mutant thymocyte cluster, whereas acetyl-CoA, the 2-carbon donor for fatty acid synthesis, was among the most downregulated metabolites. This was associated with a decrease in citrate and CoA (Figure 1B-D). These findings suggest that, at a preleukemic stage, PTEN-mutant cells might activate glycolysis, glutaminolysis, and de novo lipogenesis.26 At the crossroads of these metabolic pathways, there is the enzyme ACLY, which converts citrate into acetyl-CoA. Notably, ACLY is a direct target of AKT, which triggers its phosphorylation on serine 455, a posttranslational modification that increases the enzyme activity.15 Based on these data, we investigated whether ACLY is phosphorylated in PTEN-mutant thymocytes. As shown in Figure 1E, ACLY phosphorylation on ser455 was increased in premalignant PTEN-mutant thymocytes compared with their control counterpart. Taken together, these results indicate that Pten loss increases ACLY phosphorylation, consistent with increased activity, in premalignant thymocytes.
Metabolic analysis of preleukemic PTEN-mutant thymocytes. (A) Principal component analysis of 4 Pten-mutant and 5 Ptenflox2 thymi issued from preleukemic 8-week-old mice subjected to unsupervised metabolic analysis. (B-D) Heat maps of the 50 most deregulated metabolites (B), glycolytic intermediates, Krebs cycle intermediates, glutamine, glutamate, citrate, CoA, acetyl-CoA, and fatty acids (C), and pathway analysis in 4 preleukemic PTENΔ/Δ thymocytes or 5 flox control counterparts (D). (E) Phosphorylated ser455-ACLY in the thymi of preleukemic PTENΔ/Δ mutant or control animals in 3 independent experiments, with at least 2 per group. Adj, adjusted; aKG, α-ketoglutarate; CoA, coenzyme A; F1,6DP, fructose 1,6 diphosphate; FAS, fatty acid synthesis; FDR, false discovery rate; TCA, tricarboxylic acid.27
Metabolic analysis of preleukemic PTEN-mutant thymocytes. (A) Principal component analysis of 4 Pten-mutant and 5 Ptenflox2 thymi issued from preleukemic 8-week-old mice subjected to unsupervised metabolic analysis. (B-D) Heat maps of the 50 most deregulated metabolites (B), glycolytic intermediates, Krebs cycle intermediates, glutamine, glutamate, citrate, CoA, acetyl-CoA, and fatty acids (C), and pathway analysis in 4 preleukemic PTENΔ/Δ thymocytes or 5 flox control counterparts (D). (E) Phosphorylated ser455-ACLY in the thymi of preleukemic PTENΔ/Δ mutant or control animals in 3 independent experiments, with at least 2 per group. Adj, adjusted; aKG, α-ketoglutarate; CoA, coenzyme A; F1,6DP, fructose 1,6 diphosphate; FAS, fatty acid synthesis; FDR, false discovery rate; TCA, tricarboxylic acid.27
Genetic Acly ablation prevents PTEN loss–induced T-ALL/lymphoma development
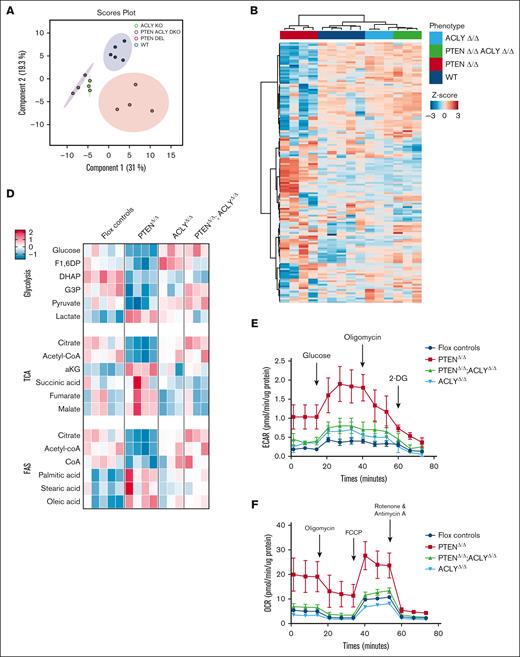
To investigate whether ACLY could promote PTEN loss–induced leukemogenesis, we genetically ablated Acly in PTEN-mutant mice using an Aclyflox2 model28 (supplemental Figure 1). Acly deletion in PTEN-mutant mice prevented PTEN loss–induced changes in all glycolytic intermediates (Figure 2A-E), and it restored wild-type levels of α-ketoglutarate, citrate, and palmitate (Figure 2C-D). Mice with deletion of both Pten and Acly (hereafter, PTENΔ/Δ;ACLYΔ/Δ) also showed increased levels of acetyl-CoA compared with PTEN mutants (Figure 2C-D), albeit this did not reach statistical significance when correction for multiple test hypothesis was applied. In line with this, the increased extracellular acidification rate and oxygen consumption rate occurring in double-positive (DP) thymic cells upon PTEN deletion was reversed in the absence of Acly (Figure 2E-F). Taken together, these data indicate that, at a premalignant stage, PTEN loss induces metabolic rewiring, which is reversed by Acly deletion. In addition, they suggest that the increased acetyl-CoA production driven by PTEN loss is unlikely to originate from increased glycolysis but rather from general metabolic rewiring, which occurs upon PTEN loss and renders the cells more dependent on ACLY activity.
Metabolic analysis of thymi from PTENΔ/Δ, ACLYΔ/Δ, PTENΔ/Δ;ACLYΔ/Δ or PTENflox2;ACLYflox2 mice. (A) Principal component analysis of 4 PTENΔ/Δ mutant, 3 ACLYΔ/Δ mutant, 3 PTENΔ/Δ;ACLYΔ/Δ, and 5 Ptenflox2;Aclyflox2 thymi from preleukemic 8-week-old mice undergoing unsupervised metabolic analysis. (B-D) Heat maps of the 50 most deregulated metabolites (B), analysis of glycolytic intermediates, Krebs cycle intermediates, glutamine, glutamate, citrate, CoA, acetyl-CoA and fatty acids (C), and pathway analysis in 4 PTENΔ/Δ mutant, 3 ACLYΔ/Δ mutant, 3 PTENΔ/Δ;ACLYΔ/Δ, and Ptenflox2;Aclyflox2 thymi (D). (E-F) Extracellular acidification rate (ECAR) (E) and oxygen consumption rate (OCR) (F) of sorted DP thymocytes in 2 independent experiments, with at least 2 per group. Adj, adjusted; aKG, α-ketoglutarate; F1,6DP, fructose 1,6 diphosphate; FAS, fatty acid synthesis; FCCP, carbonyl cyanide 4-(trifluoromethoxy)phenylhydrazone; FDR, false discovery rate; TCA, tricarboxylic acid cycle; WT, wild-type.
Metabolic analysis of thymi from PTENΔ/Δ, ACLYΔ/Δ, PTENΔ/Δ;ACLYΔ/Δ or PTENflox2;ACLYflox2 mice. (A) Principal component analysis of 4 PTENΔ/Δ mutant, 3 ACLYΔ/Δ mutant, 3 PTENΔ/Δ;ACLYΔ/Δ, and 5 Ptenflox2;Aclyflox2 thymi from preleukemic 8-week-old mice undergoing unsupervised metabolic analysis. (B-D) Heat maps of the 50 most deregulated metabolites (B), analysis of glycolytic intermediates, Krebs cycle intermediates, glutamine, glutamate, citrate, CoA, acetyl-CoA and fatty acids (C), and pathway analysis in 4 PTENΔ/Δ mutant, 3 ACLYΔ/Δ mutant, 3 PTENΔ/Δ;ACLYΔ/Δ, and Ptenflox2;Aclyflox2 thymi (D). (E-F) Extracellular acidification rate (ECAR) (E) and oxygen consumption rate (OCR) (F) of sorted DP thymocytes in 2 independent experiments, with at least 2 per group. Adj, adjusted; aKG, α-ketoglutarate; F1,6DP, fructose 1,6 diphosphate; FAS, fatty acid synthesis; FCCP, carbonyl cyanide 4-(trifluoromethoxy)phenylhydrazone; FDR, false discovery rate; TCA, tricarboxylic acid cycle; WT, wild-type.
In turn, the metabolic changes induced by ACLY deletion were accompanied by a significant impact on disease development. As expected, within 140 days, all PTENΔ/Δ mutant mice died of T-ALL/lymphoma (Figure 3A) and showed an accumulation of thymic cells bearing oligoclonal/monoclonal rearrangements of the T-cell receptor beta (TCRβ) receptor locus and a DP TCRαβ+ phenotype (Figure 3B-C). In line with previous findings, leukemic blasts predominantly showing a CD4 single-positive (SP4) phenotype accumulated in blood, lymph nodes, spleen, and bone marrow of PTEN-mutant mice (Figure 3D-F; data not shown).
Genetic Acly ablation prevents PTEN loss–induced T-ALL/lymphoma development. (A) Kaplan-Meier survival curve for PTENΔ/Δ mutant mice (n = 43), ACLY Δ/Δ mutant (n = 16), PTENΔ/Δ;ACLY Δ/Δ double-mutant mice (n = 22), and floxed controls (n = 40). (B-C) TCRβ rearrangements (B) and phenotypic analysis of the thymus (C) in PTENΔ/Δ mutant, ACLYΔ/Δ mutant, PTENΔ/Δ;ACLYΔ/Δ animals, or flox controls. (D-F) CD4+ absolute numbers cells in the spleen (D), bone marrow (E), and lymph nodes (F) in 14-week-old PTENΔ/Δ mutant, ACLYΔ/Δ mutant, PTENΔ/Δ;ACLYΔ/Δ animals, or flox controls (including Ptenflox2, Aclyflox2 and Ptenflox2;Aclyflox2 mice). BM, bone marrow.
Genetic Acly ablation prevents PTEN loss–induced T-ALL/lymphoma development. (A) Kaplan-Meier survival curve for PTENΔ/Δ mutant mice (n = 43), ACLY Δ/Δ mutant (n = 16), PTENΔ/Δ;ACLY Δ/Δ double-mutant mice (n = 22), and floxed controls (n = 40). (B-C) TCRβ rearrangements (B) and phenotypic analysis of the thymus (C) in PTENΔ/Δ mutant, ACLYΔ/Δ mutant, PTENΔ/Δ;ACLYΔ/Δ animals, or flox controls. (D-F) CD4+ absolute numbers cells in the spleen (D), bone marrow (E), and lymph nodes (F) in 14-week-old PTENΔ/Δ mutant, ACLYΔ/Δ mutant, PTENΔ/Δ;ACLYΔ/Δ animals, or flox controls (including Ptenflox2, Aclyflox2 and Ptenflox2;Aclyflox2 mice). BM, bone marrow.
Interestingly, however, only 30% of mice with deletion of both Pten and Acly (hereafter, PTENΔ/Δ;ACLYΔ/Δ) succumbed to an oligoclonal and infiltrating disease (Figure 3A; data not shown), developing with a significantly slower latency than PTEN mutants (Figure 3A; supplemental Figure 2A).
The metabolic profile of double-mutant mice developing the disease closely resembled the metabolic profile of PTEN mutants (supplemental Figure 2B). As such, in these animals, we did not observe a rescue of PTEN loss–induced decrease in acetyl-CoA levels, which occurred instead in nonleukemic double-mutant mice. (supplemental Figure 2C).
Strikingly, moreover, 70% of double-mutant mice survived >1 year without showing any signs of disease development. In these mice, leukemic cells were not observed in the peripheral organs or in the thymus (Figure 3D-F), in which normal polyclonal rearrangements of the TCRβ receptor locus were detected (Figure 3B-C). Compared with their age-matched control counterparts, moreover, 1-year-old PTENΔ/Δ;ACLYΔ/Δ mice presented a similar cellularity of lymphoid organs (supplemental Figure 3F-I) as well as a similar distribution of DP and SP (SP4 and SP8) thymic progenitors (supplemental Figure 3E). Acly deletion per se did not alter mice survival (Figure 3A), nor the cellularity of lymphoid organs (supplemental Figure 4A-D), nor the frequencies of CD4+CD8+TCRαβ+ cells (supplemental Figure 5A-D).
Taken collectively, these results demonstrate that ACLY plays a crucial role in PTEN loss–induced T-ALL development by promoting disease initiation.
ACLY promotes apoptosis resistance in preleukemic DP progenitors and it epigenetically regulates Bcl-2 expression
As previously shown, in PTEN-mutant mice, the disease originates from preleukemic DP cells, which are transformed into leukemia-initiating cells after the acquisition of additional oncogenic events.29,30 Because ACLY was required to initiate the disease in PTEN-mutant mice, we next addressed whether, on a mechanistic level, this could result from ACLY’s ability to promote apoptosis resistance in the cells of origin of the disease.
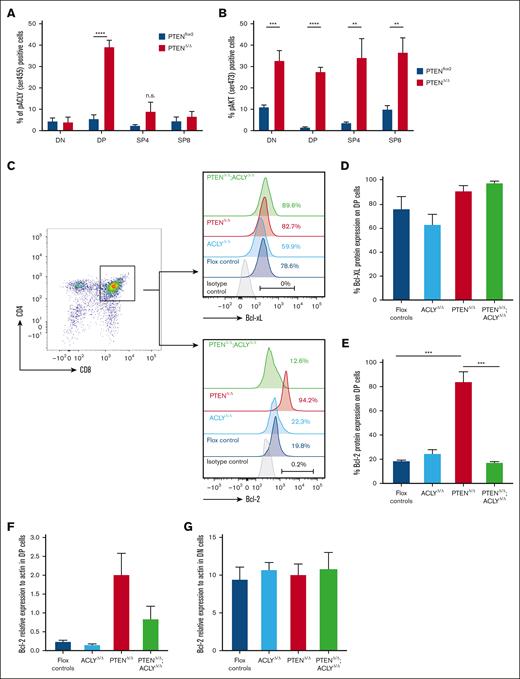
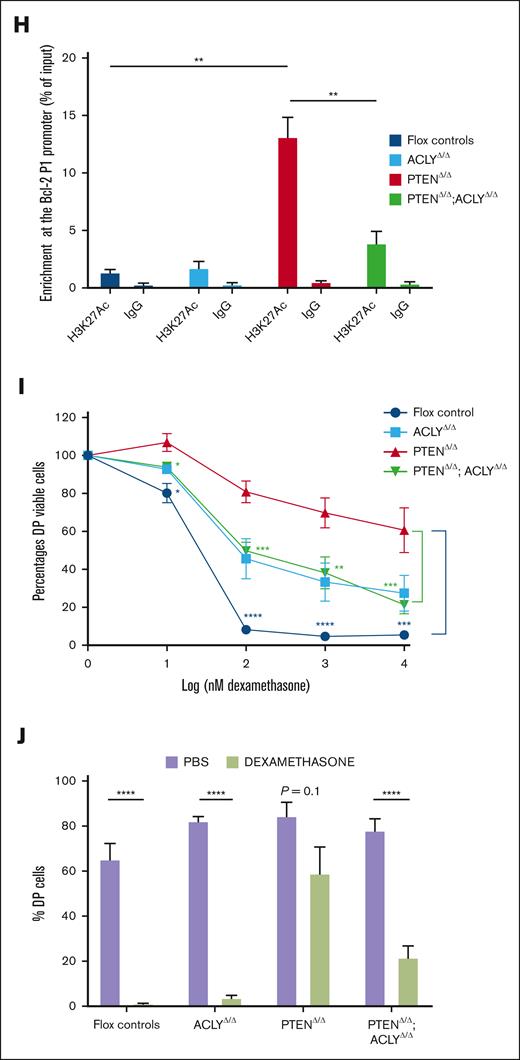
To investigate this hypothesis, we first analyzed whether ACLY activation selectively occurs in preleukemic PTEN-null DP cells. Despite PTEN ablation activating AKT in DN, DP, SP4, and SP8 thymic progenitors, a significant increase in phosphorylated ser455 ACLY levels was observed only in mutant DP cells (Figure 4A-B), thus demonstrating that PTEN loss activates ACLY exclusively in the cells of origin of the disease. We next analyzed whether ACLY activation in these cells modulates the expression of antiapoptotic proteins. As shown in Figure 4C-D, we did not observe significant differences in the expression of Bcl-XL, the main antiapoptotic protein in DP thymic cells.31,32 Yet, in these cells, which developmentally express very low BCL-2 during physiological conditions,33,34 PTEN loss induced a dramatic increase in BCL-2 expression. Interestingly, this was prevented by Acly deletion (Figure 4C-E). Because ACLY not only controls metabolic pathways but also epigenetically activates gene transcription, we next wondered whether ACLY-mediated BCL-2 regulation occurred on a transcriptional level. PTEN loss upregulated Bcl-2 transcripts, and this was instead abrogated in the absence of ACLY (Figure 4F). This ACLY-mediated transcriptional regulation of Bcl-2, moreover, specifically occurred in DP cells but not other thymic populations, such as DN cells, which physiologically express high BCL-2 levels (Figure 4G). In line with this, in PTEN mutants, we observed an increased H3K27 acetylation at the Bcl-2 main P1 promoter,35 which was instead reduced in double-mutant mice (Figure 4H).
Acly ablation abrogates apoptosis resistance in mutant DP progenitors. (A-B) Phospho ser473-AKT (A) and phospho ser455-ACLY (B) on DN, DP, SP4, and SP8 from preleukemic PTENΔ/Δ mutant or PTENflox2 controls. In mutant mice, carrying the ROSAYFPflox2 reporter, DN, DP, SP4, and SP8 cells are gated on YFP+ cells. Levels of BCL-XL (C-D) and BCL-2 (C,E) in DP cells from controls or mice lacking PTEN, ACLY, or both. (F-G) Bcl-2 relative expression to actin in DP cells (F) and DN (G) sorted from 4 PTENΔ/Δ mutant, 3 ACLYΔ/Δ mutant, 4 PTENΔ/Δ;ACLYΔ/Δ double-mutant mice, or 3 flox controls. (H) H3K27Ac enrichment at the Bcl-2 P1 promoter in 3 PTENΔ/Δ mutant, 3 ACLYΔ/Δ mutant, 3 PTENΔ/Δ;ACLYΔ/Δ double mutants, and flox controls. Data represent percentages of input normalized to the actin promoter. (I-J) Sensitivity of DP cells to dexamethasone ex vivo (I) or in vivo (2 mg/kg per day for 3 consecutive days) (J) in PTENΔ/Δ mutant, ACLYΔ/Δ mutant, PTENΔ/Δ;ACLYΔ/Δ animals or flox controls (including Ptenflox2, Aclyflox2, and Ptenflox2;Aclyflox2 mice). IgG, immunoglobulin G; n.s., not significant; PBS, phosphate-buffered saline.
Acly ablation abrogates apoptosis resistance in mutant DP progenitors. (A-B) Phospho ser473-AKT (A) and phospho ser455-ACLY (B) on DN, DP, SP4, and SP8 from preleukemic PTENΔ/Δ mutant or PTENflox2 controls. In mutant mice, carrying the ROSAYFPflox2 reporter, DN, DP, SP4, and SP8 cells are gated on YFP+ cells. Levels of BCL-XL (C-D) and BCL-2 (C,E) in DP cells from controls or mice lacking PTEN, ACLY, or both. (F-G) Bcl-2 relative expression to actin in DP cells (F) and DN (G) sorted from 4 PTENΔ/Δ mutant, 3 ACLYΔ/Δ mutant, 4 PTENΔ/Δ;ACLYΔ/Δ double-mutant mice, or 3 flox controls. (H) H3K27Ac enrichment at the Bcl-2 P1 promoter in 3 PTENΔ/Δ mutant, 3 ACLYΔ/Δ mutant, 3 PTENΔ/Δ;ACLYΔ/Δ double mutants, and flox controls. Data represent percentages of input normalized to the actin promoter. (I-J) Sensitivity of DP cells to dexamethasone ex vivo (I) or in vivo (2 mg/kg per day for 3 consecutive days) (J) in PTENΔ/Δ mutant, ACLYΔ/Δ mutant, PTENΔ/Δ;ACLYΔ/Δ animals or flox controls (including Ptenflox2, Aclyflox2, and Ptenflox2;Aclyflox2 mice). IgG, immunoglobulin G; n.s., not significant; PBS, phosphate-buffered saline.
These data, showing that ACLY is instrumental in epigenetically upregulating BCL-2 in preleukemic Pten-null DP cells, next prompted us to functionally examine whether its deletion prevents PTEN loss–induced resistance to apoptosis in these cells. Although DP cells sorted from PTEN mutants did not undergo apoptosis when treated ex vivo with dexamethasone, DP cells sorted from PTENΔ/Δ;ACLYΔ/Δ mice were highly sensitive to dexamethasone–induced apoptosis (Figure 4I). In line with this, Acly deletion in Pten-null mice reduced the in vivo dexamethasone resistance of preleukemic DP cells (Figure 4J). Taken together, these data indicate that ACLY activation upon PTEN loss promotes the resistance of preleukemic DP progenitors to apoptotic stimuli.
Human PTEN-null T-ALL cells modulate ACLY activity
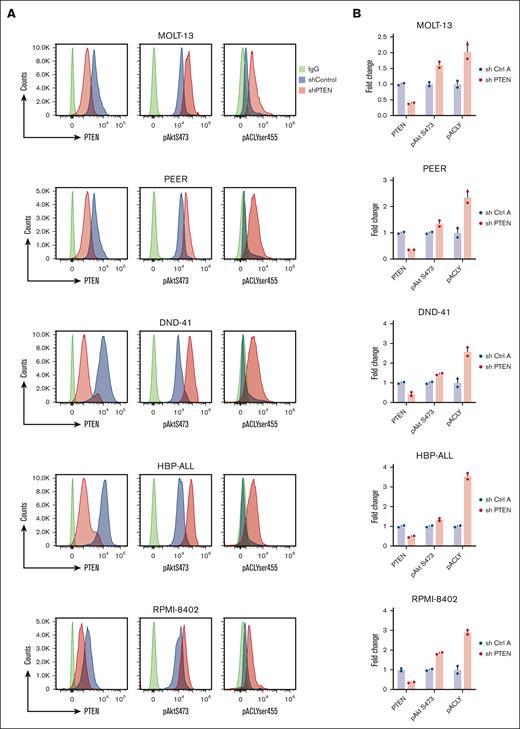
We next investigated whether our findings could be recapitulated in the human setting. To do so, we first investigated whether PTEN silencing in a panel of T-ALL PTEN germ line cell lines was able to activate ACLY. Therefore, we transduced 5 T-ALL cell lines, expressing distinct PTEN levels (Figure 5A), with a lentiviral vector carrying an short hairpin RNA (shRNA) PTEN or an shRNA control (hereafter shRNA Ctrl A). In these cells, PTEN silencing significantly increased ACLY phosphorylation on ser455 (Figure 5A-B) and acetyl-CoA levels (Figure 5C), consistent with an AKT1-mediated activation of the enzyme in these cells (Figure 5A-B). To further confirm that an increase in ACLY activity occurs after PTEN loss in dynamic settings, we performed stable isotope tracing assays. Given that glucose is a major carbon source contributing to the synthesis of ACLY’s substrate citrate, we analyzed [13C] glucose flux into acetyl-CoA. In the cell lines, the flux of [13C] glucose through glycolysis and the TCA cycle was comparable in all experimental conditions (Figure 5D-E). Compared with control cells, however, the acetyl-CoA isotopologue labeled from glucose (acetyl-CoA m+2) showed a more pronounced increase over time in cells deprived of PTEN. Moreover, its levels were decreased twofold when both PTEN and ACLY were silenced, thus indicating that PTEN silencing increases glucose flux into acetyl-CoA in an ACLY-dependent manner. Upon 4 hours of [13C] glucose incubation, acetyl-CoA m+2 levels increased in control cells, whereas they remained low in ACLY-silenced cells, in line with ACLY genetic silencing. Upon longer [13C] glucose incubation times (24 hours), albeit remaining lower than in control cells, acetyl-CoA m+2 levels showed an increase in ACLY-silenced cells, which may result from compensatory mechanisms intervening in the absence of ACLY during longer labeling times. Taken together, these evidences indicate that the increased levels of acetyl-CoA in PTEN-null cells are likely to be a direct consequence of an increased enzymatic conversion of citrate by ACLY rather than indirectly arising from a PTEN loss–induced increase in glycolytic flux.
PTEN loss activates ACLY in human T-ALL cells to sustain cell growth. (A-C) PTEN, pAKTser473, and pACLYser455 (A-B) and acetyl-CoA levels (C) in human T-ALL cell lines transduced with a lentiviral vector carrying an shRNA PTEN or a control shRNA (shRNA Ctrl A). (D-E) Relative abundance of unlabeled and labeled metabolites mapped to glycolysis (D) and TCA (E) in DND41 cells exposed to [13C] glucose for 1 hour, 4 hours, or 24 hours. (F) Growth of DND41, RPMI-8402, and HBP-ALL transduced with a shRNA PTEN, a shRNA ACLY, or the combination of both and relative control shRNA (shRNA Ctrl A as control for the shRNA targeting PTEN and shRNA Ctrl B as control for the shRNA targeting ACLY). (G) Growth of Jurkat cells transduced with an shRNA ACLY or control shRNA in the presence or in the absence of doxycycline (dox)–mediated PTEN re-expression. aKG, α-ketoglutarate; PBS, phosphate-buffered saline; TCA, tricarboxylic acid; Unlab, unlabeled.
PTEN loss activates ACLY in human T-ALL cells to sustain cell growth. (A-C) PTEN, pAKTser473, and pACLYser455 (A-B) and acetyl-CoA levels (C) in human T-ALL cell lines transduced with a lentiviral vector carrying an shRNA PTEN or a control shRNA (shRNA Ctrl A). (D-E) Relative abundance of unlabeled and labeled metabolites mapped to glycolysis (D) and TCA (E) in DND41 cells exposed to [13C] glucose for 1 hour, 4 hours, or 24 hours. (F) Growth of DND41, RPMI-8402, and HBP-ALL transduced with a shRNA PTEN, a shRNA ACLY, or the combination of both and relative control shRNA (shRNA Ctrl A as control for the shRNA targeting PTEN and shRNA Ctrl B as control for the shRNA targeting ACLY). (G) Growth of Jurkat cells transduced with an shRNA ACLY or control shRNA in the presence or in the absence of doxycycline (dox)–mediated PTEN re-expression. aKG, α-ketoglutarate; PBS, phosphate-buffered saline; TCA, tricarboxylic acid; Unlab, unlabeled.
In line with this, ACLY targeting by a shRNA (supplemental Figure 6A) prevented the growth of 3 cells lines tested but only when PTEN was also silenced (Figure 5F). This suggests that only cells deprived of PTEN cells are specifically vulnerable to ACLY inhibition.
To further exclude off-target effects, we next silenced ACLY in a PTEN-null Jurkat line, engineered to re-express PTEN after doxycycline exposure (supplemental Figure 6B).36ACLY silencing reduced cell proliferation of these Jurkat cells, but it did not once PTEN was re-expressed (Figure 5F). Furthermore, reintroducing ACLY (supplemental Figure 7A) in cell lines deprived of PTEN and ACLY rescued cell growth defects in all cell lines tested (supplemental Figure 7B-E), thus excluding off-target effects due to an shRNA-mediated ACLY silencing.
Because ACLY regulates BCL-2 levels and apoptotic resistance during disease initiation, we next functionally explored whether ACLY regulates BCL-2 dependency in human T-ALL cell lines. To this end, we examined the sensitivity of T-ALL cell lines lacking PTEN, ACLY, or both to the BCL-2 inhibitor venetoclax. In addition, since mature T-ALL cells, such as those lacking PTEN,5 are more dependent on BCL-XL than BCL-2,37 we also examined sensitivity to the BCL-XL inhibitor navitoclax. ACLY targeting did not affect steroid resistance nor the sensitivity of PTEN-null T-ALL cells to venetoclax and navitoclax (supplemental Figure 8A-G), thus indicating that ACLY-mediated BCL-2 regulation is dispensable once the leukemia is already developed, whereas it is instead required during transformation.
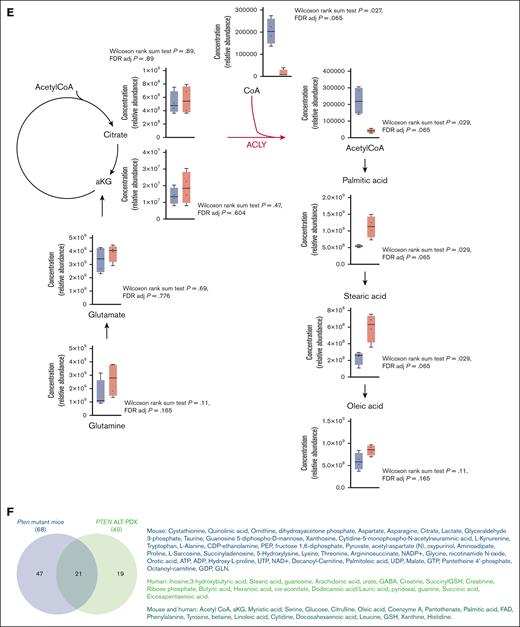
To further translate our results to the patient setting, we performed a metabolic analysis of 8 PDXs. This included 3 patients with PTEN abnormalities, 1 patient with PI3KCA mutations, and 4 patients with a germ line status for PTEN, PI3KCA, PI3KR1, and AKT1 (Table 1). Consistent with the reported genomic alterations, with the exception of 1 PTEN-altered case, PTEN/PI3KCA-altered patients displayed significantly higher phosphorylated AKT (ser347) levels (Table 1). This mirrored the clustering identified by principal component analysis (Figure 6A). Patients bearing genomic abnormalities in the PI3K/PTEN pathway displayed lower levels of CoA and acetyl-CoA (Figure 6B-C,E) and a parallel increase in palmitic acid and stearic acid (Figure 6E). Albeit, after correction for multiple testing hypothesis, the changes in these metabolites lost statistical significance (Wilcoxon sum rank test P = .029; P adjusted = .065), the trend observed for these metabolites in PTEN-altered PDX parallels the data observed in the murine model. Acetyl-CoA, CoA, and palmitic acid were, for instance, among the 21 metabolites mostly changed both in PTEN-mutant mice and PTEN-altered PDX (Figure 6F). Enrichment analyses revealed the prevalence of transfer RNA synthesis, amino acids, and unsaturated fatty acids, consistent with acetyl-CoA consumption (Figure 6D; supplemental Figure 9A-C). Hence, our results suggest that PTEN loss of function shifts blast metabolism toward fatty acid synthesis by modulating ACLY. To further investigate this aspect, we performed a transcriptomic analysis of 155 primary T-ALL samples by RNA sequencing. Differential expression analysis of 4871 metabolic genes revealed that most of the PTEN-altered cases formed a cluster (Figure 6G). In line with our metabolomic analysis, the overrepresentation analysis of deregulated metabolic genes in PTEN-altered cases revealed an upregulation of fatty acid synthesis and long-chain fatty acyl-CoA ester synthesis, as well as a downregulation of CoA synthesis (Figure 6H). We next stratified primary samples based on inferred PI3K activity as determined by PROGENy. This analysis confirmed that elevated PI3K signaling is associated with the upregulation of fatty acid synthesis and the TCA cycle (Figure 6I-K). A strong PI3K activity also correlated with enrichment in a cholesterol signature (Figure 6L), and increased cholesterol synthesis was observed in PTEN-altered PDX-derived blasts (Figure 6M). Taken together, these analyses demonstrated that ACLY activation is at the center of a crucial metabolic rewiring induced by PTEN loss in T-ALL cells, which is likely to provide the fatty acids and cholesterol necessary for their growth.
PTEN, PI3K3A, PI3R1, AKT1 status, and phospho-AKT levels in 8 PDXs that underwent metabolomic analysis
| PDX . | PTEN . | PIK3CA . | PIK3R1 . | AKT1 . | pAKT levels (geo mean from FACS analysis) . |
|---|---|---|---|---|---|
| UPN 663 | p.R233WA biallelic | GL | GL | GL | 15,1 |
| UPN 534 | Type I monoallelic deletion | GL | GL | GL | 14,7 |
| UPN 374 | GL | c.1624G>A biallelic | GL | GL | 19,4 |
| UPN 519 | p.R233SfsX14 biallelic | GL | GL | GL | 24,5 |
| UPN 584 | GL | GL | GL | GL | 0 |
| UPN 567 | GL | GL | GL | GL | 0 |
| UPN 613 | GL | GL | GL | GL | 934 |
| UPN 610 | GL | GL | GL | GL | 1,7 |
FACS, fluorescence activted cell sorting; GL, germ line; pAKT, phosphorylated AKT; phospho, phosphorylated.
Targeted metabolic and transcriptomic analysis of patients-derived T-ALL cells. (A) Principal component analysis of 8 PDXs undergoing targeted metabolomic analysis. (B) Most upregulated and downregulated metabolites in PTEN-altered cases. (C-D) Heat maps of the most 50 deregulated metabolites (C) and pathways enriched in PTEN-altered patients (D). (E) Metabolic analysis of citrate, CoA, acetyl-CoA, glutamine, glutamate, α-ketoglutarate, palmitic acid, stearic acid, and oleic acid in the 8 PDXs shown in panel A. (F) Venn diagram for metabolites mostly changed in both PTEN-mutant mice and PTEN-altered PDX (P < .05). (G) Metabolic transcriptome-based clustering of 155 patients. (H) Pathway enrichment analyses based on the differential metabolic gene expression of PTEN-altered (n = 33) vs wild-type (WT; n = 122) patients determined using EnrichR. (I) PROGENy score computation from whole transcriptomics data from 155 patients. The median score of the series was used to stratify patients into high- and low-score groups. (J) Volcano plot depicting differentially expressed metabolic genes in high vs low PI3K score. (K-L) Enriched metabolic gene sets enrichment in high vs low PI3K score as determined by GSEA. (M) Intracellular levels of cholesterol in WT or altered PI3K signaling T-ALL PDX blasts. Adj, adjusted; ADP, adenosine diphosphate; ALT, altered; CDP, cytidine diphosphate; FDR, false discovery rate; GSEA, gene set enrichement analysis; GDP, guanosine diphosphate; GTP, guanosine triphosphate; ns, not significant; PIP, phosphatidylinositol; tRNA, transfer RNA; UDP, uridine diphosphate.
Targeted metabolic and transcriptomic analysis of patients-derived T-ALL cells. (A) Principal component analysis of 8 PDXs undergoing targeted metabolomic analysis. (B) Most upregulated and downregulated metabolites in PTEN-altered cases. (C-D) Heat maps of the most 50 deregulated metabolites (C) and pathways enriched in PTEN-altered patients (D). (E) Metabolic analysis of citrate, CoA, acetyl-CoA, glutamine, glutamate, α-ketoglutarate, palmitic acid, stearic acid, and oleic acid in the 8 PDXs shown in panel A. (F) Venn diagram for metabolites mostly changed in both PTEN-mutant mice and PTEN-altered PDX (P < .05). (G) Metabolic transcriptome-based clustering of 155 patients. (H) Pathway enrichment analyses based on the differential metabolic gene expression of PTEN-altered (n = 33) vs wild-type (WT; n = 122) patients determined using EnrichR. (I) PROGENy score computation from whole transcriptomics data from 155 patients. The median score of the series was used to stratify patients into high- and low-score groups. (J) Volcano plot depicting differentially expressed metabolic genes in high vs low PI3K score. (K-L) Enriched metabolic gene sets enrichment in high vs low PI3K score as determined by GSEA. (M) Intracellular levels of cholesterol in WT or altered PI3K signaling T-ALL PDX blasts. Adj, adjusted; ADP, adenosine diphosphate; ALT, altered; CDP, cytidine diphosphate; FDR, false discovery rate; GSEA, gene set enrichement analysis; GDP, guanosine diphosphate; GTP, guanosine triphosphate; ns, not significant; PIP, phosphatidylinositol; tRNA, transfer RNA; UDP, uridine diphosphate.
PTEN-altered T-ALL cells are sensitive to ACLY targeting
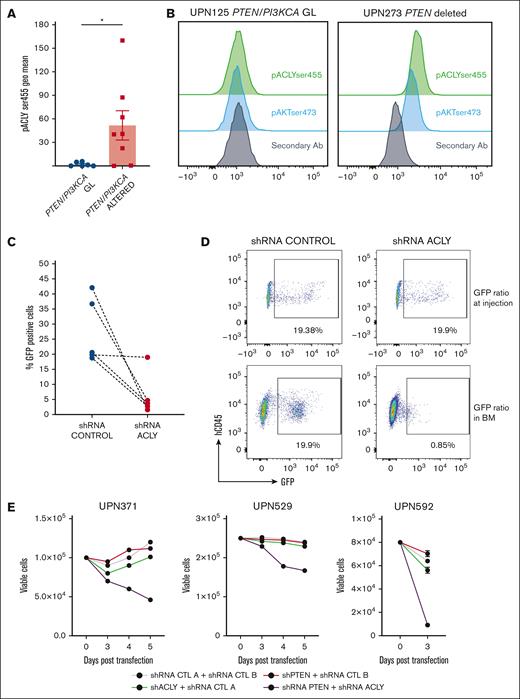
To further corroborate our findings, we next analyzed phosphorylated ser455 ACLY levels in additional 14 PDX T-ALL blasts bearing PTEN/PI3KCA alterations and showing active AKT signaling. These patients displayed higher ACLY phosphorylation, consistent with AKT1-mediated activation of ACLY (Figure 7A-B). Based on this, we next silenced ACLY in 5 different PDX blasts by transducing these cells with a baboon-pseudotyped lentiviral vector carrying an ACLY shRNA or a control shRNA.30 Remarkably, in 4 of the 5 PTEN-altered PDXs that we analyzed, ACLY silencing reduced their in vitro viability already 48 hours after transduction.38 As shown in Figure 7C, at this time point already, a few viable GFP-positive cells were left among those transduced with the shRNA ACLY-carrying vector. In the fifth PDX sample, ACLY targeting did not affect the cellular viability ex vivo, prompting us to examine its effect in vivo. We performed, therefore, a competitive transplantation assay, in which transduced cells were allowed to compete with nontransduced cells in a 20:80 ratio after their injection into NSG mice. PDX blasts lacking ACLY were outcompeted by nontransduced cells, whereas GFP control cells were not (Figure 7D). We next investigated whether ACLY represents a metabolic vulnerability specific to PTEN-altered T-ALL cases. We thus genetically silenced either PTEN, ACLY, or both in cells derived from 3 distinct PDXs displaying a germ line PTEN status. Although we could technically only evaluate 3 PDXs, we observed a similar trend in the 3 cases analyzed, which displayed a reduction in the number of viable cells when ACLY was silenced in combination with PTEN (Figure 7E). Taken together, these results indicate that ACLY promotes the survival of PTEN-altered T-ALL cells, in which it represents a metabolic vulnerability.
ACLY silencing in primary PTEN-null T-ALL cells affects their viability. (A) pACLYser455 levels in 8 PTEN/PI3KCA altered and 6 WT PDX T-ALL blasts. (B) Representative FACS plot depicting pAktser473 and pACLYser455 in a PTEN/PI3KCA WT patient or a PTEN-deleted patient. (C) Percentages of GFP+PTEN–altered PDX blasts remaining viable 48 hours after transduction with lentivirus vectors carrying shRNA ACLY or a control construct. (D) Competitive transplantation assay, in which PDX cells transduced with a shRNA ACLY or a shRNA control competed with nontransduced cells in a 20:80 ratio following injection into NSG mice. The relative ratio of transduced and not transduced cells found in the bone marrow of NSG mice is shown. (E) Number of GFP+PTEN germ line PDX blasts remaining viable 3, 4, or 5 days after transduction. BM, bone marrow; FACS, fluorescence-activated cell sorting; GFP, green fluorescent protein.
ACLY silencing in primary PTEN-null T-ALL cells affects their viability. (A) pACLYser455 levels in 8 PTEN/PI3KCA altered and 6 WT PDX T-ALL blasts. (B) Representative FACS plot depicting pAktser473 and pACLYser455 in a PTEN/PI3KCA WT patient or a PTEN-deleted patient. (C) Percentages of GFP+PTEN–altered PDX blasts remaining viable 48 hours after transduction with lentivirus vectors carrying shRNA ACLY or a control construct. (D) Competitive transplantation assay, in which PDX cells transduced with a shRNA ACLY or a shRNA control competed with nontransduced cells in a 20:80 ratio following injection into NSG mice. The relative ratio of transduced and not transduced cells found in the bone marrow of NSG mice is shown. (E) Number of GFP+PTEN germ line PDX blasts remaining viable 3, 4, or 5 days after transduction. BM, bone marrow; FACS, fluorescence-activated cell sorting; GFP, green fluorescent protein.
Discussion
We demonstrated that ACLY is a metabolic player not only required for the oncogenic transformation of thymic T-cell progenitors but also for maintaining an established human T-ALL, in which it represents an important metabolic vulnerability.
Combining metabolomics and a murine T-ALL/lymphoma model, we showed that PTEN loss selectively activates ACLY in premalignant DP thymocytes, and this is instrumental in driving disease initiation. From a mechanistic point of view, we show that this arises, at least in part, from an ACLY-mediated regulation of apoptosis resistance in these cells, which are the cells of origin of the disease in Pten conditional murine models.29,30 Although during physiological T-cell development, DP progenitors downregulate BCL-2 in favor of BCL-XL, we show that, in preleukemic conditions, PTEN loss does not affect BCL-XL expression, but it rather induces supraphysiological levels of BCL-2, and this occurs via ACLY activation. Mechanistically, we show that, in these cells, ACLY regulates Bcl-2 on a transcriptional level by acetylating the main Bcl-2 P1 promoter.35 Given that PTEN loss–induced leukemogenesis in the mouse is a multiple-hit process,29 our data support a model in which ACLY-mediated apoptosis resistance via BCL-2 upregulation favors the selection of premalignant DP, thereby enabling them to undergo additional multiple oncogenic events, which fully transform these cells. In this context, it is worth noticing that, despite ACLY being required for the growth of fully established leukemias, in already transformed cells, ACLY does not functionally regulate BCL-2 or apoptotic resistance. These evidences, which indicate that ACLY-mediated BCL-2 upregulation occurs only during leukemia ontogeny, further strengthen its role during transformation. Along the same line, albeit during physiological conditions, ACLY regulates apoptosis in thymic DP cells; in this context, it operates via a BCL-2–independent mechanism (Andrieu G, Hypolite G, Latiri M and Tesio M, unpublished data, May 2021). This further argues in favor of a specific requirement for ACLY-mediated BCL-2 upregulation during leukemic ontogeny in the absence of PTEN. Taken together, these findings provide at least 1 possible mechanism underlying the survival of PTEN ACLY double mutants. Yet, given the striking survival rate of these animals, it is likely that multiple additional mechanisms intervene in this context. Further studies will thus be necessary to fully elucidate these aspects.
As our translational investigations point out, ACLY’s role in T-ALL development relates not only to the oncogenic transformation of immature thymic progenitors but also to the maintenance of an established leukemia, which remains dependent on ACLY activity even after transformation.
In this context, ACLY’s anabolic functions are likely to play an important role because, in PTEN/PI3K-altered cells, metabolic, genetic, and transcriptomic profiling of human T-ALL cells indicates an increased need for ACLY to supply acetyl-CoA for fatty acid and cholesterol biosynthesis. These findings, which recapitulate the results obtained with the murine model, are in line with previous data highlighting a role for cholesterol biosynthesis in the growth of immature Early T-cell precursor acute lymphoblastic leukemia (ETP-ALL) cells.21 Consistent with its activation in PTEN-altered patients, ACLY sustains the growth of T-ALL cells that underwent PTEN loss. As evidenced in both cell lines and primary T-ALL, T-ALL cells deprived of PTEN were sensitive to ACLY silencing.
Highlighting a metabolic vulnerability linked to PTEN/PI3K genetic alterations, our data suggest that high-risk patients with T-ALL bearing these abnormalities may benefit from pharmacological ACLY targeting. Although ACLY inhibitors have been under development, the only US Food and Drug Administration–approved ACLY inhibitor (bempedoic acid) also stimulates AMP-activated protein kinase (AMPK) activity and thus lacks selectivity. Conversely, the ACLY inhibitors that showed good specificity did not reach clinical studies, as in the case of SB-204490; a poor tissue-specific distribution in humans has limited them.39 In light of this, our results hold the promises of boosting the development of novel specific ACLY inhibitors suitable for clinical intervention.
In conclusion, our study revealed that PTEN loss defines a metabolic rewiring in T-ALL cells, in which ACLY is a major player favoring not only the transformation of thymic progenitor cells but also the growth of established human leukemias. Primary T-ALL cell dependency on ACLY activity thus represents a novel metabolic vulnerability with therapeutic potential.
Acknowledgments
The authors thank Ludovic Lhermitte for critically reading the manuscript and the animal facility technicians for animal husbandry.
This work has been supported by a grant from Fondation de France and a grant (PJA 20181207696 and PDF20150602958) from Association Recherche sur le cancer (M.T.).
Authorship
Contribution: G.P.A. contributed to methodology, investigation, analysis, validation, data curation, and writing of the original draft; G.H., M.L., provided investigation and analysis; E.B., C.C., E.V., D.H., L.G., and M.C. provided resources; O.A. provided biostatistical analysis; I.N. provided metabolic investigations; G.P. provided resources and writing (reviewing and editing); K.W. and E.M. provided resources; V.A. contributed to methodology, validation, resources, data curation, writing supervision, and funding acquisition; and M.T. contributed to conceptualization, methodology, validation, resources, data curation, writing supervision, project administration, and funding acquisition.
Conflict-of-interest disclosure: The authors declare no competing financial interests.
Correspondence: Vahid Asnafi, Laboratory of Onco-Hematology, Assistance Publique-Hôpitaux de Paris, Hôpital Necker Enfants Malades, Tour Pasteur, 149 rue de Sèvres, 75015 Paris, France; email: vahid.asnafi@aphp.fr; and Melania Tesio, Laboratory Lymphoma-Immune Biology, Facultè de Medicine Lyon-Sud BP-1, 165 Chemin du Grand Revoyet, 69600 Oullins, France; email: melania.tesio@inserm.fr.
References
Author notes
Original data are available on request from the corresponding authors, Melania Tesio (melania.tesio@inserm.fr) and Vahid Asnafi (vahid.asnafi@aphp.fr).
The full-text version of this article contains a data supplement.





![PTEN loss activates ACLY in human T-ALL cells to sustain cell growth. (A-C) PTEN, pAKTser473, and pACLYser455 (A-B) and acetyl-CoA levels (C) in human T-ALL cell lines transduced with a lentiviral vector carrying an shRNA PTEN or a control shRNA (shRNA Ctrl A). (D-E) Relative abundance of unlabeled and labeled metabolites mapped to glycolysis (D) and TCA (E) in DND41 cells exposed to [13C] glucose for 1 hour, 4 hours, or 24 hours. (F) Growth of DND41, RPMI-8402, and HBP-ALL transduced with a shRNA PTEN, a shRNA ACLY, or the combination of both and relative control shRNA (shRNA Ctrl A as control for the shRNA targeting PTEN and shRNA Ctrl B as control for the shRNA targeting ACLY). (G) Growth of Jurkat cells transduced with an shRNA ACLY or control shRNA in the presence or in the absence of doxycycline (dox)–mediated PTEN re-expression. aKG, α-ketoglutarate; PBS, phosphate-buffered saline; TCA, tricarboxylic acid; Unlab, unlabeled.](https://ash.silverchair-cdn.com/ash/content_public/journal/bloodadvances/9/7/10.1182_bloodadvances.2024013762/2/m_blooda_adv-2024-013762-gr5fg.jpeg?Expires=1765885299&Signature=ViM3jmsNr1VRzBsmIvUoHHtCYvC57LsLSnqK2Hjhjy3j0wQKWGB~dTJWHqj5u~qHk0NOWNenLSoQHnzqf2rpHlT7HYyaFUwpdWRll9wx43J5Ww0~ADAl0A-R9rMRD9eNaz1eHRgPitBaVcaAFv5prOsSx7WS8Cf1ZzlNexYbhSG5IbZDap89XFu0ASvfG6xatPsvIje7Xj3InQPN815OnDuzggh3oaVicl3r2ZlcgbhYWL8f2EULURUT84mbb0OrefyUJTsGxv-4hr3tyzCTb14SF1YnPBmtdiXgNtjgvOI9jFNB5ZAeQW1YsQc~M386EIdPVPg-j19kOe48geJmww__&Key-Pair-Id=APKAIE5G5CRDK6RD3PGA)

