Visual Abstract
In this study, we first analyzed data from 147 patients with solitary plasmacytomas treated at the Mayo Clinic between 2005 and 2022 and then expanded our investigation through a systematic review and meta-analysis of 62 studies, encompassing 3487 patients from the years 1960 to 2022. Our findings reveal that patients with up to 10% clonal plasma cells in their bone marrow (BM), denoted as plasmacytoma +, had a significantly reduced median disease-free survival (DFS) of 15.7 months vs 79 months, P < .05, observed in patients with true solitary plasmacytomas, with no clonal cells in the BM. Risk factors identified for shorter DFS included the presence of clonal plasma cells in the marrow and a difference between involved and uninvolved free light chains of >5 mg/dL. The meta-analysis portion of our study highlighted a male predominance among patients, with a median age of 58 years, and confirmed radiation therapy as the predominant treatment modality. We also found that DFS rates at 3, 5, and 10 years were 66.9%, 55%, and 42.1%, respectively, and noted a significant difference in outcomes between patients with bone and extramedullary plasmacytomas, with the latter group exhibiting better survival rates. This dual-faceted approach provides a thorough overview of survival rates and critical risk factors for patients with plasmacytoma, underscoring the vital role of accurate disease staging at diagnosis and the impact of tumor location on patient prognosis.
Introduction
Solitary plasmacytomas are rare plasma cell neoplasms located either in bone (solitary bone plasmacytomas [SBPs]) or extramedullary (solitary extramedullary plasmacytomas [SEPs]) sites and comprise ∼6% of all plasma cell disorders.1,2 The current definition of plasmacytomas defines discrete entities based on the presence of clonal plasma cells in the bone marrow (BM), and patients with solitary plasmacytomas and minimal (up to 10%) involvement are termed plasmacytoma (+), given the higher risk of progression to multiple myeloma (MM) than patients with true solitary plasmacytomas.3 The treatment for both is localized radiation therapy with or without surgery and regular follow-up for MM progression.4 Although previous studies have looked at the clinical outcomes of these patients, they are primarily restricted by the small cohorts and the lack of sufficient power to detect robust differences between groups (eg, SBPs vs SEPs). In addition, there is a lack of data on the survival outcomes of patients with no plasma cells in the BM and patients who are plasmacytoma (+), as well as other specific risk factors that affect progression.5
In the first part of our study, we retrospectively evaluated a recent cohort of patients with plasmacytoma seen in our institution. We compared the baseline characteristics and clinical outcomes of patients with plasmacytoma based on the presence of clonal plasma cells in the BM and their location (bone vs extramedullary) and identified risk factors for an earlier time to progression. In the second part, we performed a meta-analysis of all published survival outcomes of patients with plasmacytoma to better understand the natural history of the disease in a large cohort of patients and then compared the disease-free survival (DFS) and overall survival (OS) rates of patients with SBPs and SEPs.
Methods
Mayo Clinic cohort
The retrospective cohort included consecutive patients seen at the Mayo Clinic, Rochester, MN, with either true solitary plasmacytoma or plasmacytoma (+) according to the International Myeloma Working Group criteria.3 Only patients diagnosed between 1 January 2005 and 30 June 2022, were included. Patients with MM, smoldering myeloma, and amyloidosis were excluded. Additionally, patients without histologic confirmation of plasmacytoma or patients without BM examination for clonal plasma cells were excluded. Bone involvement was based on the trephine biopsy in all cases. Approval for this study was obtained from the Mayo Clinic institutional review board, and informed consent was granted from all patients for review of their electronic medical records. DFS was measured from plasmacytoma diagnosis to solitary recurrence or progression to MM. Multiple myeloma-free survival (MMFS) was calculated from plasmacytoma diagnosis to progression to MM, and OS was calculated until death from any cause.
Search strategy and selection criteria for meta-analysis
We searched the electronic databases from 1 January 1960 to 1 September 2022. We identified all studies regarding plasmacytoma in the following databases: MEDLINE, ClinicalTrials.gov, Embase, PubMed, Google Scholar, Ovid, and International Standard Randomized Controlled Trial Number registry. The search strategies were developed using the keyword “plasmacytoma,” and we included all retrospective or prospective studies that reported on clinical outcomes of patients with solitary plasmacytomas.
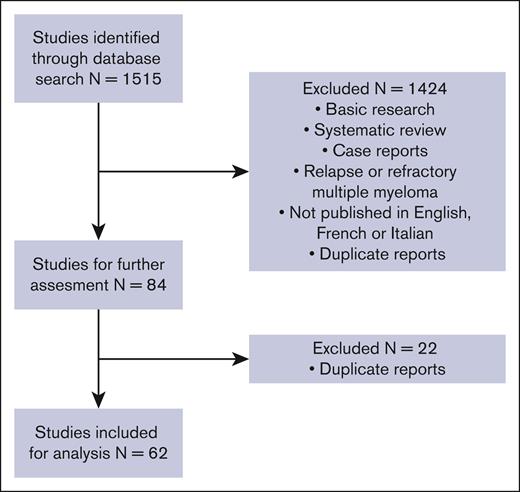
We identified 1515 references from the initial database search and kept 84 studies for further review after initial screening. The time period for the studies included in the meta-analysis was from 1989 to 2022. Only publications in English, French, and Italian were included. Basic research studies, database studies, review articles, case reports, and meta-analyses were excluded. We also excluded studies that included participants with relapsed or refractory myeloma, studies that reported insufficient data, and studies with <15 participants.
We extracted data on the following primary outcomes: DFS and OS for all patients and then for different subgroups based on the plasmacytoma location. Disease outcomes were extracted from the main text/tables when available and from Kaplan-Meier curves when not.
Selection criteria
The search strategy was developed by 2 reviewers (C.C. and J.-S.C.) who screened the titles and abstracts and created a shortlist of studies for further evaluation. If a decision on inclusion was not made on the basis of the review of the title and abstract, we obtained the full text of the article to assess eligibility. Disagreements in the selection of studies were resolved through mutual discussion and consensus with a third author (S.K.K.). At every stage of searching and screening, the overall numbers of studies identified, excluded, and included with reasons, were documented according to the preferred reporting items for systematic reviews and meta-analyses guidelines.6 This information was used to create a flowchart diagram (Figure 1).
Flowchart regarding studies included in our meta-analysis and systematic review.
Flowchart regarding studies included in our meta-analysis and systematic review.
Data extraction and management
Data were extracted from each study by 1 reviewer and verified by a second reviewer. After the extraction, a third author (S.K.K.) reviewed all data. The outcomes extracted have been described earlier. We also extracted details regarding participants’ age, median plasmacytoma size, treatment, radiotherapy, length of follow-up, and plasmacytoma location (SBP vs SEP).
Assessment of heterogeneity
The degree of heterogeneity among studies and subgroups was evaluated using the I2 statistic. We used the following guide to interpret the I2 statistic: I2 = 0% to 30% (heterogeneity that might not be important), I2 = 30% to 75% (moderate heterogeneity), and I2 = 75% to 100% (considerable heterogeneity).7
Sensitivity analysis
We conducted sensitivity analyses according to methodological quality dimensions to assess potential bias in our results.8 Sensitivity analysis was performed by repeating the meta-analysis, excluding each individual study 1 at a time.
Statistical analysis
Forest plots were constructed for each meta-analysis to examine and display study-level data. Analysis was conducted with R (version 4.1.2) using the random-effects model.9 All statistical analyses were 2-sided. A P value <.05 was considered statistically significant, except for the aforementioned heterogeneity analysis.
Results
Mayo Clinic cohort
A total of 147 patients met our inclusion criteria, 75 patients had a solitary plasmacytoma, and 72 had plasmacytoma (+). Regarding the location, 133 (90.5%) plasmacytomas were located in the bone, and the remaining 14 (9.5%) were found in extramedullary sites. Of those located in the bone, 95 (64.6%) were seen in the axial skeleton, whereas 38 (25.9%) were seen in the appendicular skeleton. For the whole cohort, the median age at diagnosis was 60.7 years, and patients with plasmacytoma (+) were older than patients with no plasma cells in the BM (63.5 vs 56.2 years, respectively; P < .05). Only 9 patients had clonal plasma cells on BM examination and no plasma cells on BM trephine. Positivity of serum immunofixation was found in 104 patients (77.6%), and most of the patients with plasmacytoma (+) were positive for a monoclonal component in the serum (86.2% vs 69.6%, respectively; P < .05). The presence of M-protein was also more likely in the plasmacytoma (+) cohort (70.6% vs 54.2%, respectively; P < .016). The range of solitary plasmacytoma was 0.3 to 14.0 cm. Interestingly, there was no statistically significant difference in the urine immunofixation positivity for patients with plasmacytoma (+) compared with true solitary plasmacytoma (66% vs 53.7%, respectively; P = .262). The baseline disease characteristics for the whole cohort and a comparison based on the presence of clonal cells in BM are shown in Table 1. Most of our cohort (92.5%) was evaluated with either positron emission tomography-computed tomography (PET-CT), magnetic resonance imaging (MRI), or a CT scan to determine whether the lesion was solitary. Few patients (7.5%) were included with only a bone survey/bone scan and a confirmatory bone biopsy of the suspected lesion when advanced plasmacytoma imaging was not available.
Baseline characteristics in patients with newly diagnosed plasmacytoma (+) vs true solitary plasmacytoma in our Mayo Clinic cohort
| . | Plasmacytoma (+) (n = 72) . | Solitary plasmacytoma (n = 75) . | Total (N = 147) . | P value . |
|---|---|---|---|---|
| Age, y | .009 | |||
| Median (range) | 63.5 (28.7-83.6) | 56.2 (15.4-82.1) | 60.7 (15.4-83.6) | |
| M-spike, g/dL | .045 | |||
| Not present | 20 (29.4%) | 33 (45.8%) | 53 (37.9%) | |
| Present | 48 (70.6%) | 39 (54.2%) | 87 (62.1%) | |
| Immunoparesis | .184 | |||
| No | 43 (74.1%) | 48 (84.2%) | 91 (79.1%) | |
| Yes | 15 (25.9%) | 9 (15.8%) | 24 (20.9%) | |
| Hemoglobin, g/dL | .533 | |||
| Median (range) | 13.8 (9.6-16.9) | 13.9 (10.5-18.2) | 13.8 (9.6-18.2) | |
| Involved-uninvolved light chain, mg/dL | .880 | |||
| Median (range) | 2.8 (0.1-116.7) | 1.3 (0-106.4) | 2 (0-116.7) | |
| Calcium, mg/dL | .915 | |||
| Median (range) | 9.5 (8.2-10.3) | 9.5 (8-10.7) | 9.5 (8-10.7) | |
| Serum immunofixation | .021 | |||
| Negative | 9 (13.8%) | 21 (30.4%) | 30 (22.4%) | |
| Positive | 56 (86.2%) | 48 (69.6%) | 104 (77.6%) | |
| Urine immunofixation | .193 | |||
| Negative | 18 (34.0%) | 25 (46.3%) | 43 (40.2%) | |
| Positive | 35 (66.0%) | 29 (53.7%) | 64 (59.8%) | |
| Presence of fracture | .225 | |||
| No | 43 (63.2%) | 51 (72.9%) | 94 (68.1%) | |
| Yes | 25 (36.8%) | 19 (27.1%) | 44 (31.9%) | |
| Albumin, mg/dL | .966 | |||
| Median (range) | 3.7 (2.9-4.9) | 3.6 (2.8-5.2) | 3.700 (2.8-5.2) | |
| Location | .092 | |||
| Appendicular | 19 (26.4%) | 19 (25.3%) | 38 (25.9%) | |
| Axial | 50 (69.4%) | 45 (60.0%) | 95 (64.6%) | |
| Extramedullary | 3 (4.2%) | 11 (14.7%) | 14 (9.5%) | |
| Size, cm | .328 | |||
| Median (range) | 4 (0.3-14) | 5.1 (0.3-12) | 4.3 (0.3-14) |
The number of patients in our cohort with difference between involved and uninvolved free light chains (dFLC) available was 145 of 147; serum protein electrophoresis, 140 of 147; and urine protein electrophoresis, 107 of 147. Available data on treatment were documented in 143 patients (1 patient died within 4 months of diagnosis, and 3 patients were lost to follow-up after the initial evaluation). Of these, 138 (96.5%) were treated with radiation therapy (41 had radiation/surgery, and 6 had radiation/chemotherapy) with a median dose of 45 Gy (range, 20-60). The rest of the cohort was treated with surgery only (3), observation (1), and percutaneous cryoablation (1).
The median OS was 182.9 months (95% confidence interval [CI], 126.9 to not reached [NR]). The estimated 3-, 5-, and 10-year OS rate was 93%, 87%, and 67%, respectively. The estimated median DFS was 29.9 months (95% CI, 26-62.9), and the 3-, 5-, and 10-year DFS rate was 48%,37%, and 24%, respectively. The median follow-up is 7.5 years.
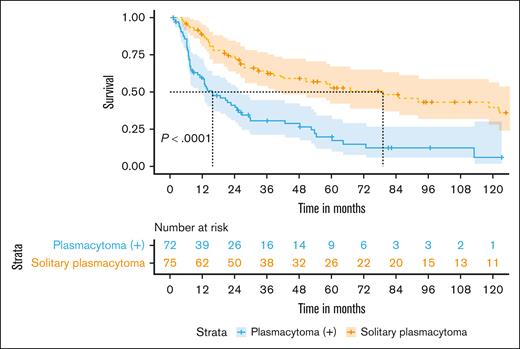
We then compared patients with plasmacytoma (+) with patients with true solitary plasmacytoma and found that patients with plasmacytoma (+) had significantly shorter median DFS (15.7 vs 79 months, respectively; P < .001) and OS (123.5 months vs NR, respectively; P < .004; Figure 2). The 3-, 5-, and 10-year DFS was 31%, 20%, and 6% for patients with plasmacytoma (+) and 64%, 53%, and 40% for patients with solitary plasmacytoma, respectively. Patients with plasmacytoma (+) also had significantly decreased median MMFS compared with patients with true solitary plasmacytoma (18.7 vs 152.7 months, respectively; P < .001). The corresponding 3-, 5-, and 10-year MMFS rates were 36%, 21%, and 10% for patients with plasmacytoma (+) and 70%, 58%, and 56% for patients with true solitary plasmacytoma, respectively.
DFS in patients with plasmacytoma (+) vs true solitary plasmacytoma within our Mayo Clinic cohort.
DFS in patients with plasmacytoma (+) vs true solitary plasmacytoma within our Mayo Clinic cohort.
We then looked at factors that influence progression in our cohort. In univariate analysis, an abnormal free light chain (FLC) ratio was associated with a shorter time of progression (hazard ratio [HR], 2.6; 95% CI, 1.6-4.2; P < .001). The presence of clonal plasma cells in the BM (>0%, with flow cytometry and/or based on trephine biopsy) was a significant risk factor for a shorter time of progression (HR, 3.3; 95% CI, 2.1-5.0; P < .001). More than 1% (HR, 3.0; 95% CI, 1.9-4.5; P < .001) or 5% (HR, 2.2; 95% CI, 1.4-3.3; P < .001) of plasma cells in the BM were also associated with a worse DFS, without linear relationship.
However, the type of clonal immunoglobulin (HR, 0.97; 95% CI, 0.8-1.2; P = .731) and the presence or not of a monoclonal protein of >0.5 g/dL (HR, 1.1; 95% CI, 0.6-1.6; P = .905) were not associated with an impact on time of progression. The size of the plasmacytoma (HR, 1.0; 95% CI, 0.9-1.1; P = .373) and the dose of radiation therapy (HR, 1.0; 95% CI, 0.9-1.1; P = .623) have not demonstrated any prognosis impact.
In subgroup analysis of patients with plasmacytoma (+), an abnormal FLC ratio (HR, 1.9; 95% CI, 1.1-3.3; P = .049) and a positive urine immunofixation (HR, 3.4; 95% CI, 1.7-7.2; P = .013) were the only significant risk factors for earlier progression. In contrast, for true solitary plasmacytoma, only an abnormal FLC ratio (HR, 2.7; 95% CI, 1.3-5.7; P = .005) retained significance.
The presence of serum M-protein and a positive serum immunofixation did not increase the risk for a shorter time to progression in our cohort (both in patients with plasmacytoma [+] and patients with solitary plasmacytoma). Patients with true solitary plasmacytoma and a dFLC of <5 mg/dL had a 3-year DFS of 76%, with a median DFS of >10 years (supplemental Figure 1). For patients with plasmacytoma (+) and negative urine immunofixation, the 3-year DFS was 58% compared with 19% for patients with positive urine immunofixation, with a statistically significant difference in the estimated median DFS (52.5 vs 12.7 months, respectively; P = .008; supplemental Figure 2). Finally, we compared patients based on plasmacytoma location, and we found a statistically better median DFS among patients with extramedullary disease (only 2 patients experienced relapse after initial treatment) compared with those with bone plasmacytoma (NR vs 26.2 months, respectively; P = .005; supplemental Figure 3).
Systematic review and meta-analysis
Baseline characteristics
A total of 62 studies and 3487 patients with solitary plasmacytomas met our inclusion criteria. Most studies (39) presented data on both extramedullary and bone plasmacytomas,10-48 whereas 10 studies had only patients with extramedullary49-58 and 13 had only bone disease.5,59-70 Across all studies, the median age at diagnosis was 58 years (range, 16-95), and 66.1% of patients were male. Most studies (75%) had a BM assessment available, 68% included imaging modalities, of which 46% were advanced (whole-body CT, MRI, or PET-CT). The median size (based on the biggest diameter) was 4.9 cm (range, 0.1-18). Among patients with bone plasmacytomas (2279), information on the exact location was available in 1535 patients. Of these, 958 (62.4%) were located in the axial skeleton, and the rest (37.6%) were located in the appendicular. For extramedullary plasmacytomas (1037), most (72%) were located in the upper airway and oropharyngeal region. Only 8 studies (reporting on 515 patients) had information about the presence of clonal cells in the marrow (true solitary plasmacytoma vs plasmacytoma [+]); and 259 (50.3%) were true plasmacytomas, with the other half either having clonal cells detected or not examined for clonality in the initial BM examination. Mostly all studies (75%) had BM assessment available, ∼68% of studies included imaging modalities and 46% included advanced imaging modalities (whole-body CT, MRI, or PET-CT). Radiation was the main treatment option for most patients with available treatment information (2705), with 2450 (90.6%) treated with either radiation alone, radiation and surgery, or other combination therapies that included chemotherapy. The median dose of radiation was 45 Gy (range, 20-70). The remaining patients were treated with surgery alone, chemotherapy alone, observation, or other less-common therapies (eg, cryoablation). Lastly, of the 32 studies and 1819 patients with available information on serum electrophoresis, 926 (50.9%) had a monoclonal protein detected, with a median size of 0.9 g/dL (range, 0.05-2.9; supplemental Table 1).
DFS and OS estimates for the whole cohort
We then sought to describe the clinical outcomes and the survival estimates of patients with plasmacytoma. We found a combined 3-year DFS rate of 66.9 % (95% CI, 60.8-72.5), a 5-year rate of 55% (95% CI, 50.9-59.2), and a 10-year rate of 42.1% (95% CI, 36.8-47.6) (Figure 3, supplemental Figure 4A and B, respectively). For survival outcomes, the 5-year OS rate was 79.6% (95% CI, 75.6-83) and the 10-year OS rate was 64.7% (95% CI, 59.7-69.3) (supplemental Figure 5A and B, respectively).
Comparisons of outcomes of bone vs extramedullary plasmacytomas
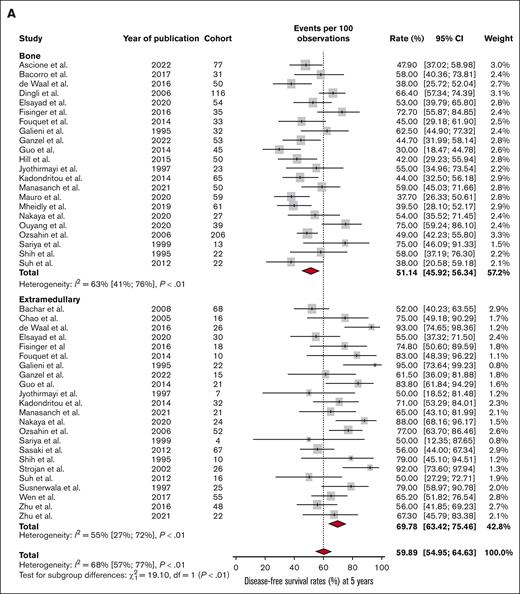
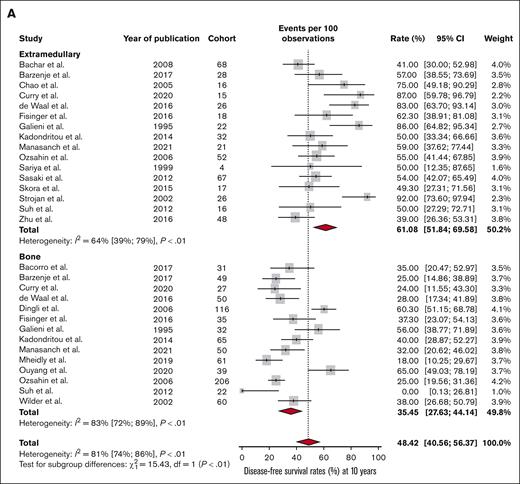
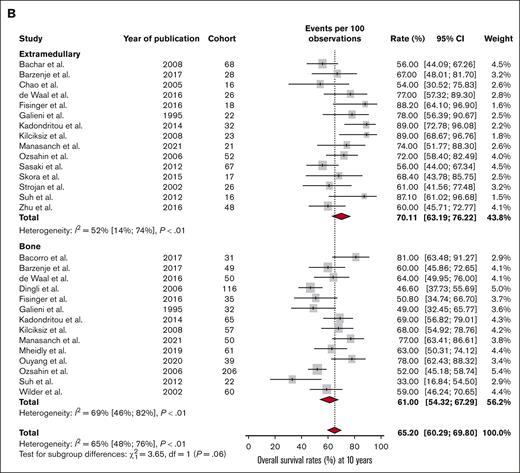
Finally, we compared the DFS and OS estimates based on the plasmacytoma location (bone vs extramedullary). There was a statistically significant difference in the 3-year DFS rate, with patients with bone plasmacytomas having earlier relapses than those with plasmacytomas in extramedullary locations (74.4% vs 84.9%, respectively; P < .01). The same results were observed both in the 5-year DFS rate (51.1% vs 69.8%, respectively; P < .01; Figure 4A) and the 10-year DFS rate (35.5% vs 61.1%, respectively; P < .01; Figure 5A).
Outcomes of bone versus extramedullary plasmacytomas at 5 years. (A) DFS and (B) OS at 5 years in patients with SBP or SEP.
Outcomes of bone versus extramedullary plasmacytomas at 5 years. (A) DFS and (B) OS at 5 years in patients with SBP or SEP.
Outcomes of bone versus extramedullary plasmacytomas at 10 years. (A) DFS and (B) OS at 10 years in patients with SBP or SEP.
Outcomes of bone versus extramedullary plasmacytomas at 10 years. (A) DFS and (B) OS at 10 years in patients with SBP or SEP.
For OS, there was a numerical difference in the survival estimates for the 5-year rate (76.7% vs 81%, respectively; P < .01; Figure 4B) and the 10-year 0S rate (61% vs 70.1%, respectively; P < .01; Figure 5B), although in both instances the difference did not reach the predetermined threshold of statistical significance.
Discussion
In the first part of this study, we sought to evaluate the outcomes of patients with solitary plasmacytomas and identify potential risk factors for shorter DFS in these patients. We reported significant DFS and OS differences in patients with a true solitary plasmacytoma at diagnosis compared with those with plasmacytoma (+). Specifically, we showed that a positive BM examination at diagnosis had an HR of 3.3 for an earlier time to progression in our univariable analysis. As already described by Warsame et al, the use of a BM biopsy allows for better disease prognostication because they showed that patients with negative BM had significantly better DFS than patients with no BM examination and patients with positive clonal cells (42 vs 24 vs 15 months, respectively; P = .01).5 More recently, Paiva et al reported that patients positive for clonal cells with more sensitive methods (multiparameter flow cytometry) had a median time to progression of 26 months vs NR, P < .01 compared with patients with true plasmacytoma, respectively.41 Similar results that advocate for the utility of multiparameter flow cytometry plasma cell detection in the BM were also seen in a cohort published by Hill et al.70 Patients with a positive BM biopsy are typically older and closer to the median MM diagnosis age, as we reported in this study. These data suggest that a BM examination is essential in the risk stratification of these patients, and detection of clonal plasma cells likely signifies a more aggressive disease biology similar to that of MM. In contrast, we found that patients with a negative BM examination have a median MMFS of almost 15 years and thus a more indolent trajectory.
More than 75% of patients had a positive serum or urine monoclonal component, which likely justifies the shorter DFS and MMFS rates in our cohort compared with what is reported in the literature.5,15,21,22,25,31,35,38,40,60,64 Although more common in patients with plasmacytoma (+), a serum monoclonal protein did not seem to influence the DFS or MMFS rates in our univariable analysis. In contrast, a positive urinary immunofixation and a dFLC of >5 mg/dL were associated with a shorter DFS for patients with plasmacytoma (+), whereas only the dFLC retained significance for patients with true solitary plasmacytoma. Similarly, Dingli et al showed that an abnormal serum FLC ratio was a predictive factor for the progression to MM.64 Lastly, a bone fracture at the time of diagnosis was not associated with worse outcomes. For location, most of our patients had solitary bone plasmacytoma, and only a few patients had extramedullary disease. Radiation with a dose of ≥40 Gy was the main treatment option for patients included in this study. This is similar to what has already been reported in the literature.17,22,23,26,31,40,67,71
The results of our meta-analysis give some insight into the natural history of solitary plasmacytoma and elucidate the outcome difference between patients with SBPs and SEPs. Most patients were treated with radiation, and the median dose (45 Gy), is in accordance with our Mayo Clinic experience. Across all studies, two-thirds of the patients were disease free at 3 years, and more than half (55%) did not have recurrence at the 5-year mark. Importantly, when grouping patients based on location, we found that patients with SBPs had worse DFS and OS than patients with SEPs, at the 3-, 5-, and 10-year mark. This higher likelihood of progression in patients with SBPs compared with patients with SEPs was also seen in our Mayo Clinic cohort. Similarly, the Greek and The Netherlands myeloma group also reported that patients with SBPs had a higher risk of progression in MM than those with SEPs.21,31 Furthermore, in a national database retrospective analysis including >1500 patients with SEPs, the median survival was ∼11 years.72 These results potentially indicate different disease pathogenesis among the 2 locations, especially when patients with extramedullary plasmacytomas do not have plasma cells detected in the BM.
We demonstrate that patients with extramedullary plasmacytoma have a better long-term outcome than patients with bone disease. Moreover, we show that an abnormal FLC ratio or a positive 24-hour urinary protein immunofixation are also associated with an increased probability of progression to MM. We hypothesize that bone plasmacytoma has a similar biology to MM because of the underlying clone in the BM, which is often absent in patients with pure extramedullary plasmacytoma. Moreover, bone plasmacytoma can cause direct destruction of bones, which suggests more malignant biology than extramedullary plasmacytoma.
Our study had limitations, including its retrospective nature, the relatively small population size, the lack of advanced imaging for 7.5% of the cohort, and the limited detection of differences in DFS between both groups of this heterogeneous population. In addition, because of the low number of extramedullary plasmacytomas, we could not determine specific risk factors for progression in this subgroup, as we did in bone disease. The limitations of the meta-analysis include the nonstandardized definition of progression to MM across studies, and the lack of accounting for other specific variables such as BM examination, use of modern imaging techniques, etc. Imaging modalities were inconsistent across studies, making it impossible to exclude multiple lesions in some patients. Thus, we could not compare the outcomes of patients evaluated with state-of-the-art imaging vs older methods. In addition, the studies included in the analysis had different measured outcomes (some reported OS data vs DFS data, etc), which did not allow for consistent reporting of outcomes using the same population each time (eg, Figure 5A-B). Similar to our study, most studies included in the meta-analysis were retrospective cohorts. Because there is no mandatory registration for nonrandomized trials as for randomized clinical trials, we searched multiple databases to find “gray” literature to avoid publication bias. Lastly, we could not compare the outcome of true solitary plasmacytomas vs plasmacytoma (+) in our meta-analysis because of missing data in several studies.
In conclusion, patients with true solitary plasmacytoma had a lower progression rate than patients with plasmacytoma (+). We highlight the role of the BM examination in characterizing a patient’s risk of disease progression. In this retrospective study, the detection of clonal plasma cells in the BM is associated with a worse outcome. There does not appear to be a linear relationship between the clonal plasma cell count and MM progression rate. More studies are required before considering and treating plasmacytoma (+) similar to MM, especially because some cases never progress to a more advanced disease. However, these patients should be monitored closely because of their increased progression risk. We also provide specific risk factors for each subgroup of patients and corroborate the importance of the serum FLC difference in both patients with plasmacytoma (+) and those with solitary plasmacytoma. Finally, using, to our knowledge, the largest cohort of patients with plasmacytoma to date, this study also confirms that patients with SEPs had better outcomes than those with SBPs.
Acknowledgment
The authors acknowledge the Mayo Clinic Hematological Malignancies Program.
Authorship
Contribution: S.K.K. and C.C. designed the study and analyzed the data; S.K.K., C.C., and J.-S.C. collected the data and wrote the manuscript; and J.C., J.-S.C., P.K., M.B., F.K.B., D.D., A.D., A.L.F., M.A.G., W.G., S.R.H., M.A.H., Y.L.H., T.K., M.Q.L., N.L., Y.L., R.W., R.A.K., S.V.R., and S.K.K. were involved in patient management, revised the manuscript, and approved the final version.
Conflict-of-interest disclosure: The authors declare no competing financial interests.
Correspondence: Shaji K. Kumar, Division of Hematology, Mayo Clinic, 200 1st St SW, Rochester, MN 55905; email: kumar.shaji@mayo.edu.
References
Author notes
Original data are available on request from the corresponding author, Shaji K. Kumar (kumar.shaji@mayo.edu).
The full-text version of this article contains a data supplement.


