Key Points
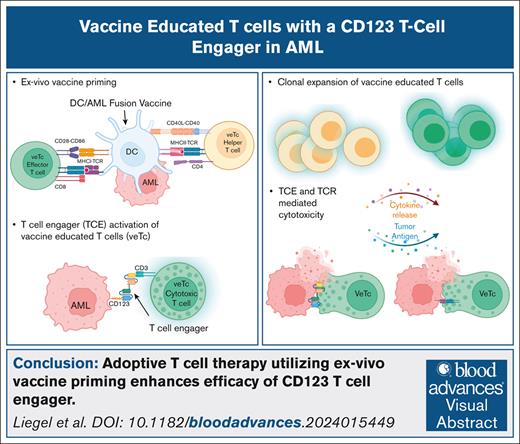
Adoptive T-cell therapy using ex vivo vaccine priming enhances efficacy of CD123 TCE in acute myeloid leukemia.
veTcs could enhance the effect of TCEs via increased tumor-specific immunity and T-cell clonotype expansion.
Visual Abstract
T-cell engager (TCE) therapy has demonstrated significant therapeutic efficacy in patients with hematologic malignancies. Durable responses have been linked with T-cell clonotypic expansion. We hypothesized that combining vaccine-educated T cells (veTcs) that induce the expansion of leukemia-specific T cells would enhance efficacy of TCE through greater induction of tumor-specific immunity. In this study, we explored a TCE targeting human CD123 on myeloid leukemia cells in conjunction with T cells stimulated by an autologous dendritic cell/acute myeloid leukemia fusion vaccine in a murine xenograft model. We demonstrated that the combination of CD123 TCE (SAR440234) and veTcs boosted tumor-specific T-cell immunity and enhanced antileukemia effect in vitro. Furthermore, in vivo SAR440234 and veTca combination treatment fully eradicated leukemia engraftment outperforming SAR440234 in conjunction with uneducated T cells. This effect was associated with an increase in cytotoxic T-cell subsets and clonotypic expansion. Thus, the combination of TCE with adoptive T-cell transfer of veTcs is a novel approach that merits further investigation in clinical trials.
Introduction
Bispecific T-cell engagers (TCEs) establish a synapse between T cells and tumor via binding of the CD3 subunit of the T-cell receptor (TCR) complex and a corresponding surface protein expressed by malignant cells, resulting in T-cell activation and subsequent TCR-independent cytotoxic cell death. TCE therapy in hematologic malignancies has therapeutic efficacy in patients with advanced disease1-3 and response has been associated with clonotypic expansion.4 We have developed a personalized cancer vaccine by fusion of autologous tumor and dendritic cells (DCs) that induces the expansion of tumor-specific effector cells. In phase 1/2 clinical trials, vaccination of patients with acute myeloid leukemia (AML) after chemotherapy-induced remission resulted in the durable expansion of leukemia-specific T cells.5,6 Combination of DC/AML fusion vaccine and immunotherapies, such as checkpoint blockade, has led to increased T-cell diversity and enhanced survival in preclinical studies.7
CD123, the interleukin-3 receptor α chain, is overexpressed in AML, leading to its evaluation as a target8-10 in clinical trials in both upfront and relapsed AML.11-14 CD123 crossover dual-variable TCE (SAR440234 [SAR]) is a bispecific antibody shown to induce T-cell activation and cytotoxicity against CD123-expressing human cell lines and primary AML samples in vitro and in mouse models.15 Here, we evaluate the preclinical activity of SAR in combination with vaccine-educated T cells (veTcs).
We hypothesized that veTcs could sustain antitumor immunity by supporting secondary expansion of tumor-specific effectors, enhancing TCE efficacy. In this study, we demonstrated that the combination of veTc and SAR led to an increase in tumor-specific T-cell immunity and enhanced antileukemia effect in vitro and in vivo. Furthermore, the combination treatment was shown to increase cytotoxic T-cell subsets and clonotypic expansion, leading to eradication of AML in primary xenograft murine models.
Methods
Sample acquisition
Peripheral blood and bone marrow aspirate samples were obtained from patients with AML after informed written consent at the time of a standard-of-care procedure as per an institutional review board–approved protocol.
CD123 TCE (SAR)
SAR and control engager with silenced anti-CD123 were obtained through a collaboration with Sanofi. As previously described, Fc-fusion protein was generated by engineering humanized anti-CD123– and anti-CD3–coding sequences into a bispecific crossover dual-variable format with a fully humanized immunoglobulin G1 (IgG1) backbone with reduced Fc functionality. In preclinical studies, SAR was capable of T-cell–directed killing of both CD123-expressing human cell lines and primary human AML samples in vitro, and use of SAR resulted in the suppression of AML tumor growth in leukemia xenograft mouse models.15
Leukemia engraftment in NSG mice
All animal studies were carried out in accordance with the guide for the care and use of laboratory animals of the National Institute of Health under protocols approved by the Beth Israel Deaconess Medical Center Institutional Animal Care and Use Committee. AML was inoculated retroorbitally (1 × 10⁶ cells per mouse) into sublethally irradiated (300 rads) NOD-SCID IL2Rgammanull (NSG) mice (The Jackson Laboratories). Weekly bleeding was performed for monitoring human engraftment, which was determined by percentage of peripheral blood human CD45.16 Upon detection of human CD45, mice were randomly divided into treatment groups. Mean peripheral blood levels of human CD45 per cohort was 1% to 4% (data not shown). After euthanasia, bone marrow and spleen cells were collected and red blood cells were lysed with buffer (Sigma). Leukemia engraftment after treatment was defined as human leukemia cells comprising ≥0.1% of total marrow cellularity by flow cytometric analysis.17
Generation of DC/AML fusion veTcs
DC/AML fusion vaccine, which has been described previously, was developed using AML cells obtained at time of active disease and DCs matured from peripheral blood mononuclear cells collected at remission and cultured in the presence of interleukin-4 (IL-4), granulocyte-macrophage colony-stimulating factor, and tumor necrosis factor α for 7 days.5,18 Fusion was performed with polyethylene glycol, and vaccine cells were exposed to 30 Gy gamma irradiation. T cells were obtained from respective patients at remission after magnetic bead depletion, and stimulated ex vivo with DC/AML vaccine for 5 days. Both veTcs and unstimulated T cells (uTcs) were cultured in the presence of recombinant human IL-2 (rhIL2), rhIL7, and rhIL15 (R&D Systems), and expanded using CD3/CD28 (Dynabeads).
Morphology assessment
Cytospin of harvested bone marrow cells were fixed in methanol and stained using a Wright-Giemsa protocol. The cells were visualized by contrast light microscopy (Olympus AX70) using an oil immersion objective lens (×100).
Flow cytometry
For surface marker expression, cells were incubated with Fc receptor–blocking reagent (Miltenyi) followed by the listed antibodies including anti-CD123 clone 9F5 or an isotype control. Analysis was performed using Gallios with Kaluza software (Beckman Coulter).
Intracellular IFN-γ expression following exposure to tumor lysate
The presence of tumor reactive lymphocytes was quantified by the percent of T cells expressing interferon gamma (IFN-γ) after ex vivo exposure to autologous tumor lysate for 3 days. T cells were pulsed with GolgiStop (1 μg/mL; BD Pharmingen) for 4 to 6 hours at 37°C, then labeled with CD4-BV421 and CD8-allophycocyanin (APC)-cyanine 7 (Cy7). Cells were permeabilized with Cytofix/Cytoperm (BD Pharmingen) for 30 minutes at 4°C and incubated with anti–IFN-γ–phycoerythrin (PE) (Invitrogen) or a matched isotype control. Intracellular IFN-γ expression was quantified by flow cytometric analysis.
Cytotoxicity targeting AML in vitro
The capacity of veTcs and uTcs to lyse autologous AML cells was measured with granzyme-release cytotoxicity assay (OncoImmunin, Inc). Target AML cells were incubated in Target Fluorescent Label-4 (TFL-4) and washed twice in phosphate-buffered saline. uTcs or veTcs, with the addition of SAR or isotype control, were coincubated with labeled target cells in the presence of a fluorogenic granzyme B substrate for 1 to 2 hours at 37°C. Cells were washed and analyzed by flow cytometry. Dying target cells are identified by cells that dually stain for granzyme B (fluorescein isothiocyanate (FITC) channel) and TFL-4 (APC channel). TFL4-labeled tumor cells without the addition of T cells, were used as a negative control.
Tissue immunoprofiling with scRNA-seq and scTCR-seq
Cell suspensions after harvesting of bone marrow and spleen tissues from individual mice were cryopreserved. Upon thawing, samples underwent dead cell removal (Miltenyi MACS kit) and human CD45 enrichment (Stemcell Technologies). Based on cell yield, samples from 4 mice per treatment group (no treatment, uTc + IgG, uTc + SAR, veTc + IgG, veTc + SAR) were chosen for single-cell RNA (scRNA-seq) and TCR sequencing (scTCR-seq), 20 samples from bone marrow and spleen compartments each were labeled with 1 μg of 1 of 5 TotalSeq-C anti-human hashtag antibody (BioLegend). Five anti-human hashtag antibodies conjugated with unique barcodes were used. Five spleen or bone marrow samples labeled with different hashtag antibodies were pooled together (1 sample per treatment group), and 32 000 to 40 000 cells were loaded in 1 channel of a Chromium Chip K (10x Genomics) and profiled using the Chromium Next GEM Single Cell 5' Kit, version 2 (10x Genomics). Full-length paired α/β TCR libraries were obtained using the Chromium Single Cell V(D)J Enrichment Human T Cell (10x Genomics). Complimentary DNA, gene expression, and TCR library quality were assessed using the DNA High Sensitivity Bioanalyzer Chip (Agilent). Gene expression or TCR libraries were pooled and sequenced on a NovaSeq 6000 sequencer (Illumina).
scRNA-seq and scTCR-seq analyses
Cell processing used Cell Ranger version 7.1.019 for demultiplexing, gene expression, and TCR quantification, with samples distinguished by hashtag sequences. Cells with a human-to-mouse read ratio of >1 were retained, and empty droplets were removed (DropletUtils; false discovery rate [FDR] of <0.05).20,21 High-quality cells met these criteria: mitochondrial content of <15%, 500 to 7000 detected genes, and 1000 to 40 000 unique molecules. Three low-cell samples (2 spleen, 1 bone marrow) were excluded; remaining samples were used for clustering and cell type identification.
scRNA-seq samples from the spleen and bone marrow were integrated and analyzed using Seurat version 3.2.3.22 Data were normalized, log transformed, and reduced with the top 30 principle component analysis components and 2000 variable genes. Harmony23 corrected technical noise, and clustering was performed with uniform manifold approximation and projection. Ambient messenger RNA was adjusted with SoupX,24 and doublets were identified with Pegasus,25,26 and removed if enriched (k = 69; FDR < 0.05; Fisher exact test).
Cluster markers were detected with limma-trend,27,28 retaining genes expressed in ≥10% of cells per cluster, followed by trimmed mean of M component normalization.29 A linear model accounted for cluster and sample effects, retaining significantly differentiated genes (FDR < 0.05). Cell type abundances were calculated by total number of cells per sample, and population differences were assessed with Dirichlet multinomial regression (Benjamini-Hochberg correction; supplemental Tables 1 and 2). Spleen and bone marrow untreated samples were removed from downstream analysis.
Clonotypes were identified with Cell Ranger version 7.1.0,19 retaining cells with TCR-α and/or -β chains. Clonotypes were defined by CDR3 sequences, and expansion/clone size proportions were calculated by summarizing the number of each clonotype vs the total number of T cells with at least 1 clonotype. Population differences were tested with Dirichlet regression and Wilcoxon rank-sum test (FDR < 0.05; supplemental Tables 3 and 4). For CD4 T-cell differential expression, genes in ≥10% of cells were trimmed mean of M component–normalized, implemented in edgeR,30 and analyzed with the limma-trend method in combination with an empirical Bayes procedure.31 Significantly differentially expressed genes were identified (log2 fold change of <0.01; FDR < 0.05).
Results
CD123 TCE targets patient-derived AML in a xenograft model
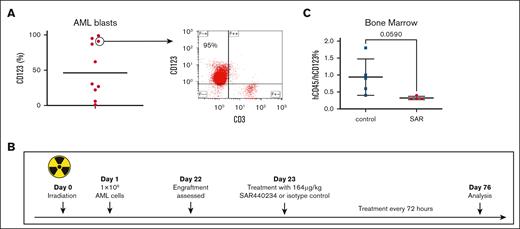
We characterized AML samples obtained from 10 newly diagnosed patients demonstrating expression of variable levels of CD123 (Figure 1A). We subsequently examined the single-agent activity of SAR in a patient-derived xenograft model. Bone marrow mononuclear cells from 1 patient sample with CD123 expression and concurrent presence of an infiltrating CD3+ T-cell population was selected (patient 1, Table 1). A total of 1 × 10⁶ primary cells were inoculated via retroorbital injection into sublethally irradiated NSG mice (n = 10). Engraftment of human leukemia and T cells was demonstrated 3 weeks after tumor challenge as manifested by the presence of human CD45+ cells in the peripheral blood.16 SAR (164 μg/kg) or TCE isotope control (IgG) was administered via intraperitoneal injection every 3 days as depicted in Figure 1B. One mouse was euthanized due to fight wound before the experiment end point and excluded from the subsequent analysis. On day 76 after initial tumor challenge, the remaining mice were euthanized (n = 9) and assessed for primary AML cells in the bone marrow by presence of human CD45dim+/CD123+ cells. Mice treated with SAR showed decreased leukemia burden (Figure 1C).
SAR leads to decrease in AML involvement in a patient-derived xenograft model. NSG mice were inoculated with patient-derived AML cells (n = 10) 1 day after sublethal irradiation, 300 cGy. After detection of human engraftment in the peripheral blood, the animals were treated with SAR or isotype control. (A) AML blasts from bone marrow aspirate samples were stained with anti-hCD123 phycoerythrin (PE) and anti-hCD3 allophycocyanin (APC). Right depicting a representative plot. (B) Patient-derived xenograft schema. (C) Summary of analyzed bone marrow. Samples collected from NSG mice were stained with anti-hCD45 prussian blue (PB) and -hCD123 PE. Mean with standard deviation shown. Statistical analysis was performed by unpaired t test using GraphPad Prism 10.0 (GraphPad Software Inc). hCD45, human CD45.
SAR leads to decrease in AML involvement in a patient-derived xenograft model. NSG mice were inoculated with patient-derived AML cells (n = 10) 1 day after sublethal irradiation, 300 cGy. After detection of human engraftment in the peripheral blood, the animals were treated with SAR or isotype control. (A) AML blasts from bone marrow aspirate samples were stained with anti-hCD123 phycoerythrin (PE) and anti-hCD3 allophycocyanin (APC). Right depicting a representative plot. (B) Patient-derived xenograft schema. (C) Summary of analyzed bone marrow. Samples collected from NSG mice were stained with anti-hCD45 prussian blue (PB) and -hCD123 PE. Mean with standard deviation shown. Statistical analysis was performed by unpaired t test using GraphPad Prism 10.0 (GraphPad Software Inc). hCD45, human CD45.
Combination of DC/AML fusion vaccine with CD123 TCE induces tumor-specific T-cell immunity
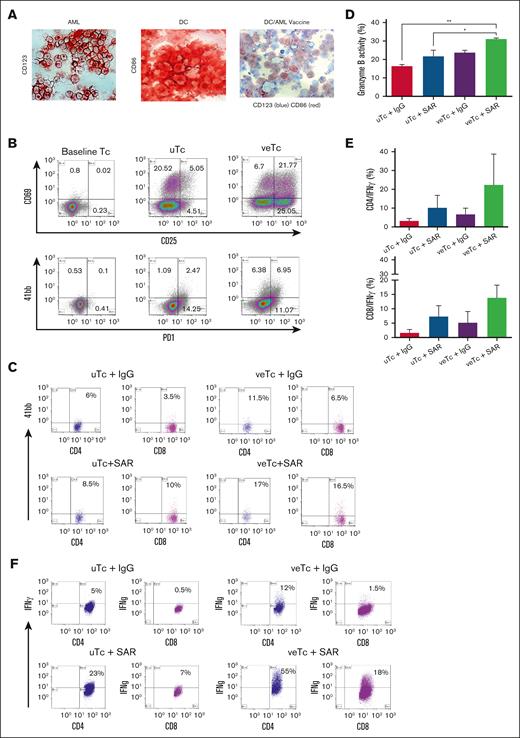
The potency of the combination of veTcs and SAR was first explored in vitro. DC/AML fusion vaccine was generated as described earlier. Fusion efficiency was quantified using immunohistochemistry, demonstrating most fusion cells coexpressing a DC marker (CD86) and a tumor marker (CD123; Figure 2A). veTcs were generated after stimulation with vaccine, resulting in upregulation of T-cell activation markers (CD25, CD69, PD1, and 41BB) as compared with uTcs (Figure 2B-C). veTc and uTc populations were then expanded with CD3/CD28-coated beads and their capacity to lyse autologous AML cells in the presence or absence of CD123 TCE was measured by granzyme-release cytotoxic T-lymphocyte (CTL) assay. The combination of veTcs and SAR resulted in significantly higher CTL-mediated killing as compared with uTcs plus control engager or uTcs + SAR (Figure 2D).
Combination of DC/AML fusion vaccine with SAR leads to induction of tumor-specific T-cell immunity ex vivo. (A) Fusion efficiency was established using immunohistochemical staining, AML cells stained with CD123 (left), DCs stained with CD86 (middle), and DC/AML fusion cells stained with both CD123 and CD86 (right). (B) T-cell activation was analyzed by flow cytometry at baseline (day 0), and after in vitro fusion veTcs vs uTcs (day 5). Cells were stained with the activation markers CD25 APC, CD69 PE, 41bb APC, and PD1 BV421. (C) 41bb expression by flow cytometry; in vitro coculture of veTcs with autologous tumor cells led to further antigen-specific activation in the presence of SAR in both CD4 and CD8 subsets vs the control engager. (D) The capacity of veTcs to target autologous leukemia cells in the presence of TCE in vitro was assessed by flow cytometry. Dying target cells are identified by cells that dually stain for tumor labeled with TFL4 (APC channel) and cleaved granzyme B substrate (FITC channel). Mean of 3 separate assays is shown, pairwise comparisons all not significant. (E) Detection of intracellular IFN-γ of CD4 and CD8 by flow cytometry after coculture of veTcs with autologous tumor cells and the addition of SAR (30 ng). Mean with standard error of the mean (SEM) for 3 separate assays is shown. (F) Representative flow plots of intracellular IFN-γ for CD8 and CD4 T cells. Statistical analysis was performed by 1-way analysis of variance using GraphPad. ∗P ≤ .05; ∗∗P ≤ .01. PD1, programmed cell death protein 1.
Combination of DC/AML fusion vaccine with SAR leads to induction of tumor-specific T-cell immunity ex vivo. (A) Fusion efficiency was established using immunohistochemical staining, AML cells stained with CD123 (left), DCs stained with CD86 (middle), and DC/AML fusion cells stained with both CD123 and CD86 (right). (B) T-cell activation was analyzed by flow cytometry at baseline (day 0), and after in vitro fusion veTcs vs uTcs (day 5). Cells were stained with the activation markers CD25 APC, CD69 PE, 41bb APC, and PD1 BV421. (C) 41bb expression by flow cytometry; in vitro coculture of veTcs with autologous tumor cells led to further antigen-specific activation in the presence of SAR in both CD4 and CD8 subsets vs the control engager. (D) The capacity of veTcs to target autologous leukemia cells in the presence of TCE in vitro was assessed by flow cytometry. Dying target cells are identified by cells that dually stain for tumor labeled with TFL4 (APC channel) and cleaved granzyme B substrate (FITC channel). Mean of 3 separate assays is shown, pairwise comparisons all not significant. (E) Detection of intracellular IFN-γ of CD4 and CD8 by flow cytometry after coculture of veTcs with autologous tumor cells and the addition of SAR (30 ng). Mean with standard error of the mean (SEM) for 3 separate assays is shown. (F) Representative flow plots of intracellular IFN-γ for CD8 and CD4 T cells. Statistical analysis was performed by 1-way analysis of variance using GraphPad. ∗P ≤ .05; ∗∗P ≤ .01. PD1, programmed cell death protein 1.
We subsequently examined whether veTc combined with SAR resulted in further expansion of leukemia-specific lymphocytes as determined by IFN-γ expression after ex vivo exposure to autologous tumor lysate. Stimulation with DC/AML fusion vaccine plus SAR resulted in a trend of increased percent of leukemia-specific T cells as compared with uTcs + SAR or veTcs + IgG (Figure 2E-F).
Combination treatment with DC/AML fusion veTcs and CD123 TCE eradicates leukemia engraftment in a xenograft murine model
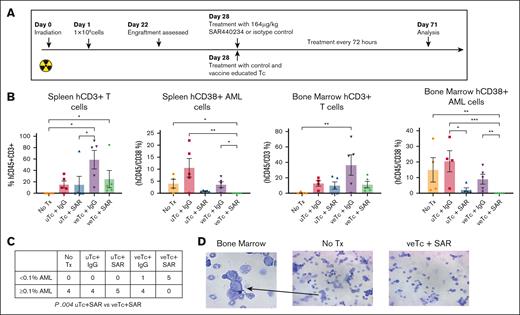
We subsequently examined the efficacy of treatment with veTcs and SAR in vivo in a patient-derived xenograft model. NSG mice were irradiated with 300 cGy and challenged with 1 × 10⁶ patient-derived AML cells (patient 2; Table 1) via retroorbital injections (n = 25). After detection of human AML engraftment in the peripheral blood on day 22 after AML inoculation, the treatment was initiated in mice on day 28. Infusion of 1 × 10⁶ veTcs or uTcs was administered via tail vein, and SAR or control engager was given intraperitoneal every 3 days; untreated (n = 5), uTcs + IgG (n = 5), uTcs + SAR (n = 5), veTcs + IgG (n = 5), veTcs + SAR (n = 5; Figure 3A). One mouse in the untreated group was euthanized for lethargy before tissue collection, the remaining animals underwent tissue analysis of the spleen and bone marrow on day 71. Engraftment of primary human AML was quantified by CD45dim/CD38+/CD3−, which demonstrated morphology consistent with AML (Figure 3D). One bone marrow sample in the uTcs + IgG group was deemed inadequate due to necrotic cells and was therefore excluded from further analysis. A decrease in human CD45dim/CD38+/CD3− leukemia cells was observed in the spleen and bone marrow of treated animals after veTcs + IgG, or uTcs + SAR, as compared with untreated mice or uTcs + IgG. Treatment with uTcs + SAR led to a significant reduction of leukemia burden in the marrow of treated mice as compared with those treated with control T cells. However, no detectable AML was uniquely observed in the spleen and bone marrow of mice treated with veTcs + SAR, showing a significant reduction compared with untreated mice or control T cells. Treatment with veTcs also led to a relative increase in human T cells in the tissues of analyzed animals, with or without the addition of SAR (Figure 3B). Mice treated with veTcs + SAR had no leukemic engraftment as previously defined by percent human leukemia cells of <0.1% of marrow cellularity,17 in contrast to each of the other conditions, which demonstrated leukemic engraftment of ≥0.1% in all of the evaluable animals (Figure 3C).
Characterization of patient samples
| . | AML phenotype . | ELN risk . |
|---|---|---|
| Patient 1 | CD123+CD11c+ | Intermediate |
| Patient 2 | CD38+CD123+ | Intermediate |
| Patient 3 | CD38+CD123+ | Intermediate |
| . | AML phenotype . | ELN risk . |
|---|---|---|
| Patient 1 | CD123+CD11c+ | Intermediate |
| Patient 2 | CD38+CD123+ | Intermediate |
| Patient 3 | CD38+CD123+ | Intermediate |
ELN, European LeukemiaNet.
Combination Tx with DC/AML fusion veTcs and SAR eradicates AML engraftment in a xenograft murine model. NSG mice were inoculated with patient-derived AML cells (n = 25). After detection of human engraftment in the peripheral blood, animals were treated on day 28 after AML inoculation with either veTcs or SAR or combination of both; no Tx (n = 5), uTcs + IgG (n = 5), uTcs + SAR (n = 5), veTcs + IgG (n = 5), veTcs + SAR (n = 5). Organ assessment for AML burden was performed 43 days after starting Tx (71 days after inoculation). (A) Patient-derived xenograft schema. (B) Spleen and bone marrow samples analyzed by flow cytometry for hCD45+CD3+ T cells and hCD45+CD38+ AML. Mean with SEM is shown. Statistical analysis was performed using GraphPad Prism 10.0. Pairwise comparison was performed using Kruskal-Wallis test, with Dunn multiple comparisons and Benjamini-Hochberg FDR correction. A P value < .05 is considered statistically significant. ∗P ≤ .05; ∗∗P ≤ .01; ∗∗∗P ≤ .001. (C) Number of animals with the indicated percentage of hCD38+ cells in the bone marrow as depicted in panel B, Fisher exact test. (D) Representative images demonstrating cell morphology consistent with blasts in an untreated mouse bone marrow preparation. Tx, treatment.
Combination Tx with DC/AML fusion veTcs and SAR eradicates AML engraftment in a xenograft murine model. NSG mice were inoculated with patient-derived AML cells (n = 25). After detection of human engraftment in the peripheral blood, animals were treated on day 28 after AML inoculation with either veTcs or SAR or combination of both; no Tx (n = 5), uTcs + IgG (n = 5), uTcs + SAR (n = 5), veTcs + IgG (n = 5), veTcs + SAR (n = 5). Organ assessment for AML burden was performed 43 days after starting Tx (71 days after inoculation). (A) Patient-derived xenograft schema. (B) Spleen and bone marrow samples analyzed by flow cytometry for hCD45+CD3+ T cells and hCD45+CD38+ AML. Mean with SEM is shown. Statistical analysis was performed using GraphPad Prism 10.0. Pairwise comparison was performed using Kruskal-Wallis test, with Dunn multiple comparisons and Benjamini-Hochberg FDR correction. A P value < .05 is considered statistically significant. ∗P ≤ .05; ∗∗P ≤ .01; ∗∗∗P ≤ .001. (C) Number of animals with the indicated percentage of hCD38+ cells in the bone marrow as depicted in panel B, Fisher exact test. (D) Representative images demonstrating cell morphology consistent with blasts in an untreated mouse bone marrow preparation. Tx, treatment.
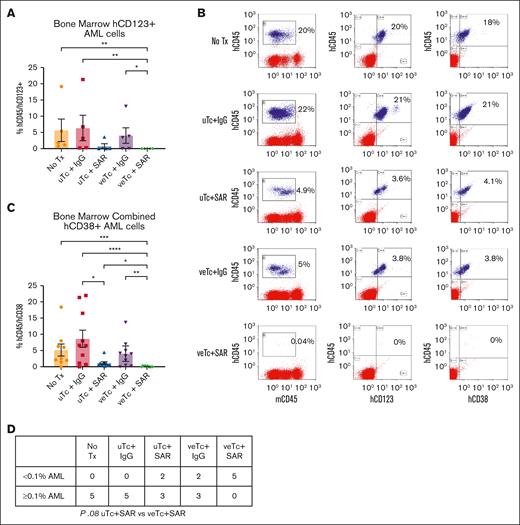
To confirm the aforementioned findings, similar studies were performed in a second xenograft experiment (patient 3; Table 1; n = 25, 5 per cohort). After detection of human AML engraftment in the peripheral blood on day 35, the mice were inoculated via tail vein with 1 × 10⁶ veTcs or uTcs and treated with SAR or control engager starting on day 36, every 3 days, until tissue analysis on day 81. Untreated animals (n = 5) and mice given uTcs + IgG (n = 5) were found to have involvement with CD38+/CD123+/CD3− AML cells in the bone marrow. Mice treated with uTcs + SAR (n = 5) showed a nonsignificant decrease in leukemia, and those receiving veTcs + IgG had only a marginal, nonsignificant reduction. In contrast, animals treated with veTcs + SAR (n = 5) had minimal or no detectable AML, with none meeting criteria for leukemia engraftment. (Figure 4A-B,D). When combining bone marrow results from both experiments, SAR alone significantly reduced disease compared with control T cells. However, the most pronounced effect was observed with veTcs + SAR, which led to a significant reduction in disease relative to all other treatment groups (Figure 4C).
Combination Tx with DC/AML fusion veTcs and SAR eradicates AML engraftment in a xenograft murine model. (A) NSG mice were inoculated with patient-derived AML cells (n = 25). After detection of human engraftment, the animals were treated on day 36 after inoculation with either veTcs or SAR or combination of both (n = 5 per cohort). Organ assessment for AML burden was performed 45 days after starting Tx (81 days after inoculation). (A) Bone marrow samples were analyzed by flow cytometry for hCD45+CD123+ AML cells. (B) Representative flow plot of single mouse bone marrow from each cohort. (C) hCD45+CD38+ values from bone marrow combined for experiments in panel A and Figure 3B. No Tx (n = 9), uTcs + IgG (n = 10), uTcs + SAR (n = 10), veTcs + IgG (n = 10), veTcs + SAR (n = 10). Mean with SEM is shown in panels A,C. Statistical analysis was performed using GraphPad Prism 10.0 (GraphPad Software Inc). Pairwise comparison was performed using Kruskal-Wallis test, with Dunn multiple comparisons and Benjamini-Hochberg FDR correction. ∗P ≤ .05; ∗∗P ≤ .01; ∗∗∗P ≤ .001; ∗∗∗∗P ≤ .0001. (D) Number of animals with the indicated percentage of hCD123+ cells in the bone marrow as depicted in panel A, Fisher exact test.
Combination Tx with DC/AML fusion veTcs and SAR eradicates AML engraftment in a xenograft murine model. (A) NSG mice were inoculated with patient-derived AML cells (n = 25). After detection of human engraftment, the animals were treated on day 36 after inoculation with either veTcs or SAR or combination of both (n = 5 per cohort). Organ assessment for AML burden was performed 45 days after starting Tx (81 days after inoculation). (A) Bone marrow samples were analyzed by flow cytometry for hCD45+CD123+ AML cells. (B) Representative flow plot of single mouse bone marrow from each cohort. (C) hCD45+CD38+ values from bone marrow combined for experiments in panel A and Figure 3B. No Tx (n = 9), uTcs + IgG (n = 10), uTcs + SAR (n = 10), veTcs + IgG (n = 10), veTcs + SAR (n = 10). Mean with SEM is shown in panels A,C. Statistical analysis was performed using GraphPad Prism 10.0 (GraphPad Software Inc). Pairwise comparison was performed using Kruskal-Wallis test, with Dunn multiple comparisons and Benjamini-Hochberg FDR correction. ∗P ≤ .05; ∗∗P ≤ .01; ∗∗∗P ≤ .001; ∗∗∗∗P ≤ .0001. (D) Number of animals with the indicated percentage of hCD123+ cells in the bone marrow as depicted in panel A, Fisher exact test.
Mice treated with veTcs exhibited higher levels of CD4 and CD8 T cells
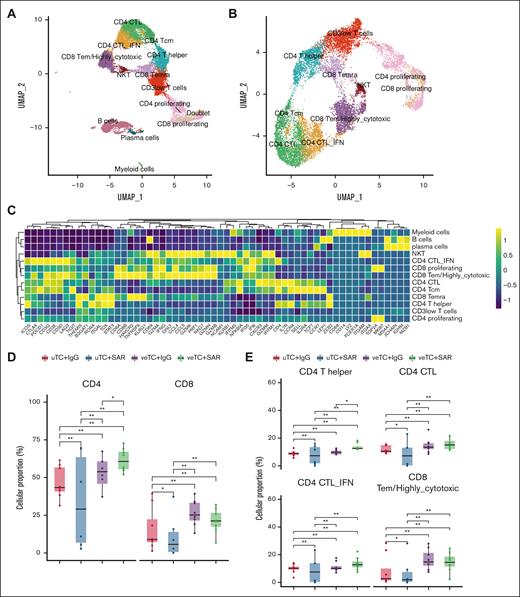
The nature of immune response was further characterized by single-cell immunoprofiling of samples collected from mouse bone marrow and spleen after human CD45 enrichment. A total of 12 773 cells passed quality check and were captured for analysis. Major lineages included T cells (k = 11 066; 86.6% of all cells), B cells (k = 1359; 10.6% of all cells), plasma cells (k = 184; 1.4% of all cells), and myeloid cells (k = 164; 1.2% of all cells; Figure 5A-C). T cells comprised the majority, consistent with the experimental design using adoptive T-cell transfer. Untreated mice had very few cells, primarily bystander B, plasma, and myeloid cells, derived from patient peripheral blood at the time of inoculation of disease (supplemental Figure 1A). Mice treated with veTcs were noted to have higher total T-cell abundances (supplemental Figure 1B), as well as higher CD4 and CD8 T cells than mice treated with uTcs (Figure 5D; supplemental Table 1).
The transcriptional states of the treated mice. (A) Two-dimensional UMAP of all cells. A total of 12 773 cells passed quality control, capturing 12 populations, depicted with distinct colors, corresponding to 4 major lineages, including T cells, B cells, plasma cells, and myeloid cells. (B) UMAP of the T-cell compartment; 10 T-cell populations were identified and are depicted with distinct colors. (C) Heat map capturing the expression of marker genes across the distinct cell populations. (D-E) Box plots portraying cell proportion differences among the mice treated with uTcs + IgG (n = 8), uTcs + SAR (n = 6), veTcs + IgG (n = 8), veTcs + SAR (n = 8). (D) CD8 and CD4 total T cells and (E) specific T-cell subsets, including CD4 T helper cells and CD4 and CD8 cytotoxic T-cell populations. Significantly different proportions among pairwise comparisons are denoted with asterisks (∗FDR < 0.05, ∗∗FDR < 0.01; Dirichlet regression, Benjamini-Hochberg FDR correction). NKT, natural killer T cells; Tcm, T central memory; Temra, T effector memory RA; UMAP, uniform manifold approximation and projection.
The transcriptional states of the treated mice. (A) Two-dimensional UMAP of all cells. A total of 12 773 cells passed quality control, capturing 12 populations, depicted with distinct colors, corresponding to 4 major lineages, including T cells, B cells, plasma cells, and myeloid cells. (B) UMAP of the T-cell compartment; 10 T-cell populations were identified and are depicted with distinct colors. (C) Heat map capturing the expression of marker genes across the distinct cell populations. (D-E) Box plots portraying cell proportion differences among the mice treated with uTcs + IgG (n = 8), uTcs + SAR (n = 6), veTcs + IgG (n = 8), veTcs + SAR (n = 8). (D) CD8 and CD4 total T cells and (E) specific T-cell subsets, including CD4 T helper cells and CD4 and CD8 cytotoxic T-cell populations. Significantly different proportions among pairwise comparisons are denoted with asterisks (∗FDR < 0.05, ∗∗FDR < 0.01; Dirichlet regression, Benjamini-Hochberg FDR correction). NKT, natural killer T cells; Tcm, T central memory; Temra, T effector memory RA; UMAP, uniform manifold approximation and projection.
Comparative analysis of the T-cell landscape demonstrates increased cytotoxic T cells after vaccine education
T cells were segregated into 10 subsets based on transcriptomic signatures (Figure 5B-C). Mice treated with veTcs alone or in conjunction with SAR demonstrated increased numbers of activated and cytotoxic CD4 and CD8 T-cell populations, including CD4 T helper cells, CD4 CTL subsets (CD4 CTL and CD4 CTL-IFN), and CD8 highly cytotoxic (CD8 T effector memory [Tem]/highly cytotoxic) T cells (Figure 5E; supplemental Figure 1C; supplemental Table 2). The CD4 cytotoxic cell populations were characterized by high expression of cytotoxic markers, including granzyme and perforin genes (GZMA, GNLY, GZMH, GZMB, GZMK, GZMM, and PRF1), with CD4 CTL-IFN cells demonstrating a costimulatory and proinflammatory phenotype by highly expressing ICOS, interferon-related genes (IFNG, IFI35, IFI6, IFITM1, and IFITM3), NF-κB inhibitor α (NFKBIA), and several chemokines (CCR4, CCL4, CCL5, and CXCR3; Figure 5C). CD8 Tem/highly cytotoxic cells were markedly defined by a profile of genes involved in cell killing, including all granzyme genes, PRF1, IFNG, and NKG7 (Figure 5C).
Clonotypic expansion of CD4 and CD8 CTLs in mice treated with veTcs and CD123 TCEs
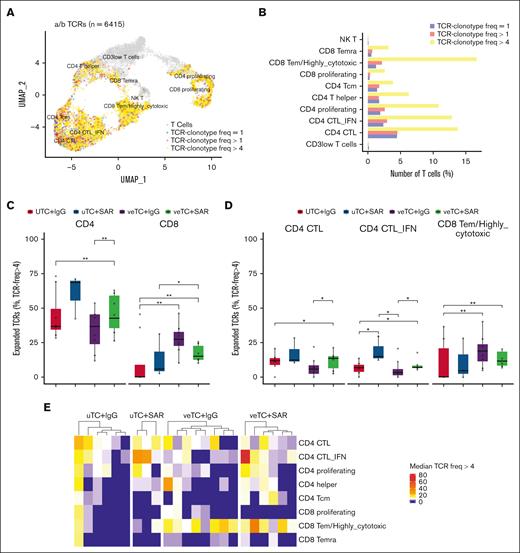
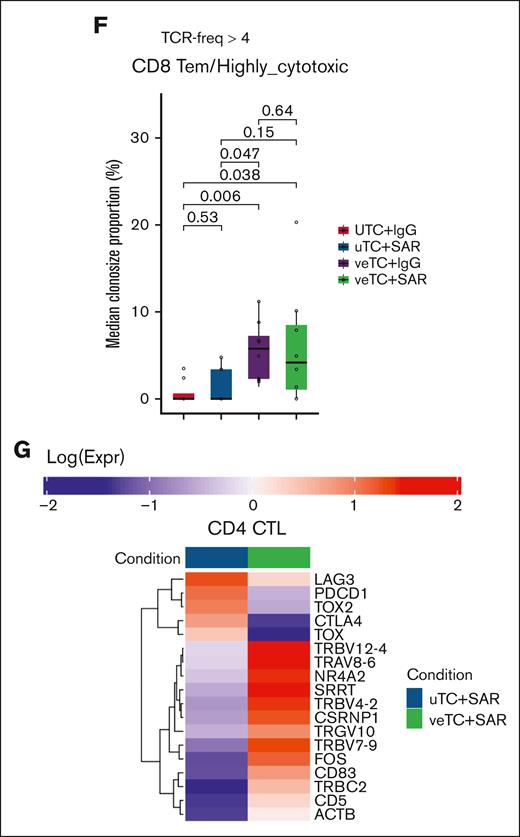
To investigate clonotypic expansion of T-cell populations, α/β TCRs were characterized from the corresponding single-cell immunoprofiling of samples harvested from mouse bone marrow and spleen, after human CD45 enrichment. A total of 6415 α/β TCR clonotypes were analyzed within the 10 T-cell subsets identified (58% of all T cells; Figure 6A). The T-cell subsets characterized by cytotoxic and proliferating signatures had greater clonal expansion than the other subsets (Figure 6B). When comparing the treatment groups, there was higher expansion of CD4 clonotypes in mice treated with SAR and an increased expansion of CD8 clonotypes in mice treated with veTcs alone or in conjunction with SAR (Figure 6C; supplemental Figure 2B; supplemental Table 3). Mice treated with the combination of SAR and veTcs exhibited higher clonotypic expansion of both CD4 and CD8 T cells than the mice inoculated with uTcs + IgG (Figure 6C). Within the T-cell subsets, the number of expanded α/β T-cell clonotypes among CD4 CTL and CD4 CTL-IFN groups was notably higher for mice treated with TCEs; although the median clonotypic expansion among the CD8 Tem/highly cytotoxic group was likewise higher in mice treated with veTcs alone or in conjunction with SAR (Figure 6D-F; supplemental Table 4). The mice treated with the combination of SAR and veTcs exhibited a higher clonotypic expansion for all 3 cytotoxic T-cell populations, than the mice inoculated with uTcs + IgG (Figure 6 D-F; supplemental Table 4). A higher clonotypic frequency within the CD8 Tem/highly cytotoxic subset was noted in nearly all mice treated with veTcs (Figure 6F), whereas both CD8 and CD4 CTL subsets presented a higher clonal expansion in mice treated with the combination arm (Figure 6E).
T-lymphocyte clonal expansion of the treated mice. (A) TCR clonality at single-cell resolution is portrayed with distinct colors in 2-dimensional UMAP of all T cells. T cells with TCR frequencies of 1, >1, and >4 are marked with blue, red, and yellow, respectively. T cells with no matching TCRs are marked with gray. (B) Bar plots portraying the number of T cells with TCR frequencies of 1 (blue), >1 (red), and >4 (yellow) per major T-cell category. (C-D) Box plots portraying the proportions of expanded paired α/β TCRs (expanded: α/β TCR freq of >4) among the mice treated with uTcs + IgG (n = 8), uTcs + SAR (n = 3), veTcs + IgG (n = 8), and veTcs + SAR (n = 6). (C) CD4 and CD8 T cells and (D) in CD4 and CD8 cytotoxic T-cell populations. Significantly different proportions among pairwise comparisons are denoted with asterisks (∗FDR < 0.05, ∗∗FDR < 0.01; Dirichlet regression, Benjamini-Hochberg FDR correction). (E) Heat map capturing the median freq of the expanded paired α/β TCRs (expanded: α/β TCR freq of >4) of each T-cell population for the distinct mice and Txs, represented per column. (F) Box plots capturing the median clone size abundance of the expanded paired α/β CD8 Tem/highly cytotoxic TCRs (expanded: α/β TCR freq of >4) for the distinct cohorts. Adjusted P values are displayed in significantly different proportions among pairwise comparisons (Wilcoxon rank-sum test, Benjamini-Hochberg FDR correction). (G) Heat map showing the average expression of differentially expressed genes associated with activation and exhaustion within the CD4 CTLs (CD4 CTL and CD4 CTL-IFN) between veTcs + SAR and uTcs + SAR. Distinct colors represent the different conditions, and gene expression profiles (log scale) are depicted in a blue-to-red gradient. Expr, Expression; freq, frequency; NKT, natural killer T cells; Tcm, T central memory; Temra, T effector memory RA.
T-lymphocyte clonal expansion of the treated mice. (A) TCR clonality at single-cell resolution is portrayed with distinct colors in 2-dimensional UMAP of all T cells. T cells with TCR frequencies of 1, >1, and >4 are marked with blue, red, and yellow, respectively. T cells with no matching TCRs are marked with gray. (B) Bar plots portraying the number of T cells with TCR frequencies of 1 (blue), >1 (red), and >4 (yellow) per major T-cell category. (C-D) Box plots portraying the proportions of expanded paired α/β TCRs (expanded: α/β TCR freq of >4) among the mice treated with uTcs + IgG (n = 8), uTcs + SAR (n = 3), veTcs + IgG (n = 8), and veTcs + SAR (n = 6). (C) CD4 and CD8 T cells and (D) in CD4 and CD8 cytotoxic T-cell populations. Significantly different proportions among pairwise comparisons are denoted with asterisks (∗FDR < 0.05, ∗∗FDR < 0.01; Dirichlet regression, Benjamini-Hochberg FDR correction). (E) Heat map capturing the median freq of the expanded paired α/β TCRs (expanded: α/β TCR freq of >4) of each T-cell population for the distinct mice and Txs, represented per column. (F) Box plots capturing the median clone size abundance of the expanded paired α/β CD8 Tem/highly cytotoxic TCRs (expanded: α/β TCR freq of >4) for the distinct cohorts. Adjusted P values are displayed in significantly different proportions among pairwise comparisons (Wilcoxon rank-sum test, Benjamini-Hochberg FDR correction). (G) Heat map showing the average expression of differentially expressed genes associated with activation and exhaustion within the CD4 CTLs (CD4 CTL and CD4 CTL-IFN) between veTcs + SAR and uTcs + SAR. Distinct colors represent the different conditions, and gene expression profiles (log scale) are depicted in a blue-to-red gradient. Expr, Expression; freq, frequency; NKT, natural killer T cells; Tcm, T central memory; Temra, T effector memory RA.
Differential expression of CD4 cytotoxic lymphocytes
CD4 cytotoxic T cells exhibited elevated activation and effector function in mice treated with veTcs + SAR than those treated with uTcs + SAR, with upregulation of TCR genes (TRBV12-4, TRAV8-6, TRBV7-9, and TRGV10) and activation markers (CD5, CD83, FOS, and NR4A2). Cytotoxicity was enhanced with veTcs + SAR, with increased expression of CSRNP1, ACTB, and SRRT, supporting the induction of a stronger CD4 response. Meanwhile, exhaustion-associated genes (PDCD1, LAG3, CTLA4, TOX, and TOX2) were downregulated, indicating a more functional and persistent CD4 CTL state under veTcs + SAR (Figure 6G).
Discussion
TCE therapy has demonstrated dramatic efficacy in patients with hematologic malignancies, with sustained responses observed in a subset of patients. Although the initial mode of action appears to be dependent on CD3 ligation and T-cell–mediated killing in the absence of TCR recognition, durable responses are associated with clonotypic expansion within the T-cell compartment, suggestive of a secondary role for adaptive immunity. We hypothesized that introducing tumor-specific lymphocytes via vaccine education as a foundation for TCE-mediated activation and tumor localization could further amplify the response.
CD123 is a promising target, because it is overexpressed on AML blasts and leukemia stem cells and has been associated with residual disease after induction chemotherapy.32,33 Multiple therapies using this target are now being investigated in clinical trials.34 Several CD123-targeting TCEs being evaluated in AML in both primary induction failure and early relapse have shown preliminary efficacy. Complete responses have been achieved in a subset of heavily pretreated patients, however most failed to respond.12 Interestingly, enhanced response was associated with an immune-infiltrated tumor microenvironment with an inflammatory chemokine signature that has also been associated with chemotherapy resistance. Among nonresponders, an upregulation of programmed death-ligand 1 in AML blasts at baseline or after therapy was observed.12,35
In this study, we demonstrated that the combination of veTcs and SAR leads to an increase in tumor-specific T-cell immunity and enhanced antileukemia effect in vitro. With respect to understanding the potential role of TCR-mediated killing in this context, we demonstrated that veTcs and SAR showed enhanced cytolytic killing of autologous leukemia targets and the expansion of IFN-γ–producing cells in response to autologous tumor lysate as compared with uTcs and SAR.
In a patient-derived xenograft model, we demonstrated that SAR infused with autologous human T cells resulted in reduction of disease burden, consistent with previous preclinical experience.15 Animals treated with veTcs + IgG also had reduction of human leukemia cells in the analyzed tissues but residual disease indicating impending leukemia progression. Most notably, leukemic engraftment was completely abrogated in all of the animals treated with veTcs and SAR, with significant treatment effect in the bone marrow relative to all other treatment groups. Survival was not assessed in this model given the potential impact of graft-versus-host disease on kinetics of engraftment across the xenograft barrier.
A lower prevalence of T cells was noted in the groups that received TCE. T-cell depletion has been observed with clinical use of these agents36,37 due to factors that may include synapse formation and tethering of T cells to the tumor as well as potential T-cell apoptosis in the setting of activation-induced cell death. The CD3 reduction seen with SAR was partially counterbalanced by a relative CD3 increase in the veTc groups. Single-cell immunoprofiling of T cells derived from the bone marrow and spleen further elucidated the T-cell landscape in the context of combination therapy. A higher abundance of T cells and cytotoxic T-cell subsets was observed in mice receiving veTcs alone or in conjunction with SAR. Furthermore, clonotypic expansion of the cytotoxic CD8 populations was most prominent after receiving veTcs alone or in conjunction with TCE. Clonotypic expansion of cytotoxic CD4 cells was associated with TCE exposure, but relatively lower expression of genes associated with exhaustion was present in the group treated with TCE and veTcs. This is notable, with CD8 clonal expansion having been associated with response to TCEs whereas failure has been associated with reduced CD4:CD8 ratio and increase of exhausted clones.4
Our work suggests potential interaction between TCE therapy and veTcs. TCE binding of tumor-associated surface antigens concurrent with CD3 ligation promotes the formation of a tumor–T-cell synapse and activates the innate cytolytic capacity of T cells to achieve tumor cell death via granzyme and perforin release.38 Although this is carried out in a major histocompatibility complex (MHC)–independent fashion, TCEs can also redirect the native T-cell repertoire to the tumor in which TCR crosslinking of additional tumor antigens can yield MHC-dependent T-cell activation. Our study did not elucidate the targets of the expanded clonotypes, but the enhanced expansion with ex vivo vaccine education suggests that the use of a platform that boosts the native T-cell repertoire can enhance antitumor effect when combined with TCEs. Clinical use of TCEs typically requires ongoing dosing to maintain disease control and this poses challenges for patient administration and increased risk of infection due to nonspecific repetitive T-cell stimulation. The addition of an expanded T-cell repertoire could ameliorate tumor antigen loss/escape that has occurred in single-antigen therapies.39 Furthermore, use of TCEs could enhance the effect of vaccination or adoptive T-cell transfer.40 Both vaccination and use of nonengineered T cells have largely demonstrated safety without provoking cytokine release syndrome or immune effector cell–associated neurotoxicity syndrome.6,41 Such a combination strategy would maximize the benefits of MHC-restricted T-cell responses that can be maintained through a memory compartment, while also engaging and redirecting T cells to the tumor bed, independent of MHC. As such, the combination of TCE therapy and vaccination or adoptive T-cell transfer, which enhanced in vivo tumor clearance in this study, are promising approaches in AML and merit investigation in clinical trials.
Acknowledgments
Single-cell data analyses were performed with support from Spatial Technologies Unit personnel (RRID:SCR_024905), on the Beth Israel Deaconess Medical Center Ithaca High Performance Computing cluster.
This study was supported, in part, by research funding from Sanofi (M.N., D.S., J.R., D.A., and J.L.). Grant support was also received by J.L. from a Dana-Farber/Harvard Cancer Center Specialized Programs of Research Excellence (SPORE) in Myeloid Malignancies Career Enhancement Award, CEP-21-01; 5P50CA206963-06.
Authorship
Contribution: J.L., D.S., G. Cheloni, M.N., and D. Karagkouni designed the study; J.L., D.S., M.N., G. Cheloni, D.T., and I.S. carried out experiments; J.C. and J.A. assisted with animal experiments; S.W., A.A.d.A., and A.P. assisted with sequencing experiments; D. Karagkouni and Y.M. performed computational analysis; I.S.V. supervised data analysis; G. Cheloni, D. Karagkouni, Y.M., and J.L. completed cell type characterization; J.L., D.S., G. Cheloni, and D. Karagkouni wrote the manuscript with input from all authors; and all authors reviewed and approved the final version of the manuscript.
Conflict-of-interest disclosure: P.F., O.Y., H.B., and S.G. report employment with Sanofi. P.F. reports employment and equity with AstraZeneca. J.R. reports consulting with Attivare, Parexel, Clario/Bioclinica, Imaging Endpoint, and Wolters Kluwer Health Inc; serves on a data and safety monitoring board of Karyopharm; reports grants and nonfinancial support from Celgene, Bristol Myers Squibb (BMS), and Sanofi, outside the submitted work; and has a pending patent (PCT/US2021/059199). D. Kufe has a pending patent (PCT/US2021/059199). I.S.V. reports consulting for Alterna Therapeutics, Chronicle Medical Software, Mosaic, and Guidepoint Global; and grants from the National Cancer Institute, National Heart, Lung, and Blood Institute (NHLBI), Singular Genomics, Harvard Stem Cell Institute, and Massachusetts Life Sciences Center, outside the submitted work. D.A. reports grants from MMRF, Clinical Trials Network (CTN) (NHLBI), Celgene, Pharmacyclics, and Kite Pharma; reports other support from Juno, Partners Therapeutics, Karyopharm, BMS, Aviv MedTech Ltd, Takeda, Legend Bio Tech, Chugai, Caribou Biosciences, Janssen, Parexel, Sanofi, and Kowa, outside the submitted work; and has a pending patent (PCT/US2021/059199). The remaining authors declare no competing financial interests.
Correspondence: Jessica Liegel, Beth Israel Deaconess Medical Center, 330 Brookline Ave, Dana 516D, Boston, MA 02215; email: jliegel@bidmc.harvard.edu.
References
Author notes
J.L. and D.S. are joint first authors.
D.A. and J.R. contributed equally to this study.
Single-cell RNA-sequencing data are available at Gene Expression Omnibus database (GSE265780).
Original data available on request from the corresponding author, Jessica Liegel (jliegel@bidmc.harvard.edu).
The full-text version of this article contains a data supplement.

