Key Points
Achievement of CMR after 4 cycles of first-line ICT is associated with improved outcomes in FL patients.
The prognostic role of early metabolic response is independent from the type of induction therapy and maintenance therapy.
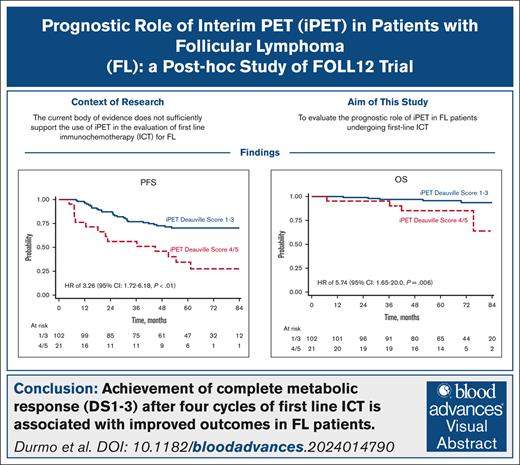
Visual Abstract
We analyzed metabolic response using interim positron emission tomography scan (iPET) in a subset of patients with follicular lymphoma (FL) enrolled in the randomized FOLL12 trial. Patients with grade 1-3a FL with an iPET performed between cycles 4 and 5 of first-line immunochemotherapy (ICT) were included; PET scan had to be centrally reviewed for the definition of Deauville score (DS) and were considered positive for DS 4-5. Overall 123 patients out of 211 with iPET were available for central review. Of these, 43% were older than 60, 33% had high-risk FLIPI2, and 47% received rituximab-bendamustine as the induction regimen. iPET showed a complete metabolic response (CMR) in 83% of cases. CMR at the end-of-induction therapy PET scan (eoiPET) was confirmed in 91% of iPET-negative patients. The 5-year progression-free survival (PFS) was 70% for iPET-negative and 34% for iPET-positive cases. In multivariate analysis, positive iPET was an independent prognostic factor for PFS. Combining iPET and eoiPET, the 3-year PFS was 78% for both negative iPET and eoiPET, with a reduced risk of progression compared to double-positive iPET/eoiPET cases. The 5-year overall survival rate was 96% for iPET-negative and 85% for DS 4-5. Our results confirm that iPET in patients with FL treated with standard ICT is a strong prognostic factor. Assessment of early metabolic response in FL may be considered for defining a novel generation of early response-adapted trials in FL. This trial was registered at www.ClinicalTrials.gov as #NCT02063685.
Introduction
Follicular lymphoma (FL) is the second most common subtype of non-Hodgkin lymphoma in the Western world, accounting for ∼10% to 20% of all non-Hodgkin lymphoma cases.1 Despite being considered a low-grade malignancy, FL is characterized by a highly variable clinical course, with some patients experiencing long-term disease-free survival, whereas others showing an aggressive behavior requiring multiple lines of therapy, and they ultimately succumb to their disease.2,3
The Follicular Lymphoma International Prognostic Index (FLIPI) and the FLIPI2 are the most widely used prognostic tools for FL patients, but their accuracy in predicting patient outcomes is limited.4-6 Recently, the duration of response (progression of disease within 24 months), demonstrated a strong correlation with both progression-free survival (PFS) and overall survival (OS).7
Besides the known prognostic features, there is a growing interest in the use of response to treatment for the prognostic assessment of FL.8 Recent data have confirmed the strong correlation between metabolic response (MR) to treatment with both PFS and OS.9,10 The use of FDG-PET (fluorodeoxyglucose positron emission tomography scan) to define the quality of response at the end-of-induction therapy by the Deauville score (DS) criteria has been recommended as standard procedure.11 Even if highly prognostic, a significant limitation of MR to treatment is represented by the generally low number of high-risk patients (∼10%) and by the late availability of such prognostic detail when treatment has already been completed.12 For these reasons, an earlier assessment of MR during treatment could provide more valuable information on treatment efficacy and potentially guide treatment management.
Several studies, including those by Merryman et al13 (2023), Boo et al14 (2019), Dupuis et al15 (2012), Bishu et al16 (2007), Lu et al17 (2014), and Zhou et al18 (2019), have examined the prognostic value of interim PET (iPET) in patients with FL undergoing immunochemotherapy (ICT). However, the results have been not univocal, with some studies reporting a significant association between early response and outcomes13-15, whereas others have shown no significant correlation16-18. Most of these studies used outdated PET response criteria and have been limited by small sample sizes. Consequently, the current body of evidence does not sufficiently support the use of iPET in the evaluation of first line ICT for FL.19
In this study, we evaluated the prognostic role of an early assessment of MR using PET in patients with FL undergoing first-line ICT. To this end, we analyzed data collected in the FOLL12 randomized trial, which compared a response-adapted postinduction management of patients with FL responding to initial ICT to standard therapy in newly diagnosed patients with FL.20 As a permitted practice within the trial, a significant proportion of patients had their MR assessed during the administration of ICT.
Methods
Study design and patients
iPET scans were collected from the multicenter, randomized, phase 3 FOLL12 trial.20 The trial included previously untreated patients aged 18 to 75 years with a histologically confirmed diagnosis of FL grade 1, 2, or 3a, Ann Arbor stage II-IV, Eastern Cooperative Oncology Group performance status of 0-2, and FLIPI2 >0. The induction ICT consisted of either rituximab and bendamustine (RB) or R-CHOP (rituximab plus cyclophosphamide, doxorubicin, vincristine, and prednisolone), as determined by the local investigator, followed by 2 additional doses of rituximab.
Postinduction management was carried out through a 1:1 randomization between standard rituximab maintenance and an experimental response-adapted strategy. The postinduction experimental approach was based on minimal residual disease (MRD) and MR; patients with complete metabolic response (CMR) and negative MRD were observed, whereas those with positive MRD received additional rituximab doses. Patients without CMR received intensified treatment with radioimmunotherapy followed by rituximab maintenance.
Patients identified for this substudy had to be included in the FOLL12 trial and had to have an interim PET performed between induction cycles 4 or 5 and available for central review. In the FOLL12 study, iPET was not mandated but allowed by the trial for observational purposes only.
The main study end point was defined as PFS; OS and response to therapy were identified as secondary study end points.
The study was conducted in accordance with the Declaration of Helsinki and Good Clinical Practice guidelines. All patients provided written informed consent before enrollment.
PET/CT acquisition and assessment of MR
All PET scans were acquired according to current European Association of Nuclear Medicine guidelines for PET imaging of tumors on PET/CT (computed tomography) scanners that were accredited through Fondazione Italiana Linfomi (FIL) clinical trial qualification.20,21 WIDEN platform was used to centrally collect PET/CT image data in anonymized Digital Imaging and Communications in Medicine format, uploaded by the local center. The reviewers were experienced nuclear medicine physicians (L.G., R.D., and F.F.) with expertise in lymphoma response evaluation. There were 2 reviewers (R.D. and F.F.) for each case with a third one (L.G.) addressed in case of discordance of the first two. Reviewers had access to baseline imaging data and were blinded to treatment regimens, clinical follow-up, and randomization arm. MR was assessed centrally using 5-point DS and Lugano criteria. PET scans were considered positive with a DS 4-5. DS 4 was defined in case of residual activity higher than liver activity (and maximum standardized uptake value (SUVmax) ≤ 2 × SUVmax of the liver). DS 5 was defined if the residual activity was markedly higher than the liver activity (SUVmax of the lesion > 2 × SUVmax liver) or if there were new lesions attributable to lymphoma. The change in SUVmax (ΔSUVmax) between the reference lesion at interim and the same lesion at baseline was also assessed.
Statistical analysis
Continuous variables are reported as median, range, and interquartile range; categorical variables are reported as absolute and percentage frequencies for the total number of cases. Comparisons of categorical variables between ≥2 groups were performed using Fisher exact test or χ2 test, when appropriate. The comparison of continuous covariates between any 2 groups was performed by means of the Mann-Whitney test. The distribution of time-to-event functions were estimated by using the Kaplan-Meier method. Comparison of survival functions between ≥2 groups was performed using the log-rank test, and the effect of covariates was expressed as hazard ratio (HR) estimated by Cox proportional hazard regression model with its 95% confidence interval (CI).
Results
Patient characteristics
A total of 807 patients were enrolled in the FOLL12 trial, of which 211 underwent iPET. A total of 88 scans were not available because they were not stored (n = 79), not performed on qualified scanners (n = 4), not performed after 4 cycles of ICT (n = 3), or not reaching the image quality criteria required by the protocol for the end-of-induction PET scan (n = 2). The final population for this study is represented by 123 cases for whom iPET scan could be centralized for review. Of these patients, 43% were older than 60 years, 33% had a high-risk FLIPI2, and 47% received RB as induction ICT (Table 1).
Clinical characteristics of the population and the relationship with iPET scans are reported
| Factor . | iPET, n (%) . | Total . | P value . | |
|---|---|---|---|---|
| 1-3 (n = 102) . | 4-5 (n = 21) . | |||
| Age >60, y | 40 (39) | 13 (62) | 53 (43) | .089 |
| Sex, male | 58 (57) | 10 (48) | 68 (55) | .477 |
| Hemoglobin <12, g/dL | 17 (17) | 5 (24) | 22 (17) | .531 |
| BM biopsy, positive | 62 (61) | 12 (57) | 74 (60) | .809 |
| LoDLIN >6 cm | 58 (57) | 12 (57) | 70 (57) | 1.000 |
| B2M > ULN | 49 (48) | 12 (57) | 61 (50) | .481 |
| Number nodal areas >4 | 42 (42) | 11 (55) | 53 (45) | .332 |
| FLIPI-2 3/5 | 32 (31) | 8 (38) | 40 (33) | .612 |
| RB | 48 (47) | 10 (48) | 58 (47) | 1.000 |
| Experimental arm | 46 (45) | 16 (76) | 62 (50) | .015 |
B2M, β-2 microglobulin; BM, bone marrow; LoDLIN, longest diameter of the largest involved node; ULN, upper limit of normality.
There was no statistically significant difference in terms of clinical characteristics and outcomes between patients who performed iPET and those who did not. Moreover, similar characteristics and outcomes were also observed between the 211 cases with iPET and the smaller group of 123 with iPET available for review. (supplemental Table 1)
In addition to what is shown in supplemental Table 1, we compared the PFS using the inverse probability weight (considering age, sex, bone marrow, longest diameter of the largest involved node, hemoglobin, β-2 microglobuline, lactate dehydrogenase, nodal areas, symptoms, induction treatment, and randomization arm) to be assessed with iPET DS (iDS), showing a weighted HR between “iDS done” and “not done” of 1.05 (95% CI, 0.77-1.44; P = .743).
PET results
According to centralized review, DS of the iPET was 1, 2, 3, 4, and 5 in 23 (19%), 54 (44%), 25 (20%), 14 (11%), and 7 (6%) patients, respectively. The concordance between reviewers was high with a Kappa coefficient of 0.665. Overall, 102 (83%) patients achieved a CMR at iPET (DS of 1-3) whereas 21 (17 %) had a positive iPET (DS of 4-5). Among the iPET-negative patients, 91% (92/102) of cases achieved a complete response (CR) at the end of induction (eoi), whereas partial response (PR) was observed in 6% (7/102) of cases, and 3% (3/102) had progressive disease (PD). In the iDS 4/5 group, 24% (5/21) of cases achieved a CR, 52% (11/21) had a PR, and 24% (5/21) exhibited PD (Table 2).
End of treatment MR according to Lugano classification and iPET
| Response . | iDS 1-3 . | iDS 4-5 . | Total . |
|---|---|---|---|
| n (%) . | |||
| CR | 92 (90) | 5 (24) | 97 (79) |
| PR | 7 (7) | 11 (52) | 18 (15) |
| PD | 3 (3) | 5 (24) | 8 (6) |
| Total | 102 | 21 | 123 |
| Response . | iDS 1-3 . | iDS 4-5 . | Total . |
|---|---|---|---|
| n (%) . | |||
| CR | 92 (90) | 5 (24) | 97 (79) |
| PR | 7 (7) | 11 (52) | 18 (15) |
| PD | 3 (3) | 5 (24) | 8 (6) |
| Total | 102 | 21 | 123 |
Fisher exact probability <0.001.
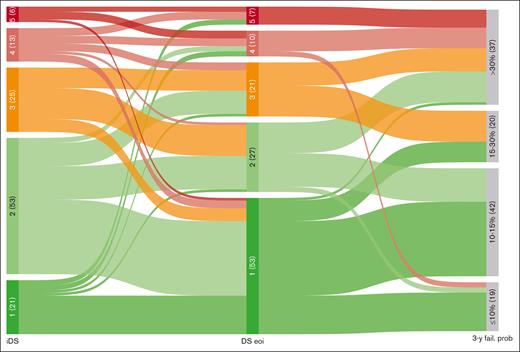
The evolution of DS from interim to final assessment was also examined. Among patients with interim DS 1/2, the majority (78.4%) of them confirmed final DS 1/2, 13.5% progressed to DS 3, and 8.1% progressed to DS 4/5. In the interim DS 3 group, 32% remained at DS 3, whereas 68% regressed to DS 1/2, and none progressed to DS 4/5. Among patients with interim DS 4/5, 57.9% remained in the same category, 26.3% regressed to DS 1/2, and 15.8% regressed to DS 3 (Figure 1).
Evolution of DS from interim to end of treatment assessment. Alluvial plot includes 118 patients paired by iDS and eoiDS (5 patients in iDS were excluded, 2 with iDS 1-3 and 3 with iDS 4-5). 3-y fail. prob, 3-year probability of failure.
Evolution of DS from interim to end of treatment assessment. Alluvial plot includes 118 patients paired by iDS and eoiDS (5 patients in iDS were excluded, 2 with iDS 1-3 and 3 with iDS 4-5). 3-y fail. prob, 3-year probability of failure.
PFS
With a median follow-up of 68 months (range, 1-113), the overall 5-year PFS of our cohort was 64% (95% CI, 55-72) with a total of 43 events observed. Considering the whole population of the trial the group without iPET had similar PFS (66%; 95% CI, 62-70) when compared to the group with iPET available (P = .897). Patients with a negative (DS 1-3) or positive iPET (DS 4/5) had a 5-year PFS of 70% (95% CI, 60-78), and 34% (95% CI, 15-55), respectively, with an HR of 3.26 (95% CI, 1.72-6.18; P < .01; Figure 2).
Additional prognostic factors for PFS in univariate are shown in Table 3.
Univariate and multivariate Cox proportional hazards regression on PFS
| Factor . | Univariable . | P value . | Multivariable . | P value . |
|---|---|---|---|---|
| HR (95% CI) . | HR (95% CI) . | |||
| iDS 4/5 | 3.26 (1.72-6.18) | <.001 | 2.82 (1.47-5.42) | .002 |
| FLIPI-2 3/5 | 2.47 (1.36-4.50) | .003 | 2.79 (1.52-5.12) | .001 |
| Age >60, y | 2.89 (1.55-5.37) | .001 | ||
| Sex, male | 1.39 (0.76-2.53) | .281 | ||
| Hemoglobin <12 mg/dL | 2.63 (1.39-4.98) | .003 | ||
| BM biopsy, positive | 1.30 (0.69-2.43) | .413 | ||
| LoDLIN >6 cm | 1.32 (0.71-2.44) | .385 | ||
| B2M > ULN | 1.19 (0.65-2.16) | .574 | ||
| RB | 0.96 (0.52-1.74) | .882 | ||
| Experimental arm | 2.33 (1.24-4.42) | .009 | 2.15 (1.11-4.14) | .022 |
In addition to DS, we also analyzed ΔSUVmax between the reference lesion at baseline and interim scan (range, −0.9406 to 0.9661; mean, −0.6707; median, −0.7432). ΔSUVmax was strongly correlated with iDS, however it was not confirmed as independent prognostic factor for PFS.
In multivariate analysis, iPET maintained its prognostic significance when adjusted for randomized arm and FLIPI2, with a HR of 2.82 (95% CI, 1.47-5.42). A detailed analysis of interaction of iPET results with FLIPI and FLIPI2 prognostic scores is reported in supplemental Table 4A-B.
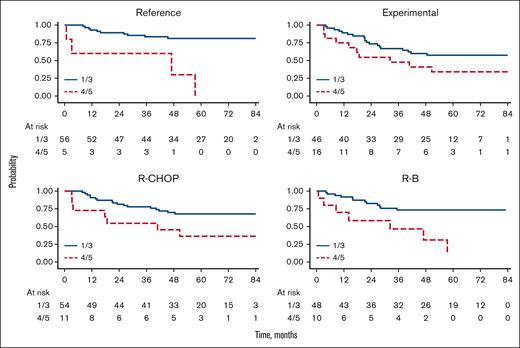
Upon separate analysis of iPET within the randomized arms in the FOLL12 trial, the prognostic role of iPET was mainly confirmed in the reference arm with 5-year PFS of 81% (95% CI, 68-89), and 30% (95% CI, 1-72) for iPET-negative vs iPET-positive, respectively (HR, 6.68; 95% CI, 2.09-21.3; P = .001); whereas, only a trend toward a different PFS was seen in the experimental arm with 5-year PFS of 57% (95% CI, 42-70) and 34% (95% CI, 13-57) for iPET-negative vs iPET-positive, respectively (HR, 1.97; 95% CI, 0.92-4.25; P = .082; Figure 3).
Regarding the role of the induction treatment, iPET was correlated with different risk of progression among both R-CHOP (5-year PFS of 68% [95% CI, 53-79] and 36% [95% CI, 11-63] for iPET-negative vs iPET-positive, respectively [HR 2.69, 95% CI, 1.11-6.49; P = .028]) and R-B treated patients (5-year PFS was 73% [95% CI, 58-84] and 31% [95% CI, 6-62] for iPET-negative and iPET-positive, respectively [HR, 4.10; 95% CI, 1.61-10.4; P = .003]). The interaction analysis for the induction treatment (R-CHOP vs RB) revealed no statistically significant difference observed between the variables with a P value of .518.
Patients with iDS 4 to 5 were significantly more likely to experience progression of disease within 24 months compared to those with iDS 1 to 3 (45% vs 13%; P = .002; supplemental Table 5).
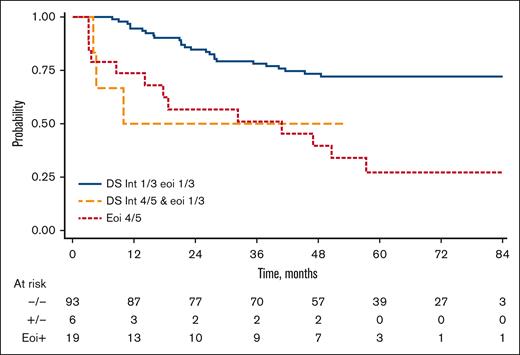
Combining iPET and end of treatment PET (eotPET) results, patients were categorized into 3 distinct groups based on their PFS rates. The first group, consisting of patients with both iPET- and eotPET-negative results, exhibited a 3-year PFS of 78% (95% CI, 68-85). The second group, characterized by positive iPET and negative eotPET results, had a 3-year PFS of 50% (95% CI, 11-80). Finally, patients with positive eotPET results, regardless of iPET outcomes, displayed a PFS of 51% (95% CI, 27-71). The risk of progression was significantly higher for the second and for the third group compared with the first one with an HR of 3.53 (95% CI, 1.06-11.8; P = .040) and HR of 3.64 (95% CI, 1.86-7.12; P < .001), respectively (Figure 4). The impact of positive iPET combined with eotPET was confirmed adjusting for FLIPI2 (HR, 4.44; 95% CI, 1.29-15.2; P = .018) and trial arm (HR, 3.01; 95% CI, 1.51-5.99; P = .002).
OS
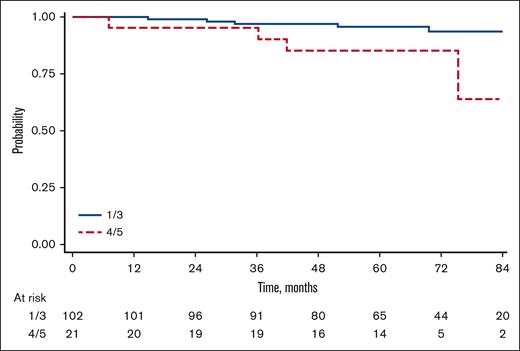
With a total of 11 deaths (including 7 from progression of disease), the 5-year OS of our cohort was 94% (95% CI, 88-97). In univariate analysis patients with iDS 1 to 3 had a 5-year OS rate of 96% (95% CI, 89-98). On the other hand, patients with iDS 4 to 5 had a 5-year OS rate of 85% (95% CI, 61-95) and an HR of 5.74 (95% CI, 1.65-20.0; P = .006; Figure 5).
Discussion
Our study suggests that early MR defined with PET after 4 cycles of induction ICT and defined accordingly to DS, is an early and strong predictor for long-term disease outcomes in patients with FL. Previous studies have investigated the value of iPET in predicting response and survival in FL patients.13-17 Our analysis utilizes data collected prospectively in the multicenter FOLL12 randomized phase 3 trial which investigated a response adapted after induction therapy in patients with FL based on the MR at the end of induction. The trial, which showed shorter PFS with the experimental arm compared with a standard maintenance therapy, allowed the execution of an iPET (performed between fourth and fifth cycle of ICT) which was not used to modify treatment, thus preserving the ability to assess its true prognostic value. Moreover, the use of standardized reading criteria (DS score) in a blinded centralized review of all PET scans adds more value to our findings.
Our results are consistent with those of Dupuis et al,15 a prospective study with a comparable sample size. While Dupuis et al investigated patients treated exclusively with R-CHOP and without maintenance therapy, our cohort included patients treated with either R-CHOP or RB, with 50% receiving rituximab maintenance therapy. Dupuis et al15 reported a 2-year PFS of 86% in patients with a negative PET scan (DS 1-3) at cycle 4, compared to 61% in those with a positive PET scan (DS 4-5). In our study, patients with a negative iPET had a 5-year PFS of 70%, whereas those with a positive interim PET (DS 4-5), constituting 17% of the population, had a 5-year PFS of 34% and an HR of 3.26. Although Dupuis et al15 found no significant impact of interim PET on OS, our analysis revealed an increased risk of death in patients with DS 4-5 (HR, 5.74).
The prognostic impact of iPET remained significant even when compared to eotPET results. iPET positivity was associated with an increased risk of disease progression, even in cases where a negative eotPET result was subsequently achieved, with a HR of 3.53 (95% CI, 1.06-11.8). In multivariate analysis, iPET positivity emerged as a robust prognostic factor independent of other clinical variables, including the FLIPI2 score and the choice of induction chemotherapy regimen.
However, it is important to acknowledge the limitations of the subgroup analysis by treatment regimen. The small sample sizes in both groups (65 in the R-CHOP arm and 58 in the RB arm) and the low proportion of iPET-positive patients (17% in each group; supplemental Table 2) may limit the reliability and generalizability of these findings. Despite these limits, our analysis demonstrated that iPET positivity was consistently associated with a higher risk of disease progression (HR, 2.67; 95% CI, 1.37-5.20), regardless of the randomized treatment arm in the FOLL12 trial.
In our study iPET was able to distinguish early responders to the induction therapy. Indeed, according to the Lugano criteria, 91% of patients with negative iPET results (DS 1-3) achieved a CR and only 3% of patients exhibited a PD at the end of treatment. This high negative predictive value of iPET could allow the exploration of a reduced therapy regimen in this category of patients with the scope to avoid futile therapy related toxicity. In contrast, the positive predictive value of iPET in our study was significantly lower than negative predictive value. In fact, although 24% of patients with positive iPET was confirmed as PD on the eotPET, a substantial 52% had a PR and 24% of patients achieved a CMR.
This finding is consistent with findings of prior studies assessing the predictive role of iPET in other lymphoma subtypes, mostly Hodgkin lymphoma.21 Overall, these data suggest that treatment escalation may not always be appropriate based on the iPET scan result.
Unlike the approach taken in the study by Merryman et al,13 where DS3 was considered a positive scan, we retained DS3 as indicative of a negative scan in our analysis. Our rationale is grounded in the available data, primarily focused on the end-of-treatment assessment, which continues to favor the interpretation of DS3 as a negative scan.12,22 Furthermore, our data indicated that DS3 at iPET had no significant impact on OS (data not shown), further reinforcing our perspective that DS 3 should be considered a negative scan. However, future studies with large datasets are needed to better explore the interpretation of DS3 and its clinical implications in FL.
The FOLL19 trial (ClinicalTrials.gov identifier: NCT05058404), a multicenter randomized phase 3 trial, has been initiated based on this early data. This trial focuses on patients achieving a CR after 4 cycles of ICT. These patients will undergo a modified treatment plan: no further chemotherapy will be administered, and instead, induction will be completed with 4 additional cycles of only the monoclonal antibody used in the initial 4 cycles. The trial aims to deintensify the chemotherapy without compromising survival outcomes. This strategy aligns with the goal of optimizing therapeutic efficacy while minimizing potential treatment-related adverse effects.
Finally, our study benefits from several strengths, including the assessment of patients enrolled in a randomized clinical trial with a well-defined treatment protocol and centralized PET readings. However, it is essential to acknowledge its limitations, such as its retrospective nature, limited sample size, and nonavailability of iPET for all trial participants. Nevertheless, the main characteristics of patients who underwent iPET and those without iPET were not significantly different, and the 5-year PFS rates were similar between these groups, suggesting that iPET implementation did not introduce selection biases or substantial variations in outcomes.
In conclusion, early identification of patients at high risk of progression enables tailoring of response-adapted treatment strategies, potentially improving outcomes. Importantly, iPET-negative patients may be suitable candidates for reduced therapy, mitigating the risk of treatment-related toxicity. As the FOLL19 trial continues, it may help to further explore these findings.
Authorship
Contribution: S.L., A.V., L.G., and S.C. conceived and designed the study; A.P., I.D.G., M.C., P.C., E.A., P.T., R.F., F. Ballerini, A.B., D.P., P.L.Z., S.B., L.F., A.L., J.O., and M.M. provided study materials or patients; R.D., F. Bergesio, F.F., and L.M. collected and assembled the data; R.D., S.L., A.V., L.M., L.G., S.C., and F.F. analyzed and interpreted the data; R.D., S.L., L.G., S.C., and A.V. wrote the manuscript; and all authors approved the final manuscript.
Conflict-of-interest disclosure: The authors declare no competing financial interests.
Correspondence: Stefano Luminari, Hematology Unit, Azienda Unità Sanitaria Locale-Istituto di Ricerca e Cura a Carattere Scientifico di Reggio Emilia, via Amendola 2, 42122 Reggio Emilia, Italy; email: Stefano.Luminari@ausl.re.it.
References
Author notes
Individual participant data that underlie the results reported in this article, after deidentification, can be made available to investigators for research purposes on a case-by-case basis following the time of this publication and in accordance with the Fondazione Italiana Linfomi Data Sharing Policy.
Data pertaining to the study are available upon request to the corresponding author, Stefano Luminari (Stefano.Luminari@ausl.re.it).
The full-text version of this article contains a data supplement.

