Key Points
Lymphopenia at diagnosis and follow-up predicts inferior OS in patients with MM.
ALC is a readily available biomarker and predictor of outcomes in newly diagnosed MM treated with standard therapy.
Visual Abstract
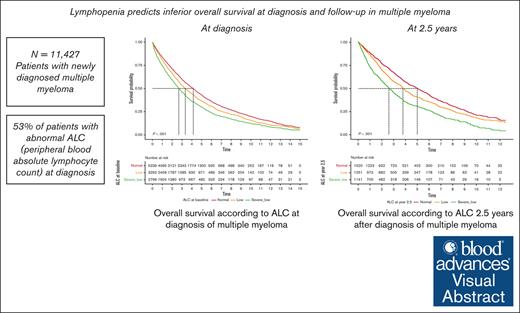
Bone marrow microenvironment plays an important role in promoting growth and survival of multiple myeloma (MM) cells. The tumor-promoting immune microenvironment is augmented while antitumor immune responses are inhibited. Although clinical and genomic markers of high-risk MM have been described, the immune status is just being recognized as a potential mediator of disease behavior. This is even more important with the development of a number of immune-based therapies. Based on these considerations, we evaluated peripheral blood absolute lymphocyte count (ALC) as an easily accessible marker representing immune microenvironment at diagnosis and after treatment of MM. We retrospectively evaluated 11 427 patients diagnosed with MM between 2000 and 2019 at Veterans Administration hospitals using ALC obtained closest to diagnosis and up to 2.5 years thereafter. Patients were stratified into 3 ALC categories: severely low, low, and normal (<1 × 10³/μL, 1 × 10³/μL to 1.5 × 10³/μL, and >1.5 × 10³/μL, respectively). Lymphopenia (including severely low and low ALC) was present in 53% of patients at MM diagnosis and was associated with inferior overall survival (OS). The median OS for patients with severely low, low, and normal ALC at diagnosis was 2.7, 3.3, and 4.2 years (P < .001), respectively. Moreover, persistent or new development of lymphopenia during treatment and follow-up was also associated with inferior OS. Our findings support the use of ALC as a biomarker for risk stratification in MM.
Introduction
In multiple myeloma (MM), clonal plasma cells evade immune surveillance and proliferate within an immunosuppressive bone marrow microenvironment. For this to occur, effector T cells in the bone marrow first undergo T-cell exhaustion, possibly due to persistent stimulation by MM cells and associated inflammation. T-cell exhaustion is characterized by a progressive but reversible loss of effector function that eventually results in immunosenescence.1 During and after T-cell senescence, the remaining T cells, especially T-helper 17 cells, undergo phenotypic and functional changes that support a proinflammatory bone marrow niche.2-4 This leads to an upregulation of immunosuppressive cells such as regulatory T cells and myeloid-derived suppressor cells within the bone marrow.5 Thus, the newly adapted bone marrow niche promotes MM cell growth and reinforces immune evasion at the expense of host immune responses.4,6
Immune dysregulation, T-cell exhaustion, and immunosenescence in the bone marrow microenvironment result in peripheral blood lymphopenia, with a reduced proportion of CD4+ T cells and a normal proportion of CD8+ T cells in the peripheral blood of patients with MM.2,7,8 Studies have also shown that levels of T cells (both CD4+ and T-helper 17 cells) correlate with International Staging System (ISS) stage, presence of lytic bone lesions, treatment responses, and survival in MM, suggesting that conventionally obtained cell counts could serve as disease biomarkers over time.8-13 Although the revised ISS incorporates inflammatory markers (β2-microglobulin [β2m], albumin, and lactate dehydrogenase [LDH]) and genetic abnormalities for prognostication in MM at diagnosis, this risk model does not account for dynamic changes within the underlying immune milieu.14,15 We previously studied absolute monocyte count as a surrogate for the state of the bone marrow immune microenvironment in MM and found that absolute monocyte count at diagnosis and in follow-up was associated with inferior overall survival (OS).16 Because immune dysregulation and immunosenescence in the bone marrow microenvironment are reflected in the peripheral blood lymphocyte count and peripheral blood markers may, in turn, correlate with clinical features and outcome in MM, we sought to identify clinical features correlating with peripheral blood lymphopenia and evaluate absolute lymphocyte count (ALC) at diagnosis as a predictor of outcome in MM and in the context of standard induction treatment.
Methods
Patients
We conducted a retrospective cohort study using data from the Veterans Affairs (VA) Corporate Data Warehouse, which collates electronic health record and cancer registry data from VA facilities nationwide. We included all patients diagnosed with MM between 1 January 2000 and 31 December 2019. Patients were identified using the ninth and tenth editions of the International Classification of Diseases (ICD) codes for MM and were required to have the following: (1) at least 3 visits with an MM ICD code on separate days; (2) treatment with at least 1 MM drug (besides corticosteroids) on or after the date of diagnosis; and (3) at least 1 ALC measurement recorded on or within 90 days before diagnosis date, in which the date of diagnosis was the date of the first MM treatment. Because other hematologic malignancies are associated with abnormal ALC, we excluded patients with acute and chronic leukemias, aplastic anemia, myelodysplastic syndrome, hairy cell leukemia, or myeloproliferative neoplasms before MM diagnosis. If patients developed 1 of these conditions during follow-up, we stopped observing and censored follow-up data from the date on which the condition was diagnosed. The time to follow-up from baseline was defined as the time from diagnosis until the development of another hematologic malignancy, death, truncation date (15 years after MM diagnosis), or the study end date, whichever came first. Follow-up analyses were subsequently conducted using 6-month indices from diagnosis date to up to 2.5 years thereafter. Eligible patients were followed through 31 December 2019.
Study variables and assessments
We defined variables at baseline and during follow-up at 6-month intervals until 2.5 years after diagnosis. Baseline data included the date of diagnosis, age, sex, race, ethnicity, serum LDH, β2m, serum albumin, serum creatinine, Charlson comorbidity index (CCI), and era of treatment. Follow-up variables included exposure to systemic therapy with RVd (lenalidomide, bortezomib, and dexamethasone), in which treatment presumed to be induction agent based on administration within the first 6 months after diagnosis date. Age, sex, race, and ethnicity were defined based on structured data in the Corporate Data Warehouse. Age was used as a continuous variable. Race categories included Black, White, and other. Baseline data including serum albumin and β2m were used to calculate stage; in turn, stage was classified according to the ISS, which is known to be associated with OS in newly diagnosed MM. Era of treatment was stratified into 3 categories: <2007, 2007 to 2012, and ≥2012. Stage at baseline was calculated according to the ISS definition using the closest serum albumin and β2m measurements before the index date. CCI was defined based on ICD-10 codes.
We obtained baseline and follow-up ALC in patients whose ALC was measured using an automated or manual differential. We used the ALC within 90 days before and closest to MM diagnosis and then at 6-month intervals until 2.5 years after diagnosis. We chose this cutoff of 2.5 years based on the median OS of our cohort. ALC at the time point of interest was used to assign patients to ALC categories for the final analysis. Patients were stratified into 3 ALC categories: severely low (<1 × 10³/μL), low (1 × 10³/μL to 1.5 × 10³/μL), and normal (>1.5 × 10³/μL), in which lymphopenia was defined based as an ALC <1.5 × 10³/μL per institutional reference ranges. To avoid using treatment-related changes in ALC, we excluded any ALC obtained within 7 days of an abnormal neutrophil count.
Statistical analysis
Descriptive statistics, including means, medians, and interquartile ranges, were used to summarize demographic and baseline characteristics of all patients. We compared baseline characteristics between the 3 ALC groups using the nonparametric Kruskal-Wallis test for continuous variables and the χ2 test for categorical variables. The primary outcome was OS estimated using the Kaplan-Meier method and log-rank tests. Survival analysis at each time interval included patients who had available laboratory data, in which treatment was included as a time-varying covariate. We used Cox proportional hazard models, with adjustment for age, race, CCI, smoking status, ISS, LDH, creatinine, and era of treatment to obtain hazard ratios (HRs). Subsequent analyses were performed starting from follow-up time points. Missing data were imputed using the multiple imputation by chained equations method. The statistical analysis was performed using R version 4.0.3 software package. All statistical tests were 2 sided, and a P value < .05 was considered statistically significant.
Study oversight
This study was approved by the VA Boston Research and Development committee as an exempt study before data collection and analysis, with a waiver of informed consent due to the use of existing data, per the Common Rule.
Results
From 1 January 2000 and 31 December 2019, a total of 11 427 patients with newly diagnosed MM at national VA medical centers met the inclusion criteria. Demographic and clinical characteristics are outlined in Table 1. The median age at diagnosis was 69.8 years (interquartile range, 63.0-76.8), and 98% of patients were male. Lymphopenia (severely low and low ALC) was present in 53% of patients at MM diagnosis (6088 of 11 427 patients), in which 24% and 29% of patients had severely low and low ALC, respectively. White patients were more likely to have lymphopenia than Black patients at the time of MM diagnosis (56% vs 46%; P < .001) Moreover, 57% of patients aged ≥65 years had lymphopenia at MM diagnosis. Approximately 77% of evaluable patients in the overall cohort met the criteria for ISS stage II and III MM.
Demographics and clinical characteristics of patients with MM at diagnosis included in study (N = 11 427)
| . | ALC, ×103/μL . | P value . | |||
|---|---|---|---|---|---|
| Overall . | Severely low . | Low . | Normal . | ||
| Number of patients, n (%)∗ | 11 427 | 2796 (24) | 3292 (29) | 5339 (47) | |
| Age at diagnosis, median (IQR), y | 69.8 (63.0-76.8) | 71.2 (64.7-77.7) | 70.6 (64.2-77.2) | 68.4 (61.5-75.9) | <.001 |
| Median follow-up, median (IQR) | 2.3 (0.9-4.5) | 1.9 (0.7-3.9) | 2.2 (0.9-4.4) | 2.6 (1.1-4.9) | <.001 |
| Age ≥65 y at diagnosis | 7 782 | 2074 (26.7) | 2359 (30.3) | 3349 (43.0) | <.001 |
| Male sex, n (%) | 11 142 | 2745 (24.6) | 3234 (29.0) | 5163 (46.3) | <.001 |
| Race, n (%) | <.001 | ||||
| Black | 2 942 | 558 (19.0) | 788 (26.8) | 1596 (54.2) | |
| White | 6 880 | 1786 (26.0) | 2045 (29.7) | 3049 (44.3) | |
| Other | 157 | 39 (24.8) | 40 (25.5) | 78 (49.7) | |
| Ethnicity, n (%) | <.001 | ||||
| Hispanic or Latino | 561 | 121 (21.6) | 148 (26.4) | 292 (52.0) | |
| Not Hispanic or Latino | 9 712 | 2331 (24.0) | 2817 (29.0) | 4564 (47.0) | |
| Smoking status (%) | <.001 | ||||
| Never | 2 224 | 594 (26.7) | 676 (30.4) | 954 (42.9) | |
| Current/former | 8 402 | 1947 (23.2) | 2376 (28.3) | 4079 (48.5) | |
| CCI score† | <.001 | ||||
| No comorbidities or mild (1-2) | 6 417 (56.2) | 1510 (54.0) | 1837 (55.8) | 3070 (57.5) | |
| Moderate (3-4) | 3 327 (29.1) | 823 (29.4) | 950 (28.9) | 1554 (29.1) | |
| Severe (>5) | 1 187 (10.4) | 328 (11.7) | 350 (10.6) | 509 (9.5) | |
| Distribution of ISS stages across the 3 ALC groups, n (%)† | <.001 | ||||
| Stage I | 1 369 (12.0) | 257 (9.2) | 390 (11.8) | 722 (13.5) | |
| Stage II | 2 362 (20.7) | 517 (18.5) | 655 (19.9) | 1190 (22.3) | |
| Stage III | 2 308 (20.2) | 569 (20.4) | 658 (20.0) | 1081 (20.2) | |
| β2m | <.001 | ||||
| β2m >3.5 μg/mL (%) | 3 838 | 875 (22.8) | 1102 (28.7) | 1861 (48.5) | |
| Serum albumin† | <.001 | ||||
| Albumin <3.5 g/dL (%) | 5 228 (45.8) | 1410 (50.4) | 1452 (44.1) | 2366 (44.3) | |
| Albumin, median (IQR), g/dL | 3.5 (3.0-3.9) | 3.4 (2.9, 3.8) | 3.5 (3.0-3.9) | 3.5 (3.0-3.9) | |
| Creatinine, median (IQR), mg/dL | 1.2 (1.0-1.8) | 1.2 (1.0-1.9) | 1.3 (1.0-1.8) | 1.2 (1.0-1.7) | .309 |
| Serum LDH | <.001 | ||||
| LDH >243 U/L, n (%) | 1 221 | 325 (26.6) | 339 (27.8) | 557 (45.6) | |
| MM diagnosis date, n (%) | .023 | ||||
| <2007 | 2 727 | 724 (26.5) | 794 (29.1) | 1209 (44.3) | |
| ≥2007 to <2012 | 2 702 | 652 (24.1) | 782 (28.9) | 1268 (46.9) | |
| ≥2012 | 5 998 | 1420 (23.7) | 1716 (28.6) | 2862 (47.7) | |
IQR, interquartile range.
Data available for 9979 patients (87.3%) on race, 10 273 patients (90%) on ethnicity, 10 626 patients (93%) on smoking status, 10 931 patients (96%) on CCI score, 6039 patients (53%) on stage, 6079 patients (53%) on β2m, and 6146 patients (54%) on LDH.
Denotes column percentages.
Inferior OS in patients with lymphopenia at diagnosis
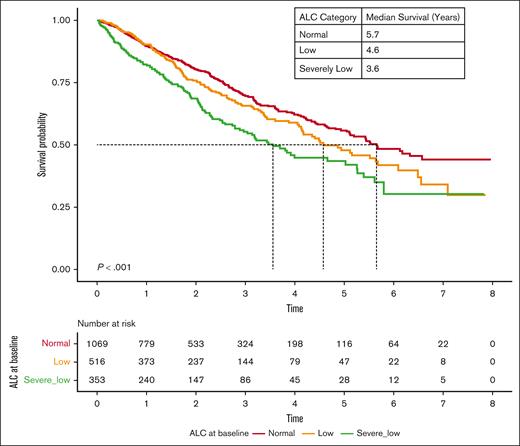
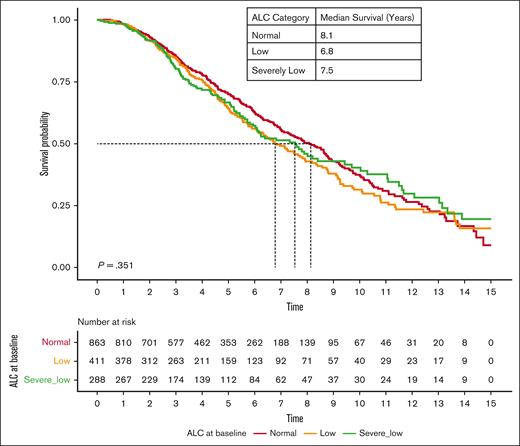
The OS of patients with lymphopenia at diagnosis was significantly lower than that of patients with normal ALC. The median OS of patients with severely low, low, and normal ALC at diagnosis was 2.7, 3.3, and 4.2 years (P < .001), respectively (Figure 1). Interestingly, RVd induction did not overcome inferior outcomes in patients with lymphopenia, with a median OS of 3.6 years, 4.6 years, and 5.7 years among patients with severely low, low, and normal baseline ALC, respectively (P < .001; Figure 2). However, the impact of lymphopenia on outcome was not observed in patients who underwent stem cell transplant (OS: severely low ALC, 7.6 years; low ALC, 6.8 years; and normal ALC, 8.1 years; P = .351; Figure 3).
OS based on ALC at diagnosis of MM. Kaplan-Meier curves of OS based on ALC at diagnosis of MM.
OS based on ALC at diagnosis of MM. Kaplan-Meier curves of OS based on ALC at diagnosis of MM.
OS based on baseline ALC at MM diagnosis among patients who received standard induction therapy with RVd.
OS based on baseline ALC at MM diagnosis among patients who received standard induction therapy with RVd.
OS based on baseline ALC at MM diagnosis among patients who received autologous stem cell transplant at age <70 years.
OS based on baseline ALC at MM diagnosis among patients who received autologous stem cell transplant at age <70 years.
Lymphopenia during follow-up is associated with poor OS
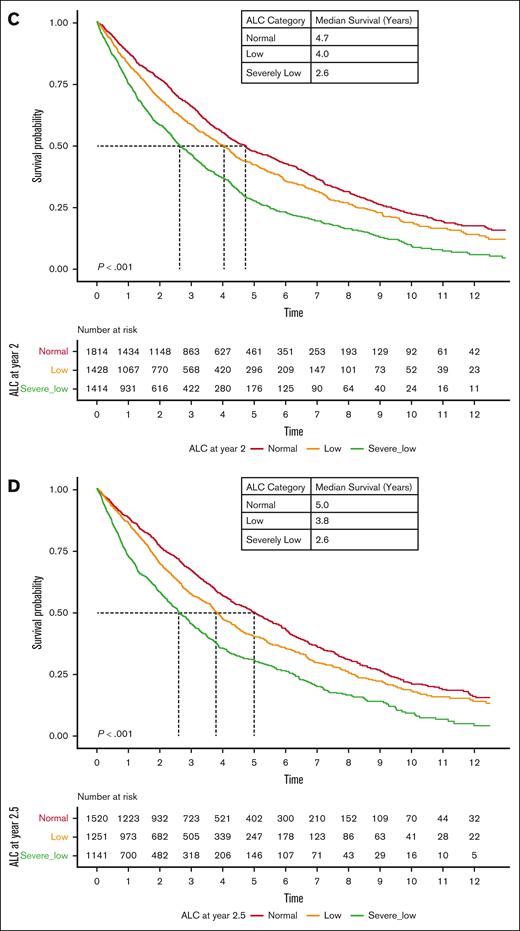
We evaluated ALC at follow-up time points after induction therapy. Appearance or persistence of lymphopenia at follow-up after induction was associated with poor OS. In particular, lymphopenia at 0.5, 1, 2, and 2.5 years after MM diagnosis was associated with significantly lower OS at all follow-up time points (Figure 4). The median OS at 0.5 year of MM follow-up was 3.2, 3.9, and 4.2 years (P < .001); the median OS at 1 year was 3.0, 4.0, and 4.3 years (P < .001); the median OS at 2 years was 2.6, 4.0, and 4.7 years (P < .001); and the median OS at 2.5 years was 2.6, 3.8, and 5.0 years (P < .001) among patients with severely low, low, and normal ALC, respectively. We further evaluated whether developing lymphopenia at MM follow-up was predictive of outcome. Patients who developed lymphopenia >0.5 year after MM diagnosis experienced inferior outcomes compared with those who maintained a normal ALC (supplemental Figures 1-3).
OS based on ALC during follow-up of MM, independent of baseline ALC. (A-D) Kaplan-Meier curves of OS based on ALC 0.5 years (A), 1 year (B), 2 years (C), and 2.5 years (D) after MM diagnosis.
OS based on ALC during follow-up of MM, independent of baseline ALC. (A-D) Kaplan-Meier curves of OS based on ALC 0.5 years (A), 1 year (B), 2 years (C), and 2.5 years (D) after MM diagnosis.
Lymphopenia is independently associated with adverse outcomes in the era of novel therapies
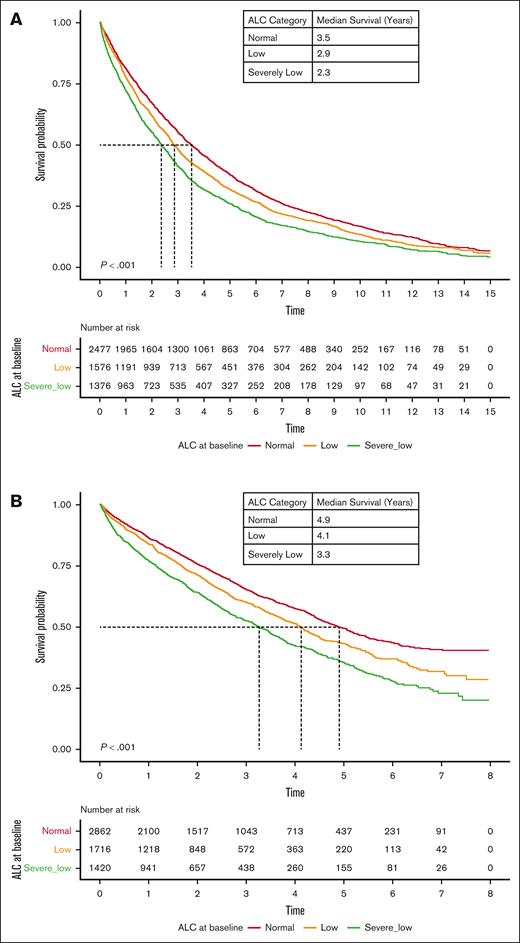
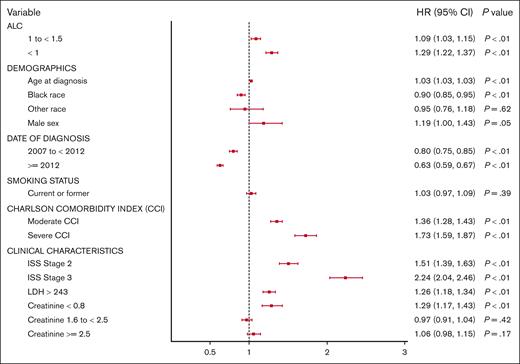
We further evaluated whether the prognostication afforded by ALC would persist with the use of novel agents. We compared the impact of ALC on the OS of patients treated before or after 2012 when novel agents were universally used in the VA health care system. As anticipated, the median OS improved across all ALC groups in patients with MM diagnosed after 2012. However, the median OS was 2.4, 2.9, and 3.5 years (P < .001) among patients with severely low, low, and normal ALC diagnosed before 2012, respectively, compared with their counterparts treated after 2012 with a median OS 3.3, 4.1, and 4.9 years (P < .001; Figure 5). Moreover, multivariable analyses performed including validated predictors of OS at MM diagnosis (age, ISS stage, and LDH) demonstrated that lymphopenia is an independent prognostic factor predicting poor outcomes (low ALC category [HR, 1.09; 95% confidence interval, 1.03-1.15; P < .01]; and severely low ALC category [HR, 1.29; 95% confidence interval, 1.22-1.37; P < .01]) at diagnosis (Figure 6).
OS based on baseline ALC at MM diagnosis with respect to the era of diagnosis and treatment. (A) <2012. (B) ≥2012.
OS based on baseline ALC at MM diagnosis with respect to the era of diagnosis and treatment. (A) <2012. (B) ≥2012.
Multivariable analysis of the main prognostic factors for OS at diagnosis of MM. CI, confidence interval.
Multivariable analysis of the main prognostic factors for OS at diagnosis of MM. CI, confidence interval.
Discussion
Previous studies have suggested that peripheral blood lymphopenia could reflect immune dysregulation, T-cell exhaustion, and subsequent immunosenescence in the bone marrow, which supports MM cell growth and immune evasion. We further demonstrate here that lymphopenia at diagnosis and follow-up predicts OS in MM. For patients with normal ALC at diagnosis, developing an abnormal ALC after diagnosis similarly confers inferior survival compared with those who maintain a normal ALC. ALC also predicts adverse outcomes independent of validated prognostic markers, including prediction tools such as CCI. These results are consistent with prior studies suggesting that ALC is an independent prognostic factor for OS at MM diagnosis.17-19 Unlike prior studies, however, our cohort represents, to our knowledge, the largest study examining this phenomenon during diagnosis and follow-up, without the need to incorporate neutrophil count, and in the context of novel therapeutic agents that mirror the rapidly evolving array of treatment options available to real-world patients.
We observed that, despite receiving combination therapy with lenalidomide and bortezomib, those with severely low ALC had the worst survival. This could suggest that even treatments targeting T-cell activity may not surmount the negative prognostication afforded by lymphopenia, leading us to believe that more complex mechanisms are at play. At the molecular level, the thalidomide derivative lenalidomide stimulates T-cell proliferation via the T-cell receptor and augments cytotoxic T lymphocyte effector cell activity against MM cells.20 In turn, the proteasome inhibitor bortezomib allows for myeloma cells to become sensitive to T-cell–mediated killing and simultaneously impairs T-cell function, resulting in a net depletion of myeloma cells.21 The detrimental effects of immune dysregulation, T-cell exhaustion, and immunosenescence in patients with lymphopenia may negatively affect the immunomodulatory mechanisms of these therapies. Moreover, patients with lymphopenia may be more susceptible to infections that contribute to worse outcomes. Interestingly, hematopoietic stem cell transplantation improved MM survival across ALC categories, suggesting that hematopoietic stem cell transplantation may in fact overcome the negative prognostication afforded by ALC. It can be postulated that reconstitution of the marrow with transplanted stem cells may provide improved immune function and with it a change in overall outcome. This area of stem cell biology and T-cell function may require further investigation.
It remains speculative how and why lymphopenia may affect outcome. Both a cause and/or effect relationship can be imputed. The low lymphocyte count may reflect the effect of MM on immune repertoire and the change in T-cell numbers may indirectly highlight MM cell activity and associated risk features. On the contrary, it is also very likely that the lack of immune surveillance may affect and/or augment MM cell growth and eventual poor outcome. Interestingly, White patients were more likely to have lymphopenia than Black patients. Potential confounders include age at diagnosis, because White patients in this cohort tended to be older, and older patients were more likely to have lymphopenia. These data could further support prior studies suggesting that Black patients with MM have better survival than White patients with equal access to therapies.22,23
One of the limitations of our study is that the majority of participants are male by virtue of being conducted in the US VA system. Moreover, we cannot completely ascribe all instances of lymphopenia to underlying MM, because it is difficult to rule out commonly encountered causes of other treatment in this relatively older population.24 In addition, alkylating agents such as cyclophosphamide and melphalan prescribed during the MM treatment course could contribute to or exacerbate lymphopenia. However, given the marked and enduring survival differences within the lymphopenic cohorts, we posit that the major driver of lymphopenia is the underlying disease process rather than treatment effect. Because proinflammatory cytokines such as interleukin-6 are involved in the maintenance of the myelomatous tumor microenvironment and mediate lymphopenia,25,26 future studies can incorporate these measurements to corroborate these mechanisms.
In conclusion, we illustrate that the peripheral blood ALC is a readily available biomarker that can offer prognostication over time. Based on our results, ALC measured every 6 months during the initial 2 years of MM treatment could identify patients with poor prognosis. If these peripheral blood markers were incorporated into predictive models during treatment, clinicians would have access to dynamic indicators of host immune system, irrespective of scoring or adverse cytogenetics at diagnosis, guiding the use of risk-adapted treatment strategies. Furthermore, because the host immune system may also promote clonal plasma cell resistance to drugs, we propose that white blood cell counts may help predict differential survival between treatments. These features will become even more important as we incorporate newer immunological therapies including use of bispecific antibodies and chimeric antigen receptor T-cell therapy. Adaptation of the immune milieu in the bone marrow correlates with high-risk clinical features and poor clinical outcomes in MM, highlighting the need to incorporate prognostic biomarkers that potentially reflect this phenomenon in risk-stratification methods.
Acknowledgments
The authors thank the National Institutes of Health (NIH), National Cancer Institute (grants P01-155252-07, including supplements 3P01CA155258-07S1 and 3P01CA155258-07S2), Department of Veterans Affairs (VA; research funding 1I01BX001584), NIH Artificial Intelligence/Machine Learning Consortium to Advance Health Equity and Researcher Diversity Program (grant 1OT2OD032581-01 [C.V.E. and N.R.F.]), American Society of Hematology-Hematology Opportunities for the Next Generation of Research Scientists Award for residents (G.M.F.), and the VA Cooperative Studies Program (N.R.F.) for funding this research.
The views expressed in this article are those of the authors and do not necessarily reflect the position or policy of the Department of VA or the US government.
Authorship
Contribution: G.M.F., C.Y., N.C.M., N.R.F., and C.V.E. designed research and interpreted results; C.Y. performed the research and analyzed data; G.M.F. wrote the manuscript; J.P. contributed to the discussion; and all authors edited the manuscript.
Conflict-of-interest disclosure: N.R.F. reports receiving research funding from Merck. N.C.M. reports consultancy or an advisory role with Adaptive, Amgen, Bristol Myers Squibb, Celgene, Janssen, Novartis, Pfizer, Legend, and Takeda, and stocks with OncoPep and DCT. The remaining authors declare no competing financial interests.
Correspondence: Camille V. Edwards, Boston Medical Center, FGH Building, 820 Harrison Ave, 1st Floor, Boston, MA 02118; email: caedward@bu.edu.
References
Author notes
G.M.F. and C.Y. are joint first authors.
N.R.F. and C.V.E. are joint senior authors.
Individual-level data underlying this study are available to researchers with Veterans Affairs (VA) regulatory approval, consistent with VA policy.
The full-text version of this article contains a data supplement.

