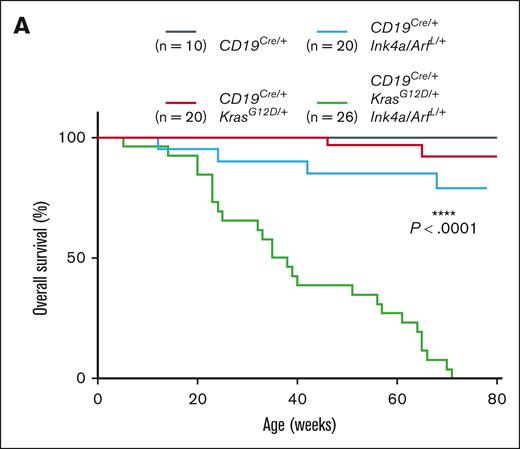
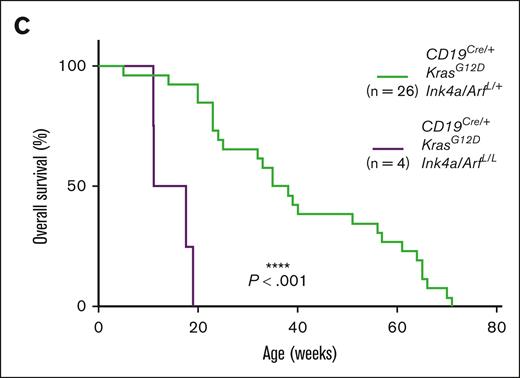
Due to an error in figure preparation, which inadvertently included additional experimental mice of the same genotype, the incorrect number of CD19Cre/+; KrasG12D/+; Ink4a/ArfL/+ mice is depicted in the survival curves of Figure 3A (p. 2368) and Figure 5C (p. 2370). In both figures, the group should comprise 26 mice. The corrected Figure 3A and Figure 5C are shown below.
Development of a clonal low-grade B-cell lymphoma and pre-B-ALL in engineered mice. (A) Kaplan-Meier survival plots illustrating overall survival of mouse cohorts according to genotype. P values were calculated by using the log-rank test.
Development of a clonal low-grade B-cell lymphoma and pre-B-ALL in engineered mice. (A) Kaplan-Meier survival plots illustrating overall survival of mouse cohorts according to genotype. P values were calculated by using the log-rank test.
Loss of heterozygosity of the Ink4a/Arf (Cdkn2a) locus in pre-B-ALL. (C) Kaplan-Meier survival plot illustrating the impact of homozygous Ink4a/Arf deletion on survival of mice with KrasG12D mutation in the B-cell compartment. P values were calculated by using the log-rank test.
Loss of heterozygosity of the Ink4a/Arf (Cdkn2a) locus in pre-B-ALL. (C) Kaplan-Meier survival plot illustrating the impact of homozygous Ink4a/Arf deletion on survival of mice with KrasG12D mutation in the B-cell compartment. P values were calculated by using the log-rank test.
The median survival times for all 4 groups of aging mice for Figure 3A and 5C are available as a supplemental file in the online version of this erratum.


