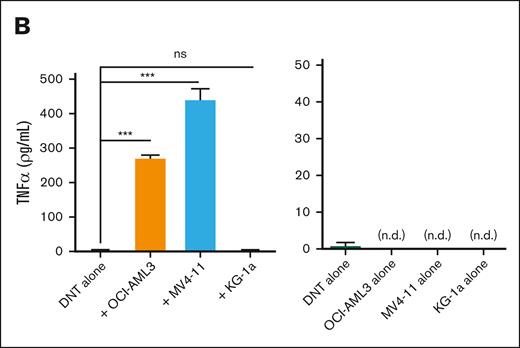
CD64 expression on susceptible AML cells trigger DNTs to produce TNFα. (A-B) DNTs and AML cells were cultured alone or together for 2 hours. The intracellular expression of TNFα was measured on DNTs (CD3+CD33–) by flow cytometry. The bar graph shows the percentage expression (left), and the flow plot shows a representative histogram with MFI values (right) (A). The level of TNFα in the supernatants of cocultures (left) and AML or DNT cell alone groups (right) were determined by enzyme-linked immunosorbent assay (ELISA) (B). The experiments were performed in triplicates. The data shown are representative of 2 independent experiments.
CD64 expression on susceptible AML cells trigger DNTs to produce TNFα. (A-B) DNTs and AML cells were cultured alone or together for 2 hours. The intracellular expression of TNFα was measured on DNTs (CD3+CD33–) by flow cytometry. The bar graph shows the percentage expression (left), and the flow plot shows a representative histogram with MFI values (right) (A). The level of TNFα in the supernatants of cocultures (left) and AML or DNT cell alone groups (right) were determined by enzyme-linked immunosorbent assay (ELISA) (B). The experiments were performed in triplicates. The data shown are representative of 2 independent experiments.

