Key Points
Complex gene rearrangement events that resulted in unexpressed RhCE protein were identified in a D-- family, despite intact RHCE gene exons.
By integration of multiple technologies, previously unrecognized complexity in both common and uncommon RH hybrid structures were uncovered.
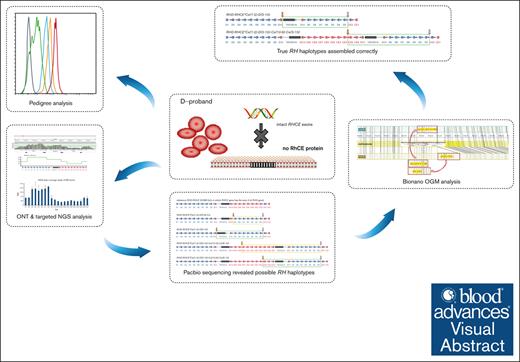
Visual Abstract
Phenotype D-- is associated with severe hemolytic transfusion reactions and hemolytic disease of the fetus and newborn. It is typically caused by defective RHCE genes. In this study, we identified a D-- phenotype proband and verified Rh phenotypes of other 6 family members. However, inconsistent results between the phenotypic analysis and Sanger sequencing revealed intact RHCE exons with no mutations in the D-- proband, but the protein was not expressed. Subsequent whole-genome sequencing by Oxford Nanopore Technologies of the proband revealed an inversion with ambiguous breakpoints in intron 2 and intron 7 and copy number variation loss in the RHCE gene region. Given that the RHCE gene is highly homologous to the RHD gene, we conducted a comprehensive analysis using Pacific Biosciences long-read target sequencing, Bionano optical genome mapping, and targeted next-generation sequencing. Our findings revealed that the proband had 2 novel recombinant RHCE haplotypes, RHCE∗Ce(1-2)-D(3-10) and RHCE∗Ce(1-2)-D(3-10)-Ce(10-8)-Ce(3-10), with clear-cut breakpoints identified. Furthermore, the RH haplotypes of the family members were identified and verified. In summary, we made, to our knowledge, a novel discovery of hereditary large inversion and recombination events occurring between the RHD and RHCE genes, leading to a lack of RhCE expression. This highlights the advantages of using integrated genetic analyses and also provides new insights into RH genotyping.
Introduction
The Rhesus (Rh) blood group is one of the most polymorphic and immunogenic human blood group systems, which consists of >50 independent antigens encoded by RHD and RHCE.1,2 Among these antigens, D, C, c, E, and e are considered the most important in the Rh blood group. The 2 closely linked genes RHD and RHCE lie in a tail-to-tail configuration, separated by TMEM50A. RHD and RHCE are thought to derive from ancient gene duplication events based on the accumulation of mutations between them.3 Therefore, these 2 genes are highly homologous, with only 3% variation in their coding regions.4
The D-- phenotype is very rare, characterized by the complete absence of C, c, E, and e antigens, and it usually exhibits elevated D antigen expression in red blood cells (RBCs). Case reports of the D-- phenotype have been published for various ethnic groups.5-8 The common mechanism of the D-- phenotype is genomic rearrangements between the closely linked homologous genes RHD and RHCE, resulting in RHCE∗CE-D-CE hybrid alleles.9-13 Other identified molecular mechanisms responsible for the D-- phenotype include single-nucleotide deletions10,14 and altered RNA splicing sites.15 Individuals with D-- phenotype can produce various alloantibodies, including anti-Rh17(Hr0), during pregnancy, blood transfusion, or transplantation. This alloantibody can react with all common Rh phenotypes, complicating its management during pregnancy or transfusion. Anti-Rh17(Hr0) can result in mild-to-severe hemolytic reactions, including hemolytic disease of the fetus and newborn (HDFN) and severe hemolytic transfusion reactions.16-18
Here, we report the case of a proband with the D-- phenotype and her family. Sanger sequencing of all exons of the RHCE gene showed no obvious single-nucleotide point mutations, segment mutations, or deletions. This appearance illustrates, to some extent, that the exons of the RHCE gene are integrated. Therefore, we speculated that the molecular basis of this D-- phenotype may involve structural variants (SVs) within RHCE gene. Various platforms have been used for SV detection, including Optical Genome Mapping (OGM; BioNano Saphyr, Bionano Genomics, San Diego, CA), Oxford Nanopore Technologies (ONT; PromethION, Oxford Nanopore Technologies Ltd, Oxford, United Kingdom), Single-Molecule Real Time sequencing (Sequel II systems; PacBio, CA), and next-generation sequencing (NGS; DNBSEQ-T7, Shenzhen, China). This analysis enabled us to identify a complex structural variation of the RHCE∗Ce(1-2)-D(3-10)-Ce(10-8)-Ce(3-10) allele and an RHCE∗Ce(1-2)-D(3-10) hybrid allele in the 2 RHCE alleles of the proband. In addition, inheritance of these 2 complex recombinant alleles within the RHCE gene was shown through testing of family members, which included the complex RHCE null allele with a large fragment inversion.
Materials and methods
Blood samples
Peripheral whole-blood samples were obtained from the proband and her family at the Weifang People’s Hospital. Control and random samples were obtained from the Shanghai Blood Center. Informed consent was obtained from all participants before blood collection.
Serotyping
RBCs from the family members were prepared in 2% to 5% suspensions of fresh saline. The D, C, E, c, and e statuses of all erythrocytes were determined using routine serological methods. Anti-D (Clone: Rum-1), anti-C (Clone: MS-24), anti-E (Clone: MS-80, MS-258), anti-c (Clone: MS-33), and anti-e (Clone: MS-16, MS-21, MS-63) antibodies were obtained from Shanghai Blood Biology Co Ltd (Shanghai, China).
RHCE Sanger sequencing
For genotype analysis of the D-- proband and her family members, DNA samples extracted from peripheral blood were tested for RHCE exons using polymerase chain reaction. RHCE-specific primers were used to amplify 10 exons and intron-exon junctions as previously described.19 Polymerase chain reaction products were sent to Beijing Genomics Institution (BGI, China) for Sanger sequencing.
Flow cytometry analysis
Immunostaining of RBCs from family members was performed using anti-D (IBGRL, Clone: BRAD 3) and anti-RH–related (IBGRL, Clone: BRIC 69) monoclonal antibodies. RBCs were diluted with phosphate-buffered saline to 3% of their original concentrations before staining. Antibodies were added to the RBC suspension in equal volume and incubated for 30 minutes at 37°C and then washed. Fluorescent PE- or V450-conjugated anti-human Immunoglobulin G second antibodies were incubated with the above cells for 30 minutes at 4°C, washed, and immediately analyzed using flow cytometry (CytoFlex LX flow cytometer, Beckman). Control RBCs were obtained from random donor samples of different phenotypes (D-, Dv, and random genotypes) and erythrocytic panel cells (RR and Rr). The study included 3 samples in the RR group: R1R1 (number 10 from erythrocytic panel cells, REAGENS, LOT number 732111), R2R2 (number 2 from erythrocytic panel cells, REAGENS, LOT number 732111), and R1WR1 (number 1 from erythrocytic panel cells, Sanquin, LOT number 8000453644). The Rr group consisted of 1 sample, R0r (number 6 from erythrocytic panel cells, REAGENS, LOT number 732111). The Dv group, obtained from routine serologic tests, had 2 samples, whereas the D- group from routine serologic tests also had 2 samples. The Dv phenotype represented the D variant and appeared as DvC+c-E-e+. RS referred to random samples, with RS1 and RS2 both exhibiting D+C-c+E-e+ phenotypes. In addition, the D- samples showed D-C+c+E-e+ phenotypes.
Targeted long-read sequencing analysis
PacBio HiFi-targeted amplification sequencing was used to sequence the full-length genes of RHD, RHCE, and TMEM50A in the proband and her relatives. Nineteen amplicons were designed for specific amplification of these genes. The target regions included 5 kb upstream of the RHD gene, TMEM50A, and 11 kb upstream of the RHCE gene, totaling ∼164 kb each. Specific primers were designed to obtain the inversion sequences. The data obtained from long-read sequencing were aligned to the human reference genome CHM13v2.0.20,21 Low-quality, nontargeted data were excluded. The aligned data were processed and analyzed using the SnapGene visualization tool. DNA products were sent to Xi 'an Haorui Genomics Technology Co, Ltd for targeted long-read sequencing.
Whole-genome sequencing analysis
Long-read whole-genome sequencing was performed using the PromethION sequencing platform. The SQK-LSK109 protocol for library preparation and sequencing was performed according to the manufacturer's instructions. Briefly, DNA template damage and ends were repaired in a combined step, followed by AMPureXP bead purification (Beckman Coulter, CA) and ligation of the platform-specific adapter sequences. The final library was loaded onto a PromethION flow cell following the default protocol for PromethION DNA sequencing. Base calling of the raw reads was performed using ONT basecaller Guppy (v1.4.0) on a PromethION device. The run metrics were calculated and visualized using Nanopack. The reads were aligned to the human reference genome (CHM13v2.0) using minimap2 (v2.14-r883) with default parameters. The inversions were detected using an npInv inversion caller. Coverage was assessed using mosdepth, and the breakpoints and junctions of the structural rearrangements were identified manually using Integrative Genomic Viewer software. Whole-blood sample was sent to Shanghai WeHealth Biomedical Technology Co, Ltd for whole-genome sequencing.
Bionano optical mapping
Bionano OGM was conducted to determine the correct RH gene haplotype structures in the proband. The protocol for DNA isolation, labeling, genome assembly, and variant calling was performed according to the manufacturer's instructions. Ultrahigh molecular weight genomic DNA (gDNA) molecules were labeled with the Direct Label and Stain DNA Labeling Kit (Bionano Genomics, San Diego, CA). Direct label enzyme 1 and DL-green fluorophores were used to label 750 ng of gDNA. After washing out the excess DL-green fluorophores, the DNA backbone was counterstained overnight before quantitation and visualization using a Saphyr instrument. For genome assembly, a set of label locations for a single DNA molecule was defined as a separate single-molecule map. We performed in silico direct label enzyme 1 digestion of the human reference genomes (CHM13v2.0) to generate a reference map, and the preset parameters of the software were used for comparison. De novo assembly of single molecules into consensus genome maps was performed using Bionano Solve v3.5.1. Circos plots and aberration details were constructed for the individuals. The software was from https://bionanogenomics.com/support-page/bionano-access, a BionanoNode.js web application. Whole-blood sample was sent to Shanghai WeHealth Biomedical Technology Co, Ltd for Bionano optical mapping.
NGS
A customized NGS panel was used to sequence the full-length genes of RHD and RHCE and their 10 kb upstream and downstream regions. TMEM50A was not included in this panel. Probes for the target genes were designed using the Target Capture Probe Design and Ordering Tool from Twist Bioscience (Twist Bioscience, CA). The DNA was fragmented, end-repaired, A-tailed, and ligated to sequencing adapters. Libraries were prepared using the Hieff NGSOnePot DNA Library Prep Kit for Illumina (YEASEN, China). The captured libraries were sequenced on a DNBSEQ-T7 (MGI, China) in the pair-end 150 mode.
The bioinformatic filtering pipeline was modified based on a previously described approach.22 The raw data quality was verified using FASTQC. To verify the SV, we estimated the coverage of NGS reads over every RH exon. The uneven local coverage of sequencing reads over the target regions is an obvious shortcoming of the Target Capture Probe library. To compensate for this problem, we extended each exon boundary to both sides from 0 to 500 bases and calculated the coverage of NGS reads over those regions with different extended lengths using mosdepth (v0.3.3). The average values were treated as coverage over RH gene exons, and the range reflected the degree of volatility. The similarity of exon sequences can mislead NGS short reads for correct alignment, resulting in coverage over identical exons. Exon 8 of RHD and RHCE was adjusted for adjacent exons. DNA product was sent to Shanghai WeHealth Biomedical Technology Co, Ltd for NGS.
Breakpoint analysis
The RHCE and RHD haplotype breakpoints of the proband and her family members identified via HiFi amplicon, ONT, and OGM data were specifically amplified from the genomic DNA under the following conditions: 2 minutes at 94°C (1 cycle), 12 seconds at 98°C, 12 minutes at 68°C (27 cycles), and 10 minutes at 68°C (1 cycle). Breakpoints were determined using breakpoint-specific primers, as shown in supplemental Table 1. In addition, the CE8-CE3 fusion was confirmed using Sanger sequencing.
The samples related to this project have been approved by the Medical Ethics Review Committee of Shanghai Blood Center.
Results
Phenotype analysis and genotype prediction via sanger sequencing
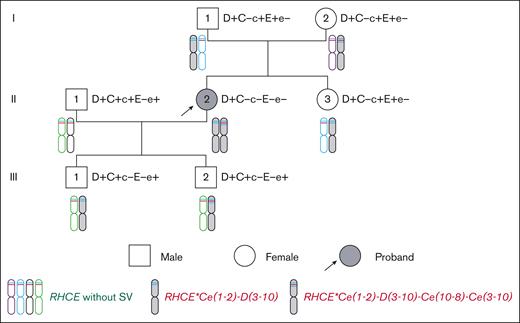
The proposita and her family were identified during blood matching when difficulties were encountered in identifying the RhCE phenotype. An immunohaematological workup of the proposita and her family (husband, first child, second child, father, mother, and sister) was performed (Figure 1; Table 1). Serotyping results demonstrated that the proposita had a D+C-c-E-e− phenotype, which was suspected to be D--. Furthermore, the father, mother, and sister of the proband appeared to be D+C-c+E+e−, whereas her 2 sons appeared to be D+C+c-E-e+, and her husband had a D+C+c+E-e+ phenotype (supplemental Figure 1). However, the genotypes tested for exons via Sanger sequencing were different (Table 1). Further analysis of RHCE genotyping using mass spectrometry revealed consistent results with Sanger sequencing, with the exception of the husband (supplemental Table 2). The discrepancy observed in the husband was attributed to the fact that only 1 C/c polymorphism site was designed for detection using mass spectrometry (supplemental Table 2). These data indicate that the D-- blood group may have a complex mechanism.
| Member . | ABO phenotype . | Rh phenotype . | Allele number† . | Predicted by Sanger sequencing . | Predicted by Targeted long-read sequencing . | |||||||||
|---|---|---|---|---|---|---|---|---|---|---|---|---|---|---|
| RHCE allele‡ . | RHCE genotype . | RHCE . | RH genotype . | |||||||||||
| c.48 . | c.150 . | c.178 . | c.201 . | c.203 . | c.307 . | c.676 . | RHCE allele§ . | |||||||
| ISBT reference | — | — | G | C | C | A | A | C | G | RHCE∗ce | ||||
| CHM13v2 | — | — | C | T | A | G | G | T | G | RHCE∗Ce | ||||
| Proband | A | D+C-c-E-e− | #1☆ | RHCE∗Ce | RHCe/RHCe | C | T | A | G | G | T | — | RHCE∗Ce(1-2)-D(3-10) | RHD∗01-RHCE∗Ce(1-2)-D(3-10)/RHD∗01-RHCE∗Ce(1-2)-D(3-10)-Ce(10-8)-Ce(3-10) |
| #2▿ | RHCE∗Ce | C | T | A | G | G | T | G | RHCE∗Ce(1-2)-D(3-10)-Ce(10-8)-Ce(3-10) | |||||
| Father | O | D+C-c+E+e− | #1☆ | RHCE∗CE | RHCE/RHcE | C | T | A | G | G | T | — | RHCE∗Ce(1-2)-D(3-10) | RHD∗01-RHCE∗Ce(1-2)-D(3-10)/RHD∗01-RHCE∗cE |
| #2 | RHCE∗cE | G | C | C | A | A | C | C | RHCE∗cE | |||||
| Mother | A | D+C-c+E+e− | #1▲ | RHCE∗Ce | RHCe/RHcE | G | C | C | A | A | C | C | RHCE∗cE | RHD∗01-RHCE∗cE/RHD∗01-RHCE∗Ce(1-2)-D(3-10)-Ce(10-8)-Ce(3-10) |
| #2▿ | RHCE∗cE | C | T | A | G | G | T | G | RHCE∗Ce(1-2)-D(3-10)-Ce(10-8)-Ce(3-10) | |||||
| Sister | A | D+C-c+E+e− | #1▲ | RHCE∗CE | RHCE/RHcE | G | C | C | A | A | C | C | RHCE∗cE | RHD∗01-RHCE∗cE/RHD∗01-RHCE∗Ce(1-2)-D(3-10) |
| #2☆ | RHCE∗ cE | C | T | A | G | G | T | — | RHCE∗Ce(1-2)-D(3-10) | |||||
| Child1st | AB | D+C+c-E-e+ | #1★ | RHCE∗Ce | RHCe/RHCe | C | T | A | G | G | T | G | RHCE∗Ce | RHD∗01-RHCE∗Ce/RHD∗01-RHCE∗Ce(1-2)-D(3-10) |
| #2☆ | RHCE∗Ce | C | T | A | G | G | T | — | RHCE∗Ce(1-2)-D(3-10) | |||||
| Child2nd | AB | D+C+c-E-e+ | #1★ | RHCE∗Ce | RHCe/RHCe | C | T | A | G | G | T | G | RHCE∗Ce | RHD∗01-RHCE∗Ce/RHD∗01-RHCE∗Ce(1-2)-D(3-10)-Ce(10-8)-Ce(3-10) |
| #2▿ | RHCE∗Ce | C | T | A | G | G | T | G | RHCE∗Ce(1-2)-D(3-10)-Ce(10-8)-Ce(3-10) | |||||
| Husband | AB | D+C+c+E-e+ | #1★ | RHCE∗Ce | RHCe/RHce | C | T | A | G | G | T | G | RHCE∗Ce | RHD∗01-RHCE∗Ce/RHD∗01-RHCE∗ce.01 |
| #2 | RHCE∗ce | C | C | C | A | A | C | G | RHCE∗ce.01 | |||||
Nomenclature based on (ISBT 004) RHCE blood group alleles v6.2-31-MAR-2022 and (ISBT 004) RHD blood group alleles v6.4 31-JUL-2023.
Same shapes represent the same allele predicted by targeted long-read sequencing.
The most likely allele according to the frequency of RHCE alleles in the Chinese population.
Genomic coordinates in the human CHM13v2 reference genome.
Rh antigen expression analysis using flow cytometry
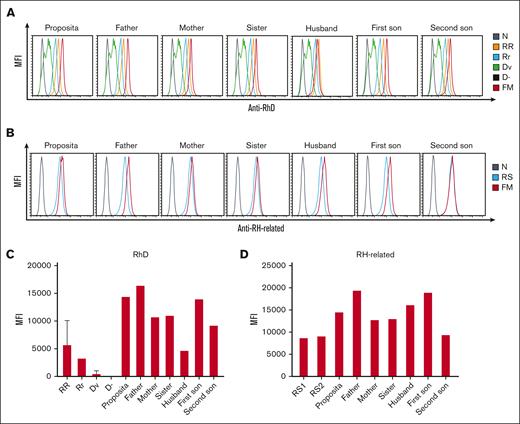
Due to inconsistent results from serological phenotypes and RH genotypes from the D-- family, we used flow cytometry to further analyze the expression of the Rh antigen on the cell surface. To confirm whether RhD antigens were present in a stronger form in the D-- proposita, RR, Rr, Dv, and D- RBCs were used as controls. The results revealed stronger RhD expression in the D-- proposita than her husband or RR control, as well as her immediate family members. Moreover, the test sample from her father showed the strongest fluorescence intensity among all family members (Figure 2A,C).
The expression of RBC membrane RhD and RH-related antigens from D-- family members. The expression levels followed a decreasing order of RR>Rr>Dv>D-. (A) RhD antigen of D-- family members. (B) RH-related antigen of D-- family members. (C) Histogram of the results in panel A. (D) Histogram of the results in panel B.
The expression of RBC membrane RhD and RH-related antigens from D-- family members. The expression levels followed a decreasing order of RR>Rr>Dv>D-. (A) RhD antigen of D-- family members. (B) RH-related antigen of D-- family members. (C) Histogram of the results in panel A. (D) Histogram of the results in panel B.
We also tested the RH-related antigens of the D-- family with random samples as controls. The expression of RH-related antigens showed higher fluorescence intensity than control RBCs, whereas no obvious differentiation was observed between D-- family members (Figure 2B,D). Detailed flow cytometry studies confirmed that the proposita belongs to the very rare D-- phenotype.
Genome structural variation analysis of the proband based on ONT whole-genome sequencing and NGS
Due to the inconsistent results between the phenotypes and genotypes of D-- family members, we decided to explore the complex mechanism using multiple platforms (Table 2). The proband underwent whole-genome sequencing using ONT technology. After quality control, 132.13 Gb data were obtained, comprising 23.10 M reads (supplemental Table 3A). The reads were aligned to the CHM13v2 reference genome with an average whole-genome coverage depth of ∼42.17× (supplemental Table 3B). Structural variation analysis was performed using Sniffles,23 and 32 031 SVs were identified, including 14 386 deletions, 197 duplications, 16 820 insertions, 153 inversions, and 475 translocations (supplemental Table 3C). Copy number variation (CNV) was detected using a CNV kit,24 and 515 CNVs were identified (supplemental Table 3D). Eighty short tandem repeats were identified using DeepRepeat.25
Multiplatform analysis of D-- family members
| Sample . | PacBio HiFi amplicon . | ONT WGS . | Bionano OGM . | NGS . | ||
|---|---|---|---|---|---|---|
| RHCE . | RHD . | TMEM50A . | ||||
| Proband | √ | √ | √ | √ | √ | |
| Mother | √ | √ | √ | |||
| Father | √ | √ | ||||
| Husband | √ | |||||
| Sister | √ | |||||
| Child1st | √ | |||||
| Child2nd | √ | |||||
| Control | √ | |||||
WGS, whole genome sequencing.
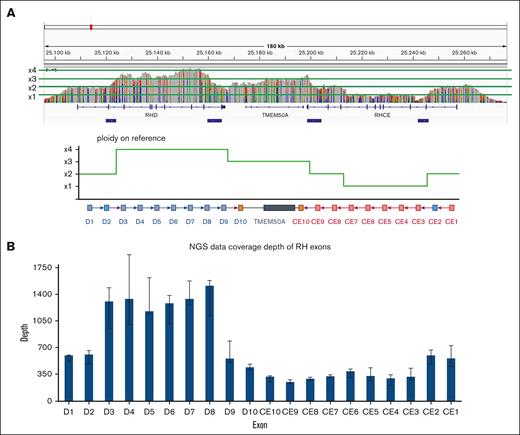
In the RH gene locus, there was an inversion (g.chr1:25,213,950_25,240,793INV) in the RHCE region, with breakpoints in intron 2 and intron 7. CNV gain (g.chr1:25,111,272-25,201,298) was detected in the RHD region, whereas CNV loss (g.chr1:25,201,299-25,246,343) was detected in the RHCE region. To verify SV and CNV, the alignment data were manually analyzed using Integrative Genomic Viewer. The results revealed abnormal ONT read coverage in the RH gene region (Figure 3A) and anomalous reads resulting from nonhomologous end-joining or homologous recombination (supplemental Figure 2).
Genome structural variation analysis of the proband. (A) ONT read coverage in the RH gene region of the D-- proband. (B) NGS read coverage in the RH exon region of the D-- proband.
Genome structural variation analysis of the proband. (A) ONT read coverage in the RH gene region of the D-- proband. (B) NGS read coverage in the RH exon region of the D-- proband.
To further validate the abnormal regions in the RH gene of the D-- proband, we used NGS to analyze the SVs and CNVs. A total of 3.12 Gb of short raw sequencing data were generated for the proband, and 2.36 Gb of clean data with 97.31% Q20 remained after low-quality read removal and adapter trimming. The coverage of NGS reads over every RH gene exon was estimated (Figure 3B), and the landscape was consistent with the ONT read coverage.
Long-read target sequencing of D-- family genotypes
To further identify the structural variations in the proband RHD and RHCE genes, targeted long-read sequencing was performed on 7 members of the proband family using PacBio sequencing. A total of 6.76 Gb of high-quality data were obtained, comprising 1 098 646 HiFi reads (supplemental Tables 4-5). All data were clustered according to different amplification regions, and some regions contained >2 types of cluster sequences (with credible single-nucleotide variant [SNV]). This indicates the existence of CNVs in some regions of RHD and RHCE. Moreover, some regions had twice as many reads in 1 of the 2 alleles, which also indicated a CNV in those places. Anomalous cluster sequences resulting from homologous recombination revealed near high-homology sequences in the exon 2 and exon 10 of RHD and RHCE, respectively. Nonhomologous end-joining points were found in the intron 2 and intron 7 of the RHCE gene.
Targeted amplification sequencing was performed on the TMEM50A gene of a normal control sample and the mother of the proband to validate the credibility of the double-read support for cluster sequences. The read support ratio for the 2 cluster sequences of the same amplification source in the normal control sample was ∼1 and ∼2 for the mother (supplemental Table 6). Because the TMEM50A gene is located within the suspected SV, the results confirmed the existence of CNV, consistent with ONT (Figure 3A). In addition, the results indicated that doubling the read support for cluster sequences truly reflected the existence of 2 identical copies of an amplification fragment.
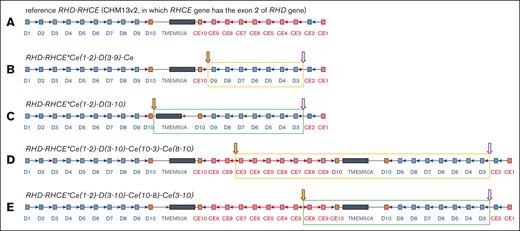
A possible RH haplotype structural variation model was constructed based on this information (Figure 4). The father of the proband was inferred to have a normal RH gene haplotype structure, whereas the other haplotypes had possible structural variations in RHCE∗Ce(1-2)-D(3-9)-CE (Figure 4B) or RHCE∗Ce(1-2)-D(3-10) (Figure 4C). The mother had a normal haplotype and another haplotype that might have structural variations in RHCE∗Ce(1-2)-D(3-10)-Ce(10-3)-Ce(8-10) (Figure 4D) or RHCE∗Ce(1-2)-D(3-10)-Ce(10-8)-Ce(3-10) (Figure 4E). The proband may have inherited both haplotypes with structural variations from her parents. This model was also consistent with the fluctuations in genome coverage depth in the proband ONT data (Figure 3A), indicating the correctness of the model inference.
Reference RH and SV haplotype models. The purple border arrows indicate the joining point of homologous recombination; red border arrows indicate the joining point of nonhomologous junction; yellow filled arrows indicate the same joining points in different SV. (A) Reference RH haplotype model. (B-C) Models of the SV haplotype of the father. (D-E) Models of the SV haplotype of the mother.
Reference RH and SV haplotype models. The purple border arrows indicate the joining point of homologous recombination; red border arrows indicate the joining point of nonhomologous junction; yellow filled arrows indicate the same joining points in different SV. (A) Reference RH haplotype model. (B-C) Models of the SV haplotype of the father. (D-E) Models of the SV haplotype of the mother.
Confirmation of variants via bionano OGM
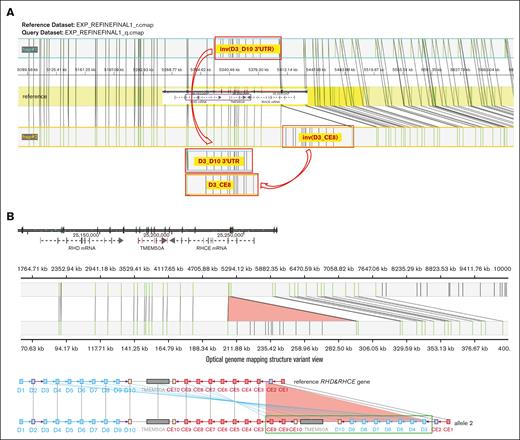
Because the RH gene structures of the proband were uncertain based on ONT whole-genome sequencing and PacBio targeted sequencing, Bionano OGM was conducted to determine the correct RH gene haplotype structures. A total of 2 910 686 sequences were obtained after quality filtering, with a total length of 757.94 Gb and an average length of 260.40 kb, resulting in a whole-genome coverage depth of 244.52× (supplemental Table 7). The marker density within the whole-genome region was 16.14 per 100 kb, with 27 markers in the ∼180 kb RHD-TMEM50A-RHCE reference genome region. Alignment was performed on the RH gene and its surrounding optical map molecules for local assembly, and the assembled maps were visualized using MapOptics. Visualization analysis showed that the 2 proband haplotypes were RHCE∗Ce(1-2)-D(3-10) and RHCE∗Ce(1-2)-D(3-10)-Ce(10-8)-Ce(3-10) (Figure 5).
SV haplotype models of the proband generated by using Bionano OGM. (A) Models of the SV haplotypes of the proband (the red border boxes represent the SV regions). (B) Models of the distribution of Bionano labels between the reference genome and the sequenced sample in the RH gene region (the top figure presents the reference genome and the vertical lines on the axis indicate Bionano labels. The middle visualization depicts the Bionano analysis between the reference genome and the sequenced sample, with lines connecting the same label. The bottom part shows blue lines linking the reference genome with the corresponding exons of the proband. The light red triangle in the last 2 figures indicates the inserting region).
SV haplotype models of the proband generated by using Bionano OGM. (A) Models of the SV haplotypes of the proband (the red border boxes represent the SV regions). (B) Models of the distribution of Bionano labels between the reference genome and the sequenced sample in the RH gene region (the top figure presents the reference genome and the vertical lines on the axis indicate Bionano labels. The middle visualization depicts the Bionano analysis between the reference genome and the sequenced sample, with lines connecting the same label. The bottom part shows blue lines linking the reference genome with the corresponding exons of the proband. The light red triangle in the last 2 figures indicates the inserting region).
Genotype analysis using combined ONT, long-read sequencing, and OGM
To obtain single-base resolution full-length RH gene haplotype sequence and determine the inheritance of structural variation haplotypes in the proband family, 6 RHCE and 4 RHD gene haplotypes were manually assembled using HiFi amplification cluster sequences, and 29 heterozygous SNV markers were discovered using HiFi data (11 on RHD, 3 on TMEM50A, and 15 on RHCE) (supplemental Table 8), combined with the genetic relationships among family members, Bionano OGM assembly, and heterozygous site information identified using HiFi data. Three RHCE haplotypes with structural variation were identified: RHCE∗Ce, RHCE∗Ce(1-2)-D(3-10), and RHCE∗Ce(1-2)-D(3-10)-Ce(10-8)-Ce(3-10). The inheritance relationships of these haplotypes in the proband family were determined (Figure 1; Table 1).
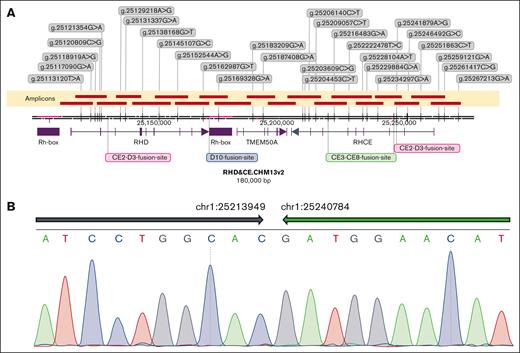
The breakpoints and breakpoint regions were confirmed using a combination of ONT, long-read sequencing, and OGM with breakpoint-specific primers (Figure 6A; supplemental Table 1). The breakpoints of nonhomologous connections can be specific to a base, but the breakpoints of homologous recombination can only outline a possible region. The length of the high-homology region near exon 2 of RHD/RHCE is 4.26 kb, and the length of the high-homology region near exon 10 was 5.57 kb, both of which are possible breakpoint locations. Among the 4 groups of recombination breakpoints, only the CE8-CE3 fusion was nonhomologous, whereas the others were homologous. Therefore, the breakpoint of the CE8-CE3 fusion was further analyzed using Sanger sequencing, which also demonstrated the identified structural variations (Figure 6B).
RH locus landscape and breakpoint sequencing. The representative introns and exons are shown as lines and boxes below the coordinate axis, respectively; the arrow on the last exon represents the genic orientation. RH boxes are shown as purple boxes below the axis. Twenty-nine heterozygous SNV markers were developed from HiFi cluster reads and involved in assembling and phasing haplotypes of this locus (strings in each gray box give the genomic coordinate, reference to alternative alleles of corresponding SNV marker). (A) Nineteen amplicons were designed to target the whole region of this locus and identify breakpoints therein (amplicons are shown as brownish red bars above the axis, and the recognized nonhomologous end-joining breakpoints and homologous recombination breakpoint regions are marked in lime and magenta/red, respectively). (B) The breakpoint of CE8-CE3 fusion tested via Sanger sequencing (inversion intervals are shown as arrows above the base pairs).
RH locus landscape and breakpoint sequencing. The representative introns and exons are shown as lines and boxes below the coordinate axis, respectively; the arrow on the last exon represents the genic orientation. RH boxes are shown as purple boxes below the axis. Twenty-nine heterozygous SNV markers were developed from HiFi cluster reads and involved in assembling and phasing haplotypes of this locus (strings in each gray box give the genomic coordinate, reference to alternative alleles of corresponding SNV marker). (A) Nineteen amplicons were designed to target the whole region of this locus and identify breakpoints therein (amplicons are shown as brownish red bars above the axis, and the recognized nonhomologous end-joining breakpoints and homologous recombination breakpoint regions are marked in lime and magenta/red, respectively). (B) The breakpoint of CE8-CE3 fusion tested via Sanger sequencing (inversion intervals are shown as arrows above the base pairs).
Discussion
Individuals with the D-- phenotype present a lack of RhCE antigens and normal or overexpressed D antigen in their RBCs. Despite the rarity of this variant, it has been reported in many populations, including Asian, Caucasian, and African American populations. The prevalence of the D-- phenotype ranges from 0.0005% in Sweden to 0.005% in American Hispanics, and the frequency in Japan is ∼1 in 100 000 (0.001%).26 Sporadic case studies on phenotype D-- have been published in China.16 D-- individuals are occasionally identified in cases of unresolved crossmatch incompatibility or during pregnancy with HDFN. Rh17(Hr0)-negative individuals can become immunized through transfusion or pregnancy, and alloimmunization caused by anti-Rh17 is known as a critical factor for HDFN.17,27 Finding a suitable donor for an individual with a rare Rh deficiency is difficult owing to the scarcity of the D-- phenotype. Once identified, D-- individuals should be enrolled in a rare blood library available for donation for individuals with the same phenotype.
To date, the most frequently reported mechanism of the D-- phenotype is gene rearrangement, which results in RHCE∗CE-D-CE hybrid alleles. RHCE exons are replaced with RHD exons 2 to 6,9,13RHD exons 2 to 7,28RHD exons 1 to 9,29RHD exons 3 to 9,10,13 or RHD exon 3 to 8.11,13 Single-nucleotide point mutations, such as RHCE∗Ce(c.1059G>A) and RHCE∗Ce(IVS3+5G>A), are also associated with the D-- phenotype.5,15 Other mechanisms have also been reported, including single-nucleotide insertions (RHCE∗Ce87_93insT)10 and nucleotide deletions (RHCE∗cE907delC).14 To date, the main molecular bases of D-- have been attributed to RHCE gene inactivation caused by gene rearrangement or loss-of-function mutations in the coding regions or splice sites. Despite this, there is a lack of reports on individuals with the D-- phenotype retaining all normally unmutated RHCE exons.
In this study, we identified, to our knowledge, a new complex inheritance mechanism, in which RHCE exons are reserved with repetition and inversion of large segments in a D-- family. The proband inherited 1 copy of the structural inversion and RHD sequence inserted RHCE∗Ce(1-2)-D(3-10)-Ce(10-8)-Ce(3-10) from her mother and 1 copy of RHD sequence replaced RHCE∗Ce(1-2)-D(3-10) from her father. Consequently, the proband's Sanger sequencing results indicated intact RHCE exons. Unfortunately, we encountered difficulties in obtaining suitable messenger RNA samples for analyzing the potential transcript sequence and expression of the RHCE gene in the proband. However, our results demonstrated that 1 allele lacked most of the RHCE exons, whereas another allele showed significant duplications and inversions. Moreover, the phenotyping results indicated impaired expression of the RhCE protein. Based on these findings, we deduce that the likelihood of producing a complete full-length RHCE transcript in the proband is low. In addition, the allele RHCE∗Ce(1-2)-D(3-10) differs from the common RHCE∗Ce(1-2)-D(3-9)-Ce allele. The replacement region of the hybrid gene extends up to 3’-UTR region of the RHD gene. Identifying these alleles using traditional sequencing techniques is difficult, which emphasizes the intricate nature of RH structural variation.
Although genetic changes leading to the D-- phenotype have been reported in various ethnicities, many variants that contribute to great diversity at the nucleotide level, such as translocations, inversions, and complex SVs, remain undiagnosed. This is likely due to limitations of the current platforms. Genetic testing for RH genes has been expanded through NGS, which has made it possible to identify CNVs.30-33 However, the relatively short read length of NGS (150-250 bp) presents limitations in accurately identifying complex mutation patterns. Chromosomal microarrays are commonly used to identify CNVs. However, it cannot identify small or balanced SVs. In addition, it has a limited ability to provide information about location and orientation.34 Recent advances in single-molecule sequencing and whole-genome mapping have shown promising results in analyzing structural variations.35-37 The third-generation sequencing platforms such as ONT38 and PacBio target sequencing39 are able to sequence long DNA regions at the single-molecule level and show promise for resolving complex rearrangements involving genes of the Rh blood group systems.40
In this study, in consideration of defects and advantages, we integrated multiple molecular technologies to analyze complex SVs in the D-- proband. The inaccuracy of the ONT data caused ambiguity when judging the recombination form and exact recombination site. Therefore, the whole-genome sequencing results did not clearly identify the recombination site. However, they provided important support for judging CNV, which is not easily obtained through PacBio target sequencing because of the different distributions of target sequencing regions. PacBio HiFi sequencing targeted the divided gene segments, increasing its accuracy when judging the location of recombination in our research. The design of special primers and results analysis are the difficult parts of this technique, whereas ONT sequencing results play an auxiliary role in identifying possible recombination forms. OGM was important in determining the form of structural variation accurately. Although OGM could not identify the recombination site, it could judge and prove the form of variation as auxiliary, especially at the terminal part of the sequence mentioned in this paper, which might generate several different recombination forms. Therefore, correct typing can be ultimately confirmed using OGM. It is important to mention that the utilization of OGM technology for analyzing structural variations in blood group genes, including RH, has not yet been explored.
Complex structural variations could not be precisely identified using a single molecular method. To overcome the barriers of complicated structural variation detection, we integrated OGM, NGS, and PacBio long-read sequencing to comprehensively characterize structural variation in an individual with the D-- phenotype, as well as their family. Importantly, we identified intricate SVs more accurately by combining multiple molecular technologies than with their individual use. Combined detection provides a universal approach to achieve comprehensive genetic analysis of complicated SVs.
Acknowledgment
This work was supported by grants from the fund from National Natural Science Foundation of China (81970168).
Authorship
Contribution: M.L. performed the experiments and wrote the manuscript; L.W. found the proband and collected samples of the family; A.L. performed serotyping and the mass spectrometry experiments; B.W., X.Y., Y.Z., and C.C. contributed to the sequencing data analysis; F.S. collected samples of the family and revised the manuscript; and Z.Z. and L.Y. conceived and directed the research project, analyzed the data, and revised the manuscript.
Conflict-of-interest disclosure: The authors declare no competing financial interests.
Correspondence: Luyi Ye, Immunohematology Laboratory, Shanghai Institute of Blood Transfusion, Shanghai Blood Centre, No. 1191 Hongqiao Rd, Changning District, Shanghai 200051, China; email: yeluyi@sbc.org.cn; Ziyan Zhu, Immunohematology Laboratory, Shanghai Institute of Blood Transfusion, Shanghai Blood Centre, Shanghai 200051, China; email: zhuziyan@sbc.org.cn; and Futing Sun, Weifang People’s Hospital, No. 151 Guangwen Str, Kuiwen District, Weifang, Shandong 261041, China; email: wfrmyysft@163.com.
References
Author notes
M.L. and L.W. contributed equally to this study.
DNA sequencing data have been submitted to public repository SRA. The project title is “Complex inversion and recombination in RH genes” and the accession number is PRJNA1081474.
Original data and protocols are available to other investigators upon request by contacting the corresponding authors, Luyi Ye (yeluyi@sbc.org.cn), Ziyan Zhu (zhuziyan@sbc.org.cn), and Futing Sun (wfrmyysft@163.com).
The full-text version of this article contains a data supplement.

