Key Points
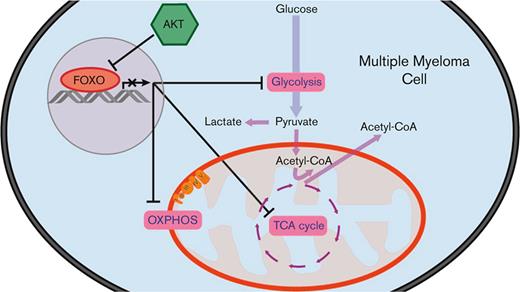
AKT prevents the metabolic shutdown of multiple myeloma cells by restricting FOXO.
FOXO-dependent repression of metabolic genes is associated with favorable prognosis in MM.
Abstract
Metabolic alterations are important cancer-associated features that allow cancer cell transformation and survival under stress conditions. Multiple myeloma (MM) plasma cells show increased glycolysis and oxidative phosphorylation (OXPHOS), which are characteristics associated with recurrent genetic aberrations that drive the proliferation and survival of MM cells. The protein kinase B/AKT acts as a central node in cellular metabolism and is constitutively active in MM cells. Despite the known role of AKT in modulating cellular metabolism, little is known about the downstream factors of AKT that control the metabolic adaptability of MM cells. Here, we demonstrate that negative regulation of the forkhead box O (FOXO) transcription factors (TFs) by AKT is crucial to prevent the metabolic shutdown in MM cells, thus contributing to their metabolic adaptability. Our results demonstrate that the expression of several key metabolic genes involved in glycolysis, the tricarboxylic acid (TCA) cycle, and OXPHOS are repressed by FOXO TFs. Moreover, the FOXO-dependent repression of glycolysis- and TCA-associated genes correlates with a favorable prognosis in a large cohort of patients with MM. Our data suggest that repression of FOXO by AKT is essential to sustain glycolysis and the TCA cycle activity in MM cells and, as such, predicts patient survival.
Introduction
Multiple myeloma (MM) is a malignancy characterized by the clonal expansion of plasma cells in the bone marrow. Although novel treatment strategies have improved the prognosis and outcome of MM, most patients eventually relapse and become refractory to further treatment.1 Cancer cells are characterized by metabolic alterations, which are driven by oncogenes. These alterations may result in metabolic dependencies that can be exploited for therapeutic purposes. Similar to other cancer types, MM cells predominantly fulfill their energetic demands via glycolysis,2,3 a phenomenon known as the Warburg effect.4 In agreement, it was shown that the glycolysis rate-limiting enzyme, hexokinase II (HK2), is highly expressed in MM and is associated with poor prognosis.2,5,6
The increased reliance of cancer cells on glycolysis is often associated with decreased mitochondrial respiration, suggesting that aerobic glycolysis occurs at the expense of oxidative phosphorylation (OXPHOS).4 However, many tumors exhibit increased glycolysis and OXPHOS.7-9. In accordance, despite their high rate of glycolysis, it was shown that MM cells also use OXPHOS because a combined treatment with the mitochondrial respiratory complex I inhibitor, metformin, and the glucose uptake inhibitor, ritonavir, synergized to induce death in MM cells.10 The rewiring of metabolic pathways and the flexibility to utilize different substrates are closely linked to recurrent genetic aberrations that characterize MM.11 In addition to fulfilling increased energy demands, several reports described changes in metabolism that lead to drug resistance in refractory MM.11,12 However, the key molecular factors that determine dynamic metabolic changes in MM cells have not been studied in detail.
Previous works by us and others have shown that AKT plays a pivotal role in the survival and growth of MM cells.13-18 We recently showed that AKT restrains the tumor-suppressive functions of forkhead box O (FOXO) transcription factors (TFs) in MM.18 Importantly, AKT is a central node in the phosphatidylinositol 3-kinase (PI3K)/AKT/mechanistic target of rapamycin pathway that connects proliferation, survival, and cellular metabolism and drives glycolysis.19,20 Activation of AKT is common in cancer, either by activating mutations or by growth factors provided by the tumor microenvironment. In MM, AKT activation is primarily caused by growth factors in the bone marrow and the sporadic loss of phosphatase and tensin homolog expression.17,21
Here, we show that human MM cell lines (HMCLs) rely on glycolysis for proliferation and survival. When no longer able to generate sufficient ATP from glycolysis, OXPHOS is increased, although not sufficiently to maintain a similar proliferation rate and viability. Furthermore, we provide evidence that AKT sustains glycolysis and OXPHOS in MM by restricting FOXO. We demonstrate that active FOXO diminished glycolysis and mitochondrial respiration in MM cell lines, and that the expression of glycolysis- and TCA cycle–related genes in patients with MM negatively correlates with the transcriptional activity of FOXO. Moreover, we show that the FOXO-dependent repression of metabolic genes predicts superior overall survival (OS) in a large cohort of patients with MM.
Materials and methods
Cell culture and reagents
Cell lines, cell culture conditions, and details on reagents are provided in the supplemental Materials and Methods.
Patient samples
Primary plasma cells from newly diagnosed patients with MM (n = 2) and with a plasmacytosis of mononuclear cells being >80% were isolated as detailed in the supplemental Materials and Methods and as described previously.18 Primary MM cells were cultured overnight in supplemented Iscove modified Dulbecco medium with 10% fetal calf serum and 1 ng/mL interleukin-6 before experiments. Patient material was obtained according to the ethical standards of our institutional medical ethical committee, as well as in agreement with the 1975 declaration of Helsinki, as revised in 1983.
Metabolic profiling
Seahorse extracellular flux (XF) metabolic profiling experiments were performed according to the manufacturer’s protocols. Experimental details are provided in the supplemental Materials and Methods.
Immunoblotting
Immunoblotting was performed as previously described.18 The antibodies used in this study are listed in the supplemental Materials and Methods.
GEP analysis
Gene expression profile (GEP) dataset E-TABM-113822 was obtained from the ArrayExpress archive, and datasets GSE6477,23 GSE2658,24,25 and GSE12094118 were obtained from the NCBI Gene Expression Omnibus database. The R2 genomics analysis and visualization platform (http://r2.amc.nl) was used for k-means clustering based on the GEP data and survival analysis using the Kaplan-Meier method. The gene set enrichment analysis (GSEA) software (http://www.broad.mit.edu/gsea)26 and the Molecular Signature Database were used for GSEAs and leading edge (LE) analyses.
Flow cytometry
Cell numbers and specific cell death were determined by 7-aminoactinomycin D staining (BioLegend, San Diego, CA) and calculated as published previously.18 Experimental details for the glucose uptake assay are provided in the supplemental Materials and Methods. All flow cytometry data were obtained using a FACSCanto or LSR Fortessa (BD Biosciences, Franklin Lakes, NJ) and analyzed using FlowJo software (FlowJo, Ashland, OR).
Statistics
The GraphPad Prism software package was used for statistical analyses (GraphPad Software, La Jolla, CA).
Results
Characterizing the metabolic adaptability of MM cells
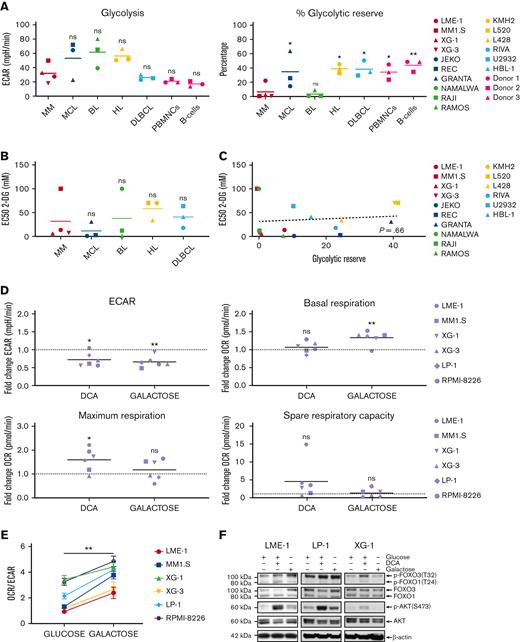
To determine the functional metabolic features of HMCLs in comparison with other mature malignant B-cell lines (BCLs), normal activated human peripheral blood mononuclear cells (PBMNCs), and activated purified B cells, glycolysis and mitochondrial stress tests were performed. No striking differences in the extracellular acidification rates (ECARs) or basal oxygen consumption rates (OCRs) were observed, indicating similar basal glycolysis and OXPHOS activity (Figure 1A, supplemental Figure 1A). This suggests that HMCLs, BCLs, activated PBMNCs, and normal B cells have comparable energetic demands under basal conditions. Similarly, the normalized spare respiratory capacity of HMCLs was similar to that of other BCLs, demonstrating that HMCLs and BCLs do not differ with regard to mitochondrial adaptability.27 However, both HMCLs and Burkitt lymphoma cell lines (BLCLs) showed very limited normalized glycolytic reserve (Figure 1A). This indicates that in HMCLs and BLCLs, the glycolytic function is at its maximum and suggests that MM and BL are particularly reliant on glycolysis for proliferation and survival and have limited capacity to utilize glycolysis in response to increased energetic demands.
MM cells show restricted glycolytic reserve and heterogeneous metabolic flexibility. (A) Seahorse XF real-time metabolic profiling of HMCLs (red symbols) and BCLs (blue, green, yellow, and light blue symbols), CpG-activated PBMNCs and purified human peripheral blood B cells (pink symbols). Mean values for basal glycolysis and normalized glycolytic reserve (percentage of basal glycolysis) based on ECAR and mean values for basal respiration and normalized spare respiratory capacity (percentage of basal respiration) based on OCR are depicted (one-way ANOVA with Bonferroni multiple comparisons test; HMCLs vs BCLs, n = 5 measurements. (PBMNCs and purified B cells were obtained from 3 healthy donors). (B) Half maximal effective concentrations (EC50) of 2-DG for cell death in HMCLs and BCLs after 3 days of treatment. Mean values of 3 individual experiments are depicted. (C) Linear regression analysis of the glycolytic reserve values (x-axis) vs the EC50 values for 2-DG (y-axis) in HMCLs and BCLs. (D) Fold change of ECAR, basal respiration, maximum respiration, and spare respiratory capacity (OCR) from a Seahorse XF mitochondrial stress test in HMCLs treated with DCA (25 mM for 20 hours) or cultured for 4 days in a galactose-containing medium (11.1 mM, no glucose). Means of 3 to 6 measurements are shown, and values are normalized to the untreated control condition and depicted as a dotted line (one-sample t test). (E) OCR/ECAR ratios of HMCLs cultured for 4 days in a glucose-containing medium or in a galactose-containing, glucose-free medium. Means ± SEM are shown (paired t test, n = 3-5 measurements). (F) Immunoblot analysis of total and phosphorylated (Ser473) AKT, total and phosphorylated (Thr24) FOXO1, and total and phosphorylated (Thr32) FOXO3 in the HMCLs LME-1, LP-1, and XG-1 cells cultured for 20 hours with or without 25 mM DCA or in a galactose-containing, glucose-free medium. β-actin served as a loading control. One-way ANOVA with Bonferroni multiple comparisons test ∗P < .05, ∗∗P < .01; One-sample t test ∗P < .05, ∗∗P < .01; paired t test, ∗∗P < .05; ANOVA, analysis of variance; ns, not significant; SEM, standard error of the mean.
MM cells show restricted glycolytic reserve and heterogeneous metabolic flexibility. (A) Seahorse XF real-time metabolic profiling of HMCLs (red symbols) and BCLs (blue, green, yellow, and light blue symbols), CpG-activated PBMNCs and purified human peripheral blood B cells (pink symbols). Mean values for basal glycolysis and normalized glycolytic reserve (percentage of basal glycolysis) based on ECAR and mean values for basal respiration and normalized spare respiratory capacity (percentage of basal respiration) based on OCR are depicted (one-way ANOVA with Bonferroni multiple comparisons test; HMCLs vs BCLs, n = 5 measurements. (PBMNCs and purified B cells were obtained from 3 healthy donors). (B) Half maximal effective concentrations (EC50) of 2-DG for cell death in HMCLs and BCLs after 3 days of treatment. Mean values of 3 individual experiments are depicted. (C) Linear regression analysis of the glycolytic reserve values (x-axis) vs the EC50 values for 2-DG (y-axis) in HMCLs and BCLs. (D) Fold change of ECAR, basal respiration, maximum respiration, and spare respiratory capacity (OCR) from a Seahorse XF mitochondrial stress test in HMCLs treated with DCA (25 mM for 20 hours) or cultured for 4 days in a galactose-containing medium (11.1 mM, no glucose). Means of 3 to 6 measurements are shown, and values are normalized to the untreated control condition and depicted as a dotted line (one-sample t test). (E) OCR/ECAR ratios of HMCLs cultured for 4 days in a glucose-containing medium or in a galactose-containing, glucose-free medium. Means ± SEM are shown (paired t test, n = 3-5 measurements). (F) Immunoblot analysis of total and phosphorylated (Ser473) AKT, total and phosphorylated (Thr24) FOXO1, and total and phosphorylated (Thr32) FOXO3 in the HMCLs LME-1, LP-1, and XG-1 cells cultured for 20 hours with or without 25 mM DCA or in a galactose-containing, glucose-free medium. β-actin served as a loading control. One-way ANOVA with Bonferroni multiple comparisons test ∗P < .05, ∗∗P < .01; One-sample t test ∗P < .05, ∗∗P < .01; paired t test, ∗∗P < .05; ANOVA, analysis of variance; ns, not significant; SEM, standard error of the mean.
To test this, the effects of the hexokinase inhibitor 2-deoxy-D-glucose (2-DG) on the survival of BCLs were determined. A heterogeneous response to 2-DG (half maximal effective concentrations [EC50s] ranging from 0.9 mM to >100 mM) was observed, which did not differ significantly between the BCL subtypes, although it is noteworthy that MM1.S (an HMCL) and Namalwa (a BLCL) showed a marked resistance (EC50 >100 mM) (Figure 1B & supplemental Figure 1B). Notably, there was no correlation between 2-DG sensitivity and metabolic function in the cell lines tested (Figure 1C and supplemental Figure 1C), suggesting that 2-DG–dependent cell death involves a different mechanism, such as the induction of endoplasmic reticulum stress through the inhibition of N-glycosylation, as previously described.28
To determine the metabolic adaptability, HMCLs were treated with dichloroacetate (DCA), which increases the activity of the pyruvate dehydrogenase complex and leads to to decreased production of lactate and increased decarboxylation of pyruvate to acetyl coenzyme A (acetyl-CoA), resulting in a shift of pyruvate toward mitochondrial metabolism.3,29 Phosphorylation of pyruvate dehydrogenase was reduced upon DCA treatment, verifying on-target activity (supplemental Figure 1D). As expected, ECAR decreased upon DCA treatment, confirming reduced lactate production, whereas basal respiration was generally not increased in HMCLs. Interestingly, the spare respiratory capacity and the maximum respiration increased in the majority of the HMCLs (5 out of 6) (Figure 1D). These results indicate that increased pyruvate conversion does not directly boost the TCA cycle and OXPHOS but may improve the mitochondrial fitness in most HMCLs.
To further assess metabolic adaptability, HMCLs were cultured for 4 days in a medium in which glucose was replaced with galactose. The oxidation of galactose to pyruvate by glycolysis yields no net ATP, forcing cells to rely on mitochondrial respiration for ATP generation, which is characterized by an increased OCR (Figure 1D).30,31 Galactose caused a significant decrease in the ECAR/OCR ratio in all HMCLs tested, indicating that HMCLs can switch to OXPHOS when forced to do so (Figure 1E). However, when glucose is present, glycolysis remains the major source of ATP production for HMCLs, as is evident from their limited glycolytic reserve. Replacing glucose with galactose resulted in a significant increase in cell death in several HMCLs (LME-1, XG-3, and RPMI-8226), suggesting that these cell lines are unable to generate sufficient ATP from OXPHOS, thus indicating defective mitochondrial respiration and limited metabolic adaptability. Moreover, proliferation was decreased in all HMCLs tested (supplemental Figure 1E), indicating that insufficient ATP is generated through mitochondrial respiration.
AKT signaling is an important driver of metabolism, either directly through the phosphorylation of key metabolic enzymes, or indirectly by controlling the expression of metabolic genes.20 The latter mainly involves the regulation of members of the FOXO TFs. Phosphorylation of AKT at Ser473, which marks its activation, slightly increased upon treatment with DCA in 2 out of 3 galactose-adapted HMCLs. In agreement, the phosphorylation of FOXO1 (Thr24) and FOXO3 (Thr32), which mark their inactivation, followed a similar pattern (Figure 1F). These results suggest that AKT signaling might be a determinant of metabolic adaptability in MM cells.
AKT activity sustains glycolysis and OXPHOS in HMCLs
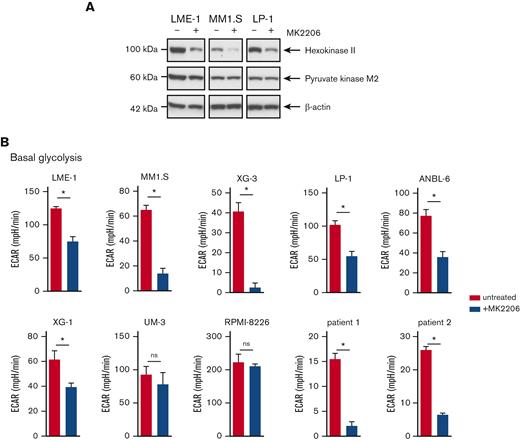
To further investigate the role of AKT signaling in the metabolic features of MM cells, HMCLs were treated with the allosteric AKT inhibitor MK2206. Protein expression of the glycolysis rate-limiting enzyme HK2 was decreased upon MK2206 treatment, whereas the effects on pyruvate kinase M2 (PKM2) were modest (Figure 2A). Functionally, AKT inhibition resulted in a significant decrease in ECAR in most HMCLs (6 out of 8) and in primary MM cells from 2 newly diagnosed patients (Figure 2B and supplemental Figure 2A-B). We have previously shown that AKT regulates the stability of the antiapoptotic Myeloid-cell leukemia 1 (MCL-1) protein, which is essential for the survival of MM cells.18 Consequently, HMCLs overexpressing MCL-1 were resistant to AKT inhibitor–induced cell death.18 However, MCL-1 overexpression did not prevent reduced glycolysis induced by MK2206 treatment, indicating that the effects of AKT inhibition on glycolysis were not related to the induction of apoptosis (supplemental Figure 2C). Moreover, glucose uptake did not decrease upon AKT inhibition, as shown by the 2-(N-(7-nitrobenz-2-oxa-1,3-diazol-4-yl) amino)-2-deoxyglucose uptake assay. Rather, a subpopulation of cells displayed an increased glucose uptake, perhaps because of feedback regulation (supplemental Figure 2D).
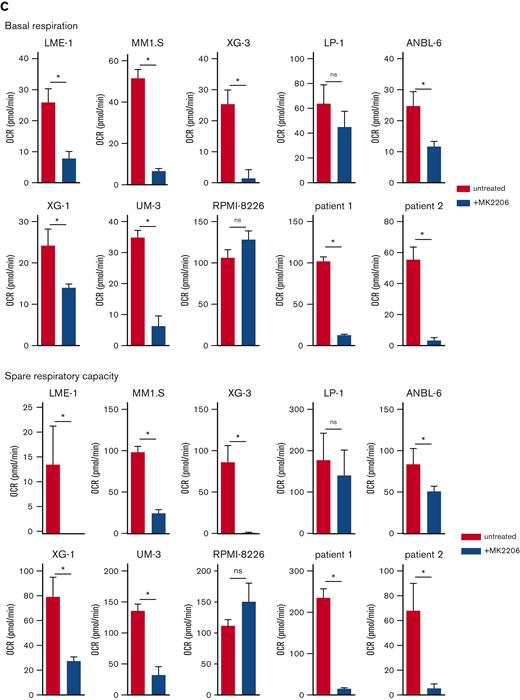
AKT inhibition suppresses glycolysis and OXPHOS in MM cells. (A) Immunoblot analysis of HK2 and PKM2 in LME-1, MM1.S, and LP-1 HMCLs treated overnight with 2.5 μM MK2206 AKT inhibitor or left untreated. β-actin served as a loading control. (B) Basal glycolysis in HMCLs and MMPCs (n = 2 patients) treated with 2.5 μM MK2206 (blue bars) for 20 hours or untreated (red bars). Basal ECAR values from the Seahorse XF glycolysis stress test are depicted, and means ± SEM are shown (t test, n = 5-6 measurements). (C) Basal respiration and spare respiratory capacity in HMCLs and MMPCs (n = 2 patients) treated with 2.5 μM MK2206 (blue bars) or untreated (red bars) for 20 hours. OCR values from the Seahorse XF mitochondrial stress test are depicted, and means ± SEM are shown (t-test, n = 5-6 measurements).t test, ∗P < .05; MMPC, primary MM plasma cells.
AKT inhibition suppresses glycolysis and OXPHOS in MM cells. (A) Immunoblot analysis of HK2 and PKM2 in LME-1, MM1.S, and LP-1 HMCLs treated overnight with 2.5 μM MK2206 AKT inhibitor or left untreated. β-actin served as a loading control. (B) Basal glycolysis in HMCLs and MMPCs (n = 2 patients) treated with 2.5 μM MK2206 (blue bars) for 20 hours or untreated (red bars). Basal ECAR values from the Seahorse XF glycolysis stress test are depicted, and means ± SEM are shown (t test, n = 5-6 measurements). (C) Basal respiration and spare respiratory capacity in HMCLs and MMPCs (n = 2 patients) treated with 2.5 μM MK2206 (blue bars) or untreated (red bars) for 20 hours. OCR values from the Seahorse XF mitochondrial stress test are depicted, and means ± SEM are shown (t-test, n = 5-6 measurements).t test, ∗P < .05; MMPC, primary MM plasma cells.
In addition, AKT kinase activity regulated mitochondrial respiration in MM (Figure 2C, supplemental Figure 2E-F). During aerobic glycolysis, glucose is converted to pyruvate and subsequently to acetyl-CoA to fuel the TCA cycle and OXPHOS. To exclude the possibility that a perturbed AKT signaling indirectly affected mitochondrial respiration because of its effect on glycolysis, the OCR was determined in LME-1 and MM1.S, with either glucose, pyruvate, or glutamine present in the Seahorse medium as a single carbon source. OCR decreased upon AKT inhibition in the presence of pyruvate as the sole carbon source, indicating that AKT directly regulates mitochondrial respiration. This experiment further indicated that glutamine can be used by HMCLs to fuel OXPHOS, which requires AKT activity. LME-1 cells showed low OCR when only glucose was present, in contrast to MM1.S (supplemental Figure 2G). The effects of AKT inhibition on the OCRs were similar in MCL-1 overexpressing MM cells and the control cells, indicating that survival and mitochondrial respiration are independently regulated by AKT (supplemental Figure 2H).
FOXO suppresses genes involved in glycolysis, the TCA cycle, and OXPHOS
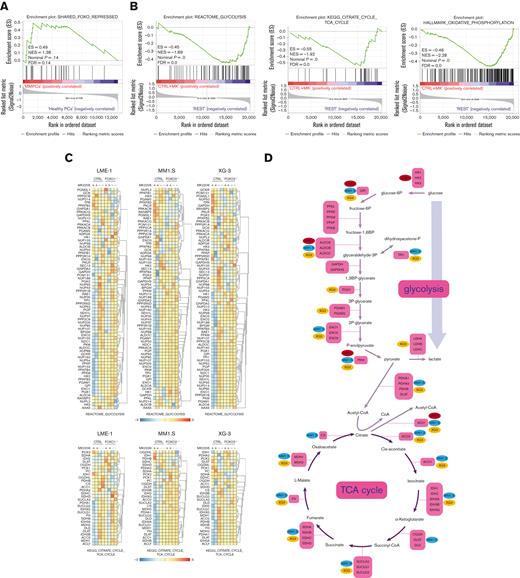
AKT was shown to regulate the expression of metabolic genes, primarily by controlling FOXO TFs.20,32 Previously, we defined a gene set that became repressed by FOXO upon AKT inhibition in MM cells (shared FOXO–repressed).18 GSEA indicated that the expression of these genes was enriched in MM cells (n = 75) in comparison with healthy donor plasma cells (n = 15),23 suggesting that FOXO is less active in MM cells (Figure 3A). To investigate the effects of FOXO activation on the expression of genes involved in metabolism, gene expression data obtained from FOXO1- (LME-1) or FOXO3- (MM1.S and XG-3) deficient clones treated with MK2206 were investigated. Glycolysis, TCA cycle, and OXPHOS gene sets significantly depleted in MK2206-treated control clones in comparison with FOXO-deficient and untreated clones (Figure 3B, supplemental Figure 3A-C). Most genes involved in glycolysis and the TCA cycle significantly downregulated in a FOXO-dependent manner after AKT inhibition (Figure 3C). Notably, the expression of glucose-6-phosphate isomerase, aldolase (ALDOA, ALDOB, and ALDOC), and PKM reduced most prominently (>1.5-fold) in all 3 tested HMCLs, whereas the majority of the other genes involved in glycolysis were significantly downregulated in at least 1 of the HMCLs studied (Figure 3D). Similarly, the expression of genes associated with most steps of the TCA cycle were downregulated (>1.2-fold) in a FOXO-dependent fashion upon AKT inhibition in at least 2 HMCLs, whereas the expression of ATP citrate lyase decreased in all 3 HMCLs (Figure 3D). These results indicate that AKT signaling is required to restrain the FOXO-dependent suppression of many key metabolic enzymes in MM cells.
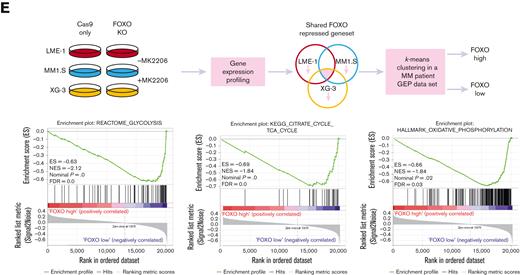
FOXO represses the expression of metabolic genes in MM cells. (A) GSEA in MMPCs from newly diagnosed patients with MM (n = 75) vs bone marrow plasma cells obtained from healthy donors (n = 15) showing that the shared FOXO–repressed gene set is enriched in MMPCs, indicating lower FOXO activity in these cells. FDR, ES, NES, and P-value are shown in the plots. (B) GSEA in Cas9-CTRL HMCL clones treated overnight with 2.5 μM MK2206 (‘CTRL+MK’) vs the combination of untreated CTRL clones and FOXO KO clones, either treated overnight with 2.5 μM MK2206 or left untreated (‘REST’). Datasets from the HMCLs LME-1, MM1.S, and XG-3 were combined for GSEA. Enrichment plots for Reactome glycolysis, KEGG TCA cycle, and GSEA Hallmark_oxidative_phosphorylation gene sets are shown. FDR, ES, NES, and P-values are shown in the plots. (C) Heatmaps showing (z-score transformed) expression of Reactome glycolysis genes (upper panels) and KEGG_TCA cycle genes (lower panels) in LME-1 CTRL clones and LME-1 FOXO1-knockout (FOXO1-/-) clones (left panels), MM1.S CTRL clones and FOXO3-KO (FOXO3-/-) (middle panels), and XG-3 CTRL clones and FOXO3-KO clones (right panels) that were treated overnight with 2.5 μM MK2206 or left untreated. Z-score values are depicted, ranging from −3 (blue) indicating low expression to 3 (red) indicating high expression. (D) Schematic representation of the glycolysis metabolic pathway and the TCA cycle. Enzymes (purple boxes), metabolites, and conversions (arrows) are indicated. For the glycolysis pathway, red, blue, and yellow symbols indicate >1.5-fold (FOXO-dependent) decrease in gene expression in LME-1, MM1.S, and XG-3, respectively. For the TCA cycle a >1.2-fold (FOXO-dependent) decrease in gene expression is indicated. (E) Schematic overview of k-means clustering approach (10 rounds) to define 2 groups of patients with MM (n = 542) based on the expression of the experimentally defined shared FOXO–repressed gene set identified in the LME-1, MM1.S, and XG-3 HMCLs, as previously described by us.19 Groups of patients with MM defined by k-means clustering were labeled as ‘FOXO high’ (n = 387) and ’FOXO low’ (n = 155). GSEA enrichment plots are shown, interrogating Reactome for glycolysis, KEGG for TCA cycle, and GSEA for Hallmark_oxidative_phosphorylation gene sets. CTRL, control; ES, enrichment score; FDR, false discovery rate; KEGG, Kyoto Encyclopedia of Genes and Genomes; KO, knockout; NES, normalized enrichment score.
FOXO represses the expression of metabolic genes in MM cells. (A) GSEA in MMPCs from newly diagnosed patients with MM (n = 75) vs bone marrow plasma cells obtained from healthy donors (n = 15) showing that the shared FOXO–repressed gene set is enriched in MMPCs, indicating lower FOXO activity in these cells. FDR, ES, NES, and P-value are shown in the plots. (B) GSEA in Cas9-CTRL HMCL clones treated overnight with 2.5 μM MK2206 (‘CTRL+MK’) vs the combination of untreated CTRL clones and FOXO KO clones, either treated overnight with 2.5 μM MK2206 or left untreated (‘REST’). Datasets from the HMCLs LME-1, MM1.S, and XG-3 were combined for GSEA. Enrichment plots for Reactome glycolysis, KEGG TCA cycle, and GSEA Hallmark_oxidative_phosphorylation gene sets are shown. FDR, ES, NES, and P-values are shown in the plots. (C) Heatmaps showing (z-score transformed) expression of Reactome glycolysis genes (upper panels) and KEGG_TCA cycle genes (lower panels) in LME-1 CTRL clones and LME-1 FOXO1-knockout (FOXO1-/-) clones (left panels), MM1.S CTRL clones and FOXO3-KO (FOXO3-/-) (middle panels), and XG-3 CTRL clones and FOXO3-KO clones (right panels) that were treated overnight with 2.5 μM MK2206 or left untreated. Z-score values are depicted, ranging from −3 (blue) indicating low expression to 3 (red) indicating high expression. (D) Schematic representation of the glycolysis metabolic pathway and the TCA cycle. Enzymes (purple boxes), metabolites, and conversions (arrows) are indicated. For the glycolysis pathway, red, blue, and yellow symbols indicate >1.5-fold (FOXO-dependent) decrease in gene expression in LME-1, MM1.S, and XG-3, respectively. For the TCA cycle a >1.2-fold (FOXO-dependent) decrease in gene expression is indicated. (E) Schematic overview of k-means clustering approach (10 rounds) to define 2 groups of patients with MM (n = 542) based on the expression of the experimentally defined shared FOXO–repressed gene set identified in the LME-1, MM1.S, and XG-3 HMCLs, as previously described by us.19 Groups of patients with MM defined by k-means clustering were labeled as ‘FOXO high’ (n = 387) and ’FOXO low’ (n = 155). GSEA enrichment plots are shown, interrogating Reactome for glycolysis, KEGG for TCA cycle, and GSEA for Hallmark_oxidative_phosphorylation gene sets. CTRL, control; ES, enrichment score; FDR, false discovery rate; KEGG, Kyoto Encyclopedia of Genes and Genomes; KO, knockout; NES, normalized enrichment score.
To explore whether these findings also apply to patients with MM, a large GEP dataset comprising 542 patients with MM was partitioned into 2 groups representing either high (n = 387) or low (n = 155) FOXO activity, based on the expression of the shared FOXO–repressed gene set.18 GSEA showed that patients with MM with low FOXO activity were significantly enriched (FDR <0.25) for glycolysis, TCA cycle, and OXPHOS-associated gene sets in comparison with those with high FOXO activity. These results confirm that FOXO suppresses the expression of genes involved in metabolic pathways in patients with MM (Figure 3E).
AKT signaling regulates glycolysis and OXPHOS activity of MM cells in a FOXO-dependent manner
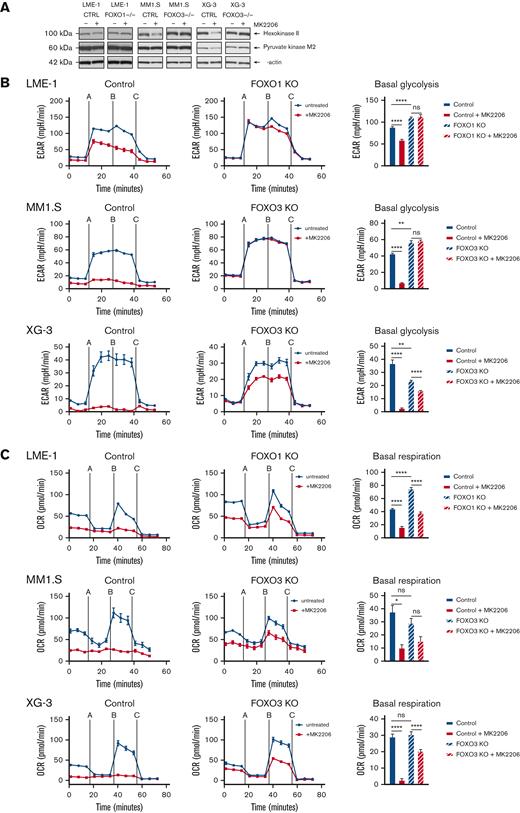
The role of FOXO downstream of AKT in MM cells was further substantiated by the FOXO-dependent decrease of HK2 protein expression and a modest decrease in PKM2 expression (Figure 4A). Furthermore, AKT inhibition significantly decreased glycolysis, which required functional FOXO expression (Figure 4B). In LME-1, FOXO1 was required, whereas in MM1.S and XG-3, FOXO3 was required, in line with our previous findings in these HMCLs.18 In addition, AKT inhibition almost completely abolished OXPHOS in the control clones, but not in the FOXO-deficient clones (Figure 4C). Together, these results show that AKT crucially regulates the metabolic functioning of MM cells by controlling the activity of FOXO.
AKT regulates glycolysis and OXPHOS in a FOXO-dependent fashion in MM cells. (A) Immunoblot analysis of HK2 and PKM2 expression in LME-1, MM1.S, and XG-3 Cas9-CTRL clones CTRL and FOXO KO clones (FOXO1 for LME-1, and FOXO3 for MM1.S and XG-3) treated overnight with 2.5 μM MK2206 or left untreated. β-actin served as a loading control. (B) Seahorse XF glycolysis stress test profiles of CTRL clones (left panels, n = 2), and FOXO knockout clones (middle panels, n = 2) treated for 20 hours with 2.5 μM MK2206 (red lines) or left untreated (blue lines). Means ± SEM of ECAR values are depicted (n = 5 measurements for each clone) and Seahorse XF injections are shown: glucose (=A), oligomycin (=B), 2-DG (=C). Bar graphs (right panels) depict basal glycolysis values, means ± SEM are shown (one-way ANOVA, with Bonferroni multiple comparison test). (C) Seahorse XF mitochondrial stress test profiles of CTRL clones (left panels, n = 2), and FOXO KO clones (middle panels, n = 2) treated for 20 hours with 2.5 μM MK2206 (blue lines) or left untreated (red lines). Means ± SEM of OCR values are depicted (n = 5 measurements for each clone) and Seahorse XF injections are shown: oligomycin (=A), FCCP (=B), rotenone and antimycin A (=C). Bar graphs (right panels) depict basal respiration values, and means ± SEM are shown (one-way ANOVA, with Bonferroni multiple comparison test, ∗∗∗∗P < .0001, ∗∗∗P < .001, ∗∗P < .01, ∗P < .05; ns = not significant.
AKT regulates glycolysis and OXPHOS in a FOXO-dependent fashion in MM cells. (A) Immunoblot analysis of HK2 and PKM2 expression in LME-1, MM1.S, and XG-3 Cas9-CTRL clones CTRL and FOXO KO clones (FOXO1 for LME-1, and FOXO3 for MM1.S and XG-3) treated overnight with 2.5 μM MK2206 or left untreated. β-actin served as a loading control. (B) Seahorse XF glycolysis stress test profiles of CTRL clones (left panels, n = 2), and FOXO knockout clones (middle panels, n = 2) treated for 20 hours with 2.5 μM MK2206 (red lines) or left untreated (blue lines). Means ± SEM of ECAR values are depicted (n = 5 measurements for each clone) and Seahorse XF injections are shown: glucose (=A), oligomycin (=B), 2-DG (=C). Bar graphs (right panels) depict basal glycolysis values, means ± SEM are shown (one-way ANOVA, with Bonferroni multiple comparison test). (C) Seahorse XF mitochondrial stress test profiles of CTRL clones (left panels, n = 2), and FOXO KO clones (middle panels, n = 2) treated for 20 hours with 2.5 μM MK2206 (blue lines) or left untreated (red lines). Means ± SEM of OCR values are depicted (n = 5 measurements for each clone) and Seahorse XF injections are shown: oligomycin (=A), FCCP (=B), rotenone and antimycin A (=C). Bar graphs (right panels) depict basal respiration values, and means ± SEM are shown (one-way ANOVA, with Bonferroni multiple comparison test, ∗∗∗∗P < .0001, ∗∗∗P < .001, ∗∗P < .01, ∗P < .05; ns = not significant.
Expression of FOXO-regulated metabolic genes predicts survival of patients with MM
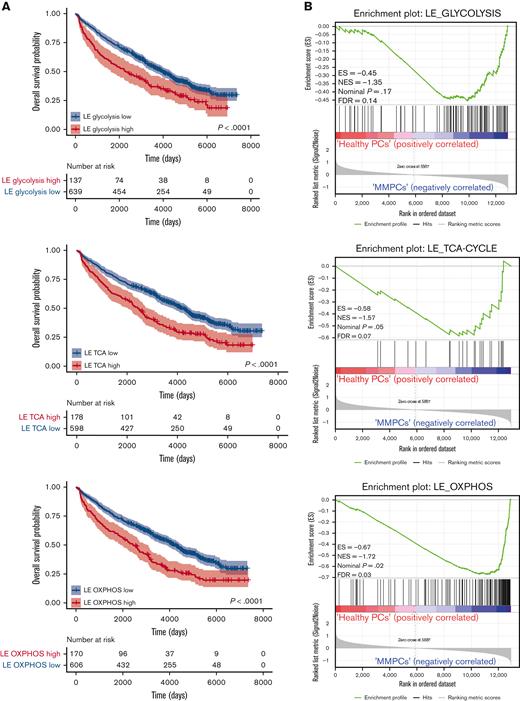
To assess whether the expression of FOXO-regulated metabolic genes is of prognostic importance for patients with MM, we investigated an extended GEP dataset obtained from patients with MM (n = 776), which includes survival data.22,25,33 First, the metabolic genes most strongly regulated by FOXO in MM were identified by performing an LE analysis on the GSEA data, in which AKT inhibitor–treated control HMCL clones were compared with FOXO-deficient clones (Figure 3A and supplemental Figure 3A-C). LE analysis provided the genes that contributed most prominently to the core enrichment of multiple gene sets associated with glycolysis, the TCA cycle, and OXPHOS (supplemental Table 1). Second, these LE gene sets were used to partition patients with MM into 2 groups using k-means clustering, representing high or low expression of LE FOXO–repressed genes from glycolysis-, the TCA cycle– or OXPHOS-associated gene sets. GEP data were obtained using samples from patients with MM who were at baseline and were undergoing total therapy 2 (TT2) or TT3 protocols.22 The clinical course for the patients showing high expression of these FOXO-repressed metabolic genes was characterized by a highly inferior OS (P < .0001). The 5.5-year survival rate was 54% in the LE glycolysis high group (n = 137) vs 71% in the LE glycolysis low group (n = 639). For the LE TCA and LE OXPHOS high groups (n = 178 and n = 170, respectively), the 5.5-year survival rate was 57% vs for the LE TCA and LE OXPHOS low groups, it was 71% (n = 598 and n = 606, respectively) (Figure 5A). In addition, we show that the LE glycolysis, LE TCA, and LE OXPHOS gene sets are significantly enriched in MMPCs from newly diagnosed patients (Figure 5B) and patients with refractory/relapsed MM in comparison with those having healthy donor plasma cells, but not in those with monoclonal gammopathy of undetermined significance. Whereas in patients with smoldering MM, only the LE OXPHOS gene set was significantly enriched (supplemental Figure 4A-C). From this we conclude that AKT-mediated negative regulation of FOXO licenses the expression of glycolysis- and TCA-associated genes in MM but not in premalignant plasma cell disorders, most likely reflecting higher energetic demands due to the increased proliferation of MM cells.
Expression of FOXO-repressed metabolic genes predicts poor survival in patients with MM. (A) Kaplan-Meier univariate analysis for the OS of k-means clustering–defined groups of patients with MM (776 patients in total). Patients were clustered based on the FOXO-regulated LE gene sets; LE glycolysis, LE TCA cycle, or LE OXPHOS, which were derived by combining the LE genes from GSEAs performed for several glycolysis, TCA cycle, or OXPHOS gene sets (Supplemental Table 1). Groups were defined as ‘high’ (red lines) or ‘low’ (blue lines) expressing groups. Numbers of patients at risk are tabulated below. (B) GSEA enrichment plots show enrichment of the FOXO-regulated LE glycolysis, LE TCA cycle, and LE OXPHOS gene sets (supplemental Table 1) in MM plasma cells from newly diagnosed patients (MMPCs, n = 75) compared with plasma cells from healthy donors (n = 15). FDR, ES, NES, and P-value are depicted in the plots.
Expression of FOXO-repressed metabolic genes predicts poor survival in patients with MM. (A) Kaplan-Meier univariate analysis for the OS of k-means clustering–defined groups of patients with MM (776 patients in total). Patients were clustered based on the FOXO-regulated LE gene sets; LE glycolysis, LE TCA cycle, or LE OXPHOS, which were derived by combining the LE genes from GSEAs performed for several glycolysis, TCA cycle, or OXPHOS gene sets (Supplemental Table 1). Groups were defined as ‘high’ (red lines) or ‘low’ (blue lines) expressing groups. Numbers of patients at risk are tabulated below. (B) GSEA enrichment plots show enrichment of the FOXO-regulated LE glycolysis, LE TCA cycle, and LE OXPHOS gene sets (supplemental Table 1) in MM plasma cells from newly diagnosed patients (MMPCs, n = 75) compared with plasma cells from healthy donors (n = 15). FDR, ES, NES, and P-value are depicted in the plots.
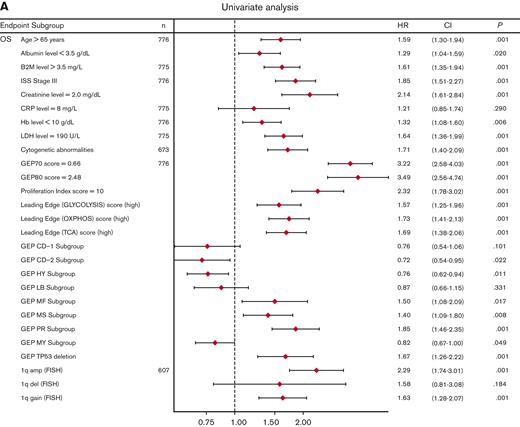
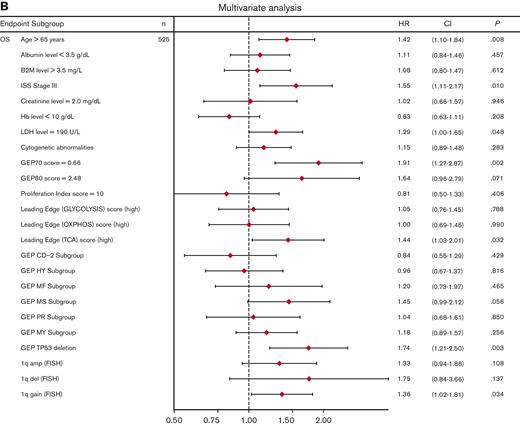
Univariate analysis showed that LE glycolysis (high), LE TCA (high), and LE OXPHOS (high) represent adverse features for OS (hazard ratios 1.6-1.7) in conjunction with other well-known adverse factors (Figure 6A). In the multivariate stepwise Cox regression analysis, the LE TCA (high)–defined high-risk status remained an adverse variable that predicted inferior OS, along with age (>65 years), increased LDH levels (≥190 U/L), GEP70 score,33 GEP-derived delTP53,34 and gain of chromosome 1q (Figure 6B).
Univariate and multivariate Cox regression analysis of OS in the TT2 and TT3 cohort of patients with MM. (A) Univariate analysis of subgroups (n = 776 patients; alternative numbers of patients indicated in case values/data were missing) for OS. P-values were determined with Wald χ2 test in Cox regression analysis. All univariate P values were reported regardless of significance. (B) Multivariate analysis of subgroups (n = 525) for OS. HR (diamond symbols) and 95% CI (lines) are indicated. CI, confidence interval; B2M, beta2-microglobulin; Hb, hemoglobin; HR, hazard ratio; ISS, International Staging System; LDH, lactate dehydrogenase.
Univariate and multivariate Cox regression analysis of OS in the TT2 and TT3 cohort of patients with MM. (A) Univariate analysis of subgroups (n = 776 patients; alternative numbers of patients indicated in case values/data were missing) for OS. P-values were determined with Wald χ2 test in Cox regression analysis. All univariate P values were reported regardless of significance. (B) Multivariate analysis of subgroups (n = 525) for OS. HR (diamond symbols) and 95% CI (lines) are indicated. CI, confidence interval; B2M, beta2-microglobulin; Hb, hemoglobin; HR, hazard ratio; ISS, International Staging System; LDH, lactate dehydrogenase.
Our results suggest that the expression of a subset of metabolic genes is an important output parameter of AKT signaling, which crucially impacts the malignant behavior of MM cells and represents an independent adverse feature.
Discussion
Activation of PI3K/AKT signaling is an established oncogenic feature of MM cells, sustaining several antiapoptotic and proliferative pathways. We have previously shown that prosurvival AKT signaling in MM critically depends on the inhibition of FOXO TFs, resulting in the stabilization of the antiapoptotic MCL-1 protein.18 Here, we show that the expression of key metabolic genes in MM is also regulated by AKT signaling that restrains FOXO-dependent gene repression. Furthermore, we show that MM cells perform glycolysis almost at their maximum rates and have a constrained metabolic adaptability. This implies that most glucose is converted into lactate and cannot be used for the TCA cycle, suggesting that other carbon sources fuel OXPHOS in MM.
MM cells are characterized by the high expression of lactate dehydrogenase,35-37 which catalyzes the conversion of pyruvate into lactate instead of into acetyl-CoA. However, our results suggest that acetyl-CoA is not limiting for OXPHOS in MM cells because an increased acetyl-CoA formation caused by DCA treatment did not boost basal mitochondrial respiration. Nonetheless, DCA increased the maximum respiration rate in MM cells, indicating an increased influx of pyruvate into the mitochondria and improved usage of mitochondrial respiration. Similar effects of DCA treatment were observed in other cancer types, such as non-small cell lung cancer cells38 and breast cancer cells.39 Our results indicate that the reliance of MM cells on glycolysis for proliferation and survival is not related to an intrinsic inability to perform OXPHOS because MM cells are able to switch to OXPHOS when cultured in the presence of galactose instead of glucose. However, this resulted in reduced proliferation and cell death in several HMCLs, suggesting that the ATP generated from mitochondrial respiration is not sufficient to meet the metabolic demands of MM cells. Of note, galactose is oxidized to pyruvate, yielding all glycolysis intermediates, thus indicating that it is unlikely that cell death is caused by the lack of glycolysis-derived metabolites required for anabolic processes.30
The increased glycolytic rate seems counterintuitive because glycolysis yields far less ATP per glucose molecule than that in mitochondrial respiration. However, at high glucose uptake rates, the activation of glycolysis and decreased mitochondrial respiration results in more ATP production due to a more efficient cytoplasmic solvent capacity.40 Rapidly proliferating cells are characterized by a high glucose uptake capacity,41 which may explain the glycolytic phenotype of HMCLs. In agreement, the glycolytic rate of primary MM cells was lower than that of HMCLs, perhaps explained by the low in vitro proliferative capacity of primary cells. Nevertheless, the glycolytic reserve of the primary MM cells was limited and similar to that observed in the HMCLs. Also, basal respiration and spare respiratory capacity were similar in the primary MM cells and HMCLs.
Most HMCLs show an increased expression of the MYC proto-oncogene because of chromosomal rearrangements and/or mutations.42 An aberrant MYC expression is a major determinant of the metabolic phenotype of MM cells,35 and may drive glycolysis because it directly activates the expression of almost all glycolysis genes.43 Correspondingly, the glycolytic reserve was comparably low in BLCLs that represent archetypal MYC-driven lymphomas. Nonetheless, the aberrantly activated MYC-dependent gene expression is still subject to auxiliary regulation, in which PI3K/AKT signaling plays a pivotal role.44,45 However, the expression of MYC was significantly different in patients with MM classified as FOXO high (low AKT activity) vs those classified as FOXO low (high AKT activity) (supplemental Figure 5). Moreover, AKT kinase is a major driver of glycolysis, stimulating the switch from mitochondrial respiration to aerobic glycolysis.46
Our results show that metabolic modulation by DCA and galactose adaptation resulted in the activation of AKT in MM cells and a concomitant FOXO inactivation, suggesting that altered metabolic demands are relayed into the PI3K/AKT signaling pathway, likely representing feedback regulation. Furthermore, we demonstrated that AKT signaling is of crucial importance for glycolysis and mitochondrial respiration in MM cells. It was shown previously that AKT has a direct effect on metabolism by phosphorylating several metabolic enzymes, such as HK2,47 ACLY,48 and phosphofructokinase.49 Although this may also occur in MM cells, our results suggest that this is not the major mode of action by which AKT regulates the metabolic features of MM cells. We demonstrated that FOXO was an absolute requirement for the effects of AKT inhibition, suggesting that AKT regulates metabolism in MM, predominantly at the transcriptional level. This is further substantiated by our GEP results showing that AKT inhibition resulted in the FOXO-dependent decreased expression of metabolic genes and gene sets. These effects appear to be cell/tissue context–specific because several studies report the opposite, showing that FOXO expression is actually required for glucose metabolism and the TCA cycle in neural and intestinal stem cells.50,51 In agreement with our data, it was shown that FOXO3a antagonized MYC and repressed genes involved in the mitochondrial respiration in colon cancer cells52 and in glycolysis in melanoma cells.53
Importantly, our results suggest that the effects of AKT inhibition on metabolism are uncoupled from its effect on MM survival, as overexpression of the full length (40 kDa) antiapoptotic protein MCL-1 prevented AKT inhibitor–induced cell death but did not rescue glycolysis or OXPHOS activity. This result is surprising because it was previously shown that a shorter (36 kDa) MCL-1 isoform is required for normal mitochondrial bioenergetics in mouse embryonic fibroblasts.54 However, it is unlikely that the overexpression of the shorter MCL-1 isoform would rescue mitochondrial respiration because we found many OXPHOS-associated genes decreased in a FOXO-dependent fashion upon AKT inhibition. Moreover, our results suggest that AKT signaling sustains OXPHOS independently of its effects on glycolysis because AKT inhibition still decreased mitochondrial respiration when pyruvate was present as the sole carbon source, thereby obviating the need for pyruvate provided by glycolysis. This suggests that AKT is the pivotal kinase that crucially regulates both glycolysis and mitochondrial respiration in MM.
Interestingly, our findings could be extended to patients with MM and have important prognostic implications. Classification of patients with MM according to several metabolism-associated gene sets revealed that the FOXO-dependent repression of these genes confers a favorable prognosis. These results suggest that AKT kinase activity exerts its oncogenic function in MM by driving glycolysis and the TCA cycle, which is associated with aggressive disease. In agreement, we found that the FOXO-mediated repression of key metabolic genes is lost in MM plasma cells in comparison with plasma cells from healthy donors, patients with monoclonal gammopathy of undetermined significance, and patients with smoldering MM, suggesting that the progressive loss of FOXO-dependent gene regulation accompanies the malignant transformation of plasma cells. This notion, in combination with our finding that MM cells display limited metabolic adaptability suggests that the FOXO-dependent regulation of metabolic features may represent an attractive therapeutic Achilles’ heel. However, the therapeutic targeting of metabolic enzymes may not be straightforward, given the many redundancies within and between metabolic pathways and the lack of truly specific inhibitors/therapeutic agents. In line with this, we showed that treatment with the purported glycolysis inhibitor 2-DG resulted in the variable induction of cell death in HMCLs and BCLs, which was not related to their glycolytic or respiratory capacity. In that respect, (combinatorial) targeting of signaling pathways that regulate metabolic plasticity may be a preferred approach, placing the AKT kinase in the limelight again, where the prevention of feedback regulation and/or activation of salvage pathways will be key for a successful therapeutic modality.
The overall conclusion here, and of our previous work,18 is that metabolism, proliferation, and survival of MM cells critically converge on the tumor-suppressive function of FOXO, which is actively restrained by AKT signaling. As a prospect, the therapeutic exploitation of these aspects of FOXO may guide the development of novel treatments for MM.
Acknowledgments
The authors thank Berend Hooibrink (flow cytometry core facility, Amsterdam University Medical Centers) for excellent flow cytometry assistance. This study was supported by a grant from the Dutch Cancer Society (KWF) (AMC 2018-11597) (J.E.J.G.); grants or awards from the US Department of Defense, National Cancer Institute (R01 CA236814) (DoD; CA180190), the Myeloma Crowd Research Initiative award, and the Riney Family Multiple Myeloma Research Program Fund (F.Z.); and the Translational Research Institute (TRI) and grant KL2 TR003108 through the National Center for Advancing Translational Sciences of the National Institutes of Health (NIH) (T.C.A.). The content is solely the responsibility of the authors and does not necessarily represent the official views of the NIH. This study was approved by the Institutional Review Board of the University of Arkansas for Medical Sciences #273740).
Authorship
Contribution: T.A.B., G.d.W., and J.E.J.G. designed the study and wrote the manuscript; T.A.B. and G.d.W performed the experiments and analyses; R.J.B. and G.H.K. provided analytical support; J.D.S., T.C.A., and F.Z. performed analyses on clinical data and gene expression datasets; R.H.H. provided theoretical and technical input and supervised the metabolic profiling experiments; M.S., C.J.M.v.N., and J.E.J.G. supervised the study; and all authors read and approved the final manuscript.
Conflict-of-interest disclosure: The authors declare no competing financial interests.
Correspondence: Jeroen E.J. Guikema, Department of Pathology, Amsterdam University Medical Centers, University of Amsterdam, Meibergdreef 9, 1105 AZ, Amsterdam, The Netherlands; e-mail: j.e.guikema@amsterdamumc.nl.
References
Author notes
Original data are available on request from the corresponding author, Jeroen E. J. Guikema (j.e.guikema@amsterdamumc.nl).
The full-text version of this article contains a data supplement.

