After publication, errors in the statistical analysis of the data were discovered. The authors have reanalyzed the data and found minor discrepancies in the reported statistics as well as the associated figures. The corrections do not change any of the conclusions of the study.
In the visual abstract, the curve labeled “PET-neg” has been corrected, and the P value should be .87, not .70. The corrected visual abstract is shown below.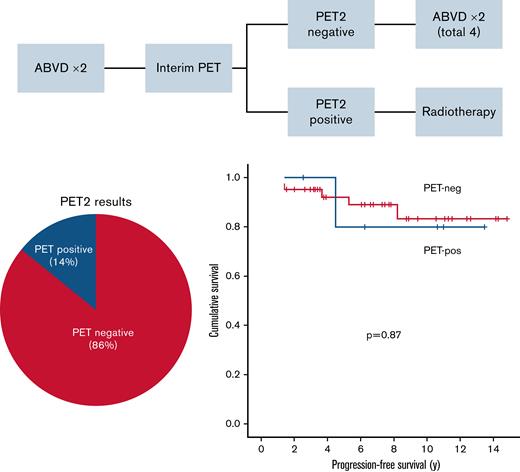

Page 3647: In the abstract, for the median follow-up of 10.5 years, the 5-year progression-free survival (PFS) percentage should be 91%, not 93%; the no difference by treatment era P value should be .15, not .13; and for patients who had a PET2 scan, the P value for 5-year PFS should be .87, not .70.
Page 3649: For those living patients who had a median follow-up of 10.5 years, their 5-year PFS should be 91%, not 93%; the P value for PFS by age should be .15, not .65; the P value for stage at diagnosis should be .52, not .82; the P value for supra- or infradiagphramatic disease should be .83, not .60; the P value for largest mass size should be .28, not .96; the P value for sex should be .49, not .13; for PET era patients, the P value for PFS in patients staged with or without PET should be .92, not .57; for those who received active treatment, the P value should be .58, not .91; the PFS in the PET era after a follow-up of 7.3 years should be 86%, not 89%, and the P value should be .15, not .13. The number of patients who had stage II disease should be 41, not 42; the number of these patients who were managed with active therapy that incorporated RT should be 26, not 25; the CMT value should be 25, not 24; the value for chemotherapy alone should be 15, not 17; the value of ABVD-like should be 14, not 16; and in Figure 1A, the curve has been corrected. The corrected Figure 1A is shown below.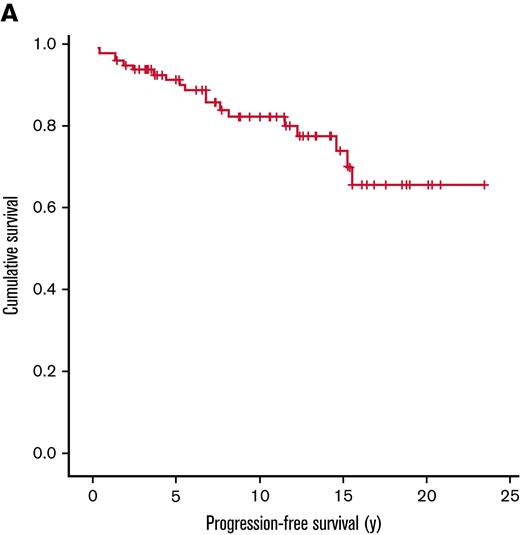

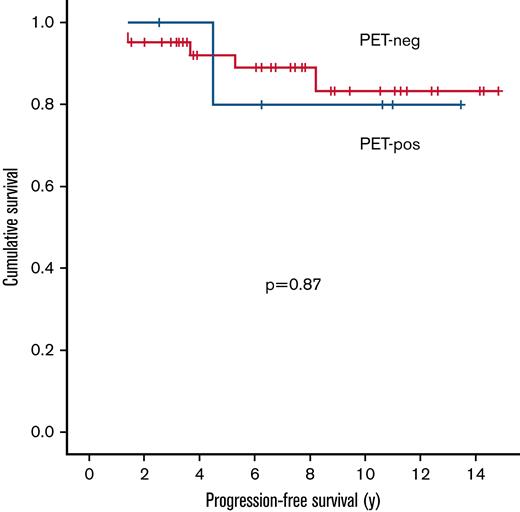
Page 3650: The P value for PFS of PET-evaluated patients should be .87, not .70; in Figure 2, the curves labeled “Routine RT era” and “PET era” have been corrected; and in Figure 2A, the P value should be .15, not .13. The corrected Figure 2 is shown below.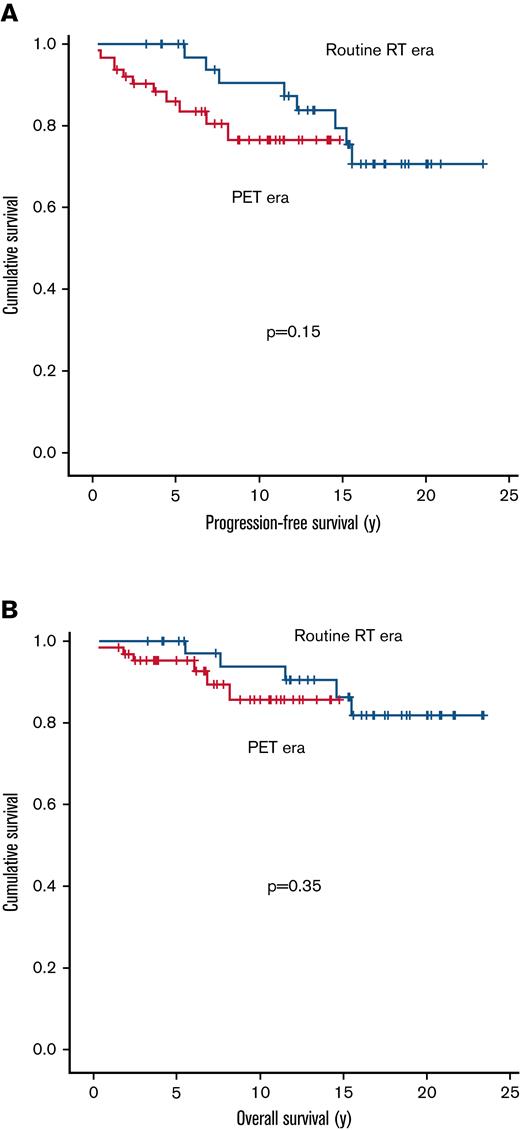

Page 3652: In Figure 4, the “PET-neg” curve has been corrected, and the P value in the figure and the legend should be .87, not .70. The corrected Figure 4 is shown below.