Key Points
Activation of PI3K signaling is sufficient to induce a histiocytosis-like disease in vivo at the monocyte/dendritic cell precursor level.
The PI3Kα-specific inhibitor alpelisib shows promising clinical efficacy in PIK3CA-mutant LCH.
Abstract
Langerhans cell histiocytosis (LCH) is an inflammatory myeloid neoplasm characterized by the accumulation of clonal mononuclear phagocyte system cells expressing CD1a and CD207. In the past decade, molecular profiling of LCH as well as other histiocytic neoplasms demonstrated that these diseases are driven by MAPK activating alterations, with somatic BRAFV600E mutations in >50% of patients with LCH, and clinical inhibition of MAPK signaling has demonstrated remarkable clinical efficacy. At the same time, activating alterations in kinase-encoding genes, such as PIK3CA, ALK, RET, and CSF1R, which can activate mitogenic pathways independent from the MAPK pathway, have been reported in a subset of histiocytic neoplasms with anecdotal evidence of successful targeted treatment of histiocytoses harboring driver alterations in RET, ALK, and CSF1R. However, evidence supporting the biological consequences of expression of PIK3CA mutations in hematopoietic cells has been lacking, and whether targeted inhibition of PI3K is clinically efficacious in histiocytic neoplasms is unknown. Here, we provide evidence that activating mutations in PIK3CA can drive histiocytic neoplasms in vivo using a conditional knockin mouse expressing mutant PIK3CAH1047R in monocyte/dendritic cell progenitors. In parallel, we demonstrate successful treatment of PIK3CA-mutated, multisystemic LCH using alpelisib, an inhibitor of the alpha catalytic subunit of PI3K. Alpelisib demonstrated a tolerable safety profile at a dose of 750 mg per week and clinical and metabolic complete remission in a patient with PIK3CA-mutated LCH. These data demonstrate PIK3CA as a targetable noncanonical driver of LCH and underscore the importance of mutational analysis–based personalized treatment in histiocytic neoplasms.
Introduction
Langerhans cell histiocytosis (LCH) is an inflammatory myeloid neoplasm characterized by the accumulation of clonal cells of the mononuclear phagocyte system expressing CD1a and CD207 (Langerin).1,2 LCH affects both children and adults and typically ranges from an indolent unifocal form to a progressive multisystemic disease.3 Adults with multisystem LCH are managed with systemic therapy, with the nature of the therapeutic regimen depending on whether the patient presents with involvement of the central nervous system (CNS) or risk organs such as bone marrow, liver, or spleen. For adult patients presenting with multisystem LCH absent of CNS or risk organ involvement, first-line therapy consists of single-agent cytarabine or cladribine.4
In the past decade, molecular profiling of LCH as well as other histiocytic neoplasms such as Erdheim-Chester disease (ECD) demonstrated that these diseases are dependent on somatic MAPK activating mutations with somatic BRAFV600E mutations present in >50% of patients.5-7 Consequently, remarkable response to BRAF inhibitors, including vemurafenib and dabrafenib, have been demonstrated in patients with BRAFV600E-mutant histiocytoses.8-11 Based on these findings, patients with BRAF-mutant LCH who fail on single-agent chemotherapy or who present with CNS and/or risk organ involvement are treated with BRAF inhibitors. Moreover, the majority of BRAFV600–wild-type histiocytoses still appear to depend on MAPK pathway signaling, because MAPK inhibition at the level of MEK1/2 has been proven as efficacious for treating histiocytic neoplasms.12 Furthermore, activating mutations in the MEK1/2 kinases are the second most common somatic genomic alteration in LCH after BRAF mutations.
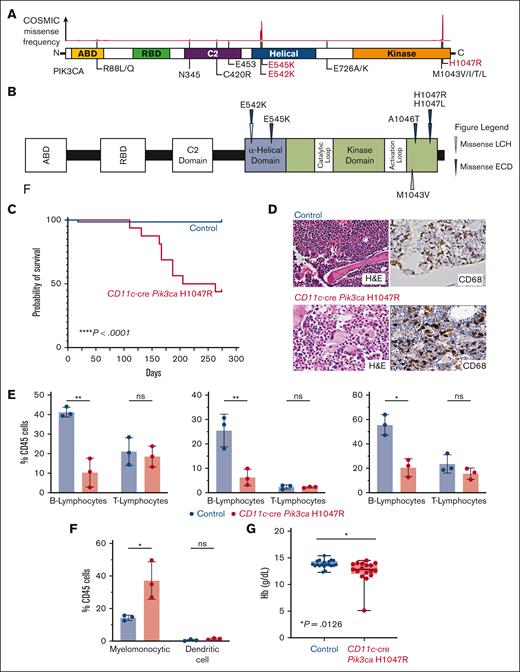
Despite the above findings, numerous patients with histiocytosis lack activating mutations in genes encoding RAS, RAF, or MEK enzymes that act in the MAPK pathway.5 In some of these cases, other mutations have been identified in mitogenic pathways parallel to the RAS-RAF-MEK MAPK pathway. One such pathway of interest is the phosphatidylinositol 3-kinase (PI3K)–AKT-mTOR pathway, which governs metabolism, motility, proliferation, growth, and survival.13 We recently demonstrated that the PI3K-AKT-mTOR pathway is upregulated in patients with histiocytosis via alterations in microRNAs (miRNAs/miRs) governing PI3K/mTOR activation.14 Moreover, we previously identified somatic hotspot activating mutations in PIK3CA (phosphatidylinositol-4,5-bisphosphate 3-kinase catalytic subunit alpha), which encodes the p110α protein, the catalytic subunit of PI3K, in several patients with ECD (Figure 1A-B).6,15 These mutations have been demonstrated to increase the kinase activity of PIK3CA and contribute to cellular transformation in solid tumor models with concomitant phosphorylation of proteins in the AKT pathway.16 In addition, there is a clear clinical benefit to targeting mutant PIK3CA using the PI3Kα-specific inhibitor alpelisib in breast cancer and congenital genetic disorders driven by activating PIK3CA mutations.17 However, evidence supporting the biological consequences of expression of oncogenic alterations in PIK3CA in monocyte and dendritic cell precursors is still lacking. Moreover, the potential therapeutic benefit of targeting PIK3CA driver mutations in the context of histiocytosis is unknown. In this study, we investigated the biological consequences of oncogenic PIK3CA mutations on histiocytosis pathogenesis using a novel CD11c-cre-Rosa26-Pik3caH1047R/+ knockin mouse model. Furthermore, to the best of our knowledge, we present the first clinical experience and evidence for therapeutic benefit of PI3Kα inhibition in PIK3CA-mutant, multisystem LCH.
Recurrent activating PIK3CA mutations drives histiocytic neoplasms in vivo. (A) Diagram of PIK3CA alterations across cancer showing hotspots in the helical and kinase domains, the locations of activating mutations. (B) Protein diagram summarizing recurrent PIK3CA mutations across histiocytic neoplasm subtypes. (C) Kaplan-Meier curve of primary CD11c-cre Pik3caH1047R and littermate Pik3ca control mice; n = 15-20 mice; ∗∗∗∗P < .0001. Log-rank (Mantel-Cox) test. (D) Representative histological images of bone marrow showing trilineage hematopoiesis in control mice with no evidence of histiocytosis compared with the bone marrow of CD11c-cre Pik3caH1047R that shows involvement of the bone marrow by increased CD68+, large, foamy histiocytes, and multinucleated giant cells reminiscent of a human histiocytic neoplasm (H&E stain and murine CD68 immunohistochemistry; 600× magnification). (E) Bar plots of percentage of B- (B220+) and T- (CD3+) lymphocytes among CD45+ cells in blood (left), bone marrow (middle), and spleen (right) in control vs mutant mice by flow cytometry. (F) As in panel E but for myelomonocytic (CD11b+) and dendritic (CD11c+ MHCII+) cells in blood. (G) Box-and-whisker plots of hemoglobin in mice. Mean ± SD. n = 3 mice; ∗P<.01; 1-way ANOVA. ANOVA, analysis of variance; H&E, hematoxylin and eosin; SD, standard deviation.
Recurrent activating PIK3CA mutations drives histiocytic neoplasms in vivo. (A) Diagram of PIK3CA alterations across cancer showing hotspots in the helical and kinase domains, the locations of activating mutations. (B) Protein diagram summarizing recurrent PIK3CA mutations across histiocytic neoplasm subtypes. (C) Kaplan-Meier curve of primary CD11c-cre Pik3caH1047R and littermate Pik3ca control mice; n = 15-20 mice; ∗∗∗∗P < .0001. Log-rank (Mantel-Cox) test. (D) Representative histological images of bone marrow showing trilineage hematopoiesis in control mice with no evidence of histiocytosis compared with the bone marrow of CD11c-cre Pik3caH1047R that shows involvement of the bone marrow by increased CD68+, large, foamy histiocytes, and multinucleated giant cells reminiscent of a human histiocytic neoplasm (H&E stain and murine CD68 immunohistochemistry; 600× magnification). (E) Bar plots of percentage of B- (B220+) and T- (CD3+) lymphocytes among CD45+ cells in blood (left), bone marrow (middle), and spleen (right) in control vs mutant mice by flow cytometry. (F) As in panel E but for myelomonocytic (CD11b+) and dendritic (CD11c+ MHCII+) cells in blood. (G) Box-and-whisker plots of hemoglobin in mice. Mean ± SD. n = 3 mice; ∗P<.01; 1-way ANOVA. ANOVA, analysis of variance; H&E, hematoxylin and eosin; SD, standard deviation.
Methods
CD11c-cre-Rosa26-Pik3caH1047R knockin mouse model generation and monitoring
All mice were housed at Memorial Sloan Kettering Cancer Center (MSKCC). CD11c-cre-Rosa26-Lox-STOP-Lox Pik3caH1047R/+ knockin mice (abbreviated as CD11c-cre-R26-Pik3caH1047R/+) and littermate controls (CD11c-cre Pik3ca+/+, Cre-negative Rosa26-Pik3caH1047R/+, and Cre-negative Pik3ca+/+) were generated after genetic crossing between CD11c-cre mice (B6.Cg-Tg(Itgax-cre)1-1Reiz/J; The Jackson Laboratory-JAX stock #008068)18 and the previously described Rosa26-Lox-STOP-Lox Pik3caH1047R/+ conditional transgenic knockin mice (FVB.129S6 Gt(ROSA)26Sortm1(Pik3ca∗H1047R)Egan/J; The Jackson Laboratory- JAX stock #016977).19 The mice were monitored closely by weekly inspection and monthly complete blood counts and peripheral blood flow cytometry for signs of disease, morbidity, or failure to thrive. Once the CD11c-cre-R26-Pik3caH1047R/+ mice became moribund, they were necropsied along with littermate controls for a comprehensive hematopathological evaluation based on our Institutional Animal Care and Use Committee-approved animal MSKCC protocol (13-04-003).
Flow cytometric evaluation of mouse peripheral blood and hematopoietic tissues
Peripheral blood, bone marrow, and spleen samples collected from transgenic mice and littermate controls were first lysed with ACK lysis buffer to remove red blood cells and washed with ice-cold phosphate-buffered saline. Cells were stained with monoclonal antibodies against cell surface markers in phosphate-buffered saline/2% bovine serum albumin for 30 minutes on ice. The following antibodies were used for flow cytometry: anti–B220-PE-Cy7 (clone RA3-6B2, BioLegend, 103221, 1:200 dilution), anti–CD45-PerCP-Cy5.5 (clone 30-F11, eBioscience, 35-0451-82, 1:200), anti-CD45-FITC (clone QA17A26, BioLegend, 157607, 1:200), anti–CD4-APC-Cy7 (clone RM4-5, BioLegend, 100526, 1:200), anti–CD8a-FITC (clone 5H10-1, BioLegend, 100804, 1:200), anti–Gr-1-APC (RB6-8C5, eBioscience, 17-5931-82, 1:200), anti–CD11c-PE (clone N418, eBioscience, 12-0114-82, 1:200), anti–CD11b-PE (M1/70, eBioscience, 14-0112-82, 1:200), and anti-1A/1E (MHCII)-APC (clone M5/114.15.2, BioLegend, 107614, 1:200) following the manufacturer's protocol. DAPI (BioLegend, 422801, 1:1000) was used to exclude dead cells (supplemental Figure 1). Fluorescence-activated cell sorter analysis was performed on an LSRII Fortessa (BD Biosciences), and data analysis was performed using the FlowJo 10 software.
Histological and immunohistochemical evaluation of mouse tissue
Mouse tissue was collected and fixed in 4% paraformaldehyde for at least 48 hours. Samples were then processed, embedded in paraffin, sectioned at 4 μm thickness, and stained with hematoxylin and eosin by the Laboratory of Comparative Pathology at MSKCC. Immunohistochemical staining was performed on a Ventana Stains System with the rabbit anti-CD68 (5 μg/ml; Boster Biological Technology, cat. no: PA1518). The percentage of tumor cells exhibiting staining was scored by an American Board of Pathology–certified hematopathologist with extensive expertise in both human and mouse hematopathological evaluations. Microscopic slides were evaluated using an OLYMPUS BX41 microscope (Olympus Scientific Solutions, Waltham, MA), and images were acquired using an OLYMPUS DP72 camera (Olympus Scientific Solutions).
Patient selection and histopathologic evaluation
This study was conducted in accordance with the Declaration of Helsinki, and human tissues were obtained and analyzed in clinical consultation with procedures approved by the Institutional Review Board of MSKCC. Biopsy material was received as a clinical consultation case at MSKCC. Available hematoxylin and eosin and immunohistochemical slides were examined, and additional immunohistochemical studies were performed, if unstained material was available. Immunohistochemical analysis was performed on paraffin sections for CD1a (Cell Marque, cat no: #760–4525, clone EP3622) and phospho-ERK1/2 (clone: Rabbit MAb; Cell Signaling Technologies, Danvers, MA; 1:1000). Immunohistochemical staining was performed with BondIII (Leica-Microsystems, Buffalo Groove, IL). The percentage of tumor cells exhibiting staining was scored by at least 3 American Board of Pathology–certified hematopathologists with extensive expertise in hematopathological evaluations of human histiocytic neoplasms. Microscopic slides were evaluated using an OLYMPUS BX41 microscope, and images were acquired using an OLYMPUS DP72 camera.
Plasma samples and isolation of PBMCs
Peripheral blood was collected in EDTA tubes. The plasma was separated by centrifugation for 15 minutes at 1900 g, 4°C, and kept at –80°C until analysis. Peripheral blood mononuclear cells (PBMCs) were isolated with lymphoprep density gradient medium (Stemcell Technologies, Vancouver, BC, Canada) and SepMate-15 tubes (Stemcell Technologies) according to the manufacturer’s protocol.
RNA and miRNA extraction and qRT-PCR
RNA was purified from PBMCs and plasma samples using the RNAeasy purification kit and miRNeasy Serum/Plasma kit (Qiagen, Hilden, Germany), respectively, according to the manufacturer’s protocol. RNA concentrations were measured by the Qubit spectrophotometer (ThermoFisher Scientific Inc, Waltham, MA). MiRNA was reverse-transcribed with miRNA-specific stem-looped RT primers (Life Technologies, ThermoFisher Scientific Inc) and detected by quantitative reverse transcription polymerase chain reaction (qRT-PCR) as previously described.20
MiRNAs extracted from plasma samples were normalized to the expression values of an external synthetic cel-miR-39 (Applied Biosystems, Thermo Fisher Scientific Inc), which was used as an internal control. MiRNAs extracted from PBMCs were normalized to U6 (Applied Biosystems, ThermoFisher Scientific Inc), which was used as an internal control. The fold change was calculated using the ΔΔCt method (Relative Quantification Analysis Module, v4.1, Applied Biosystems Analysis, Thermo Fisher Scientific Inc).
For the PTEN expression assay, RNA was reverse transcribed using the high-capacity complementary DNA (cDNA) RT kit (Life Technologies, Thermo Fisher Scientific Inc). cDNA was equally preamplified using the TaqMan PreAmp Master Mix (Applied Biosystems, Foster City, CA) according to the manufacturer’s protocol. Briefly, 12.5 μL cDNA were added to 50 μL PreAmp Master Mix together with 12.5 μL of the gene of interest and preamplified for 14 cycles. The samples were diluted 1:10, and TaqMan qRT-PCR was performed in duplicates using the Step One Plus Real-Time PCR System (Life Technologies, Thermo Fisher Scientific Inc). Each reaction contained 30 ng cDNA, 5 μl TaqMan master mix (Life Technologies, Thermo Fisher Scientific Inc), and 1 μl fluorescein amidites–labeled TaqMan probe of the target gene or hypoxanthine phosphoribosyltransferase 1 control primers (Life Technologies, Thermo Fisher Scientific Inc). Reaction conditions for the gene expression assays were similar to the miRNA qRT-PCR described before.20
Statistical analysis and reproducibility
Data are shown as mean, with individual values per mouse represented as circles, unless stated otherwise. Statistical significance was analyzed with Graph Pad Prism 9 by using Mann-Whitney tests, unpaired 2-tailed t tests, 1-way analysis of variance, and Log-rank (Mantel-Cox) test as indicated in the figure legends. The n value represents biological replicates. Significance was considered at P < .05. Kaplan-Meier survival analysis was used to estimate overall survival. Experiments were repeated to ensure reproducibility of the observations. Equal variance was assumed for cell counting experiments. No statistical methods were used to predetermine sample size.
Results
PIK3CAH1047R drives histiocytosis in a novel murine model
We first crossed Pik3caH1047R/+ mice with CD11c-cre driver mice restricting PIK3CA-mutant expression to monocyte and dendritic cell precursors (supplemental Figure 2A). Interestingly, CD11c-cre Pik3caH1047R knockin mice developed a lethal myelomonocytic disorder starting at age 120 days (4 months) with a median overall survival of 160 days (5.5 months). Meanwhile, their littermate controls did not develop disease (Figure 1C; supplemental Figure 2B). CD11c-cre Pik3caH1047R mice developed a myelomonocytic neoplasm and anemia with suppression of B-lymphopoiesis and expansion of the myelomonocytic compartment with increased frequency of monocytes in the peripheral blood, bone marrow, and spleen. Histologically, large, foamy, murine CD68+ neoplastic histiocytes were noted infiltrating the bone marrow, whereas littermate controls maintained normal trilineage hematopoiesis with no skewing of lymphopoiesis or myelopoiesis (Figure 1D-G; supplemental Figure 2). The hematopathological features and affected hematopoietic organs documented in the CD11c-cre Pik3caH1047R mice can be sites of LCH and ECD disease involvement in humans.
Case of PIK3CA-mutant LCH and response to alpelisib
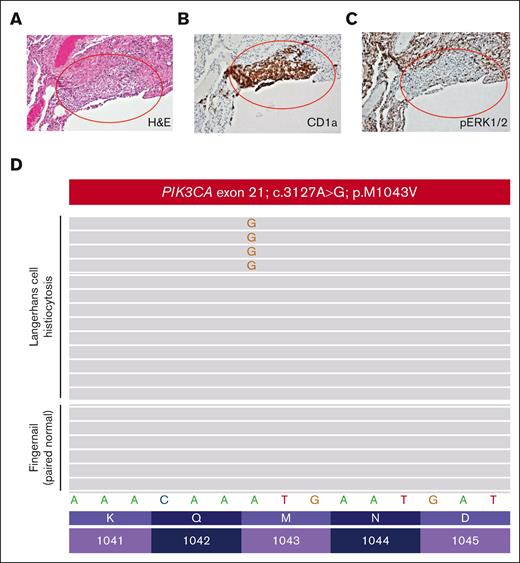
A women aged 46 years presented to her primary care clinic with progressive headaches, polydipsia, and polyuria. After water deprivation test and identification of pituitary stalk thickening on magnetic resonance imaging, a diagnosis of central diabetes insipidus was established, and desmopressin treatment was initiated. However, 10 months after her diabetes insipidus diagnosis, the patient experienced subfebrile episodes and worsening dry cough. Imaging studies, including positron emission tomography/computed tomography (PET/CT), demonstrated extensive bilateral pulmonary reticulo-nodular infiltration, nodules with cystic transformation, and ground glass opacity, raising suspicion of pulmonary LCH. Histological examination of a lung wedge biopsy specimen confirmed the diagnosis of LCH. However, the biopsy showed neoplastic Langerhans cells which stained negative for phospho-ERK1/2 (Figure 2A-C), suggesting minimal activation of MAPK signaling. Molecular profiling by targeted next-generation sequencing identified a known oncogenic gain-of-function PIK3CAM1043V mutation (mean allele frequency, 2.4%) (Figure 2D). This mutation was present within the kinase domain of the PIK3CA gene and was within exon 21, which is 4 codons from the PIK3CAH1047R hotspot mutation investigated in our CD11c-cre-R26-Pik3caH1047R knockin model. These 2 mutations were previously shown to enhance the binding of PIK3CA to the membrane-bound phosphoinositol-4,5-bisphosphate substrate of PIK3CA.21 During her baseline staging evaluation, her condition worsened with new disease foci emerging, including cervical lymphadenopathy and a lytic vertebral lesion involving T11. The patient then received palliative radiotherapy (6 Gy ×2) directed at the T11 lytic lesion followed by escalating systemic therapy with single-agent alpelisib (through the Managed Access Program at Novartis), an isoform specific PIK3CA inhibitor. Dosage was slowly escalated from 150 mg per week and reached 1050 mg per week but was decreased to a stable dose of 750 mg per week owing to the emergence of fatigue.
Pathological evaluation of a patient with PIK3CAM1043V-mutated Langerhans cell histiocytosis. (A) Lung wedge biopsy showing infiltration of lung parenchyma by Langerhans cell histiocytosis (red oval) (H&E; 100× magnification). (B) CD1a immunohistochemistry confirming infiltration of lung parenchyma by Langerhans cell histiocytosis (red oval) (CD1a immunohistochemistry; 100× magnification). (C) Phospho-ERK1/2 (pERK1/2) immunohistochemistry demonstrating a lack of expression of pERK1/2 by the Langerhans cell histiocytosis of the patient (pERK1/2 immunohistochemistry; 100× magnification). (D) PIK3CA c.3127A>G; p.M1043V missense mutation detected by targeted next-generation sequencing of the Langerhans cell histiocytosis involving the lung biopsy of the patient that was absent in paired normal fingernail DNA.
Pathological evaluation of a patient with PIK3CAM1043V-mutated Langerhans cell histiocytosis. (A) Lung wedge biopsy showing infiltration of lung parenchyma by Langerhans cell histiocytosis (red oval) (H&E; 100× magnification). (B) CD1a immunohistochemistry confirming infiltration of lung parenchyma by Langerhans cell histiocytosis (red oval) (CD1a immunohistochemistry; 100× magnification). (C) Phospho-ERK1/2 (pERK1/2) immunohistochemistry demonstrating a lack of expression of pERK1/2 by the Langerhans cell histiocytosis of the patient (pERK1/2 immunohistochemistry; 100× magnification). (D) PIK3CA c.3127A>G; p.M1043V missense mutation detected by targeted next-generation sequencing of the Langerhans cell histiocytosis involving the lung biopsy of the patient that was absent in paired normal fingernail DNA.
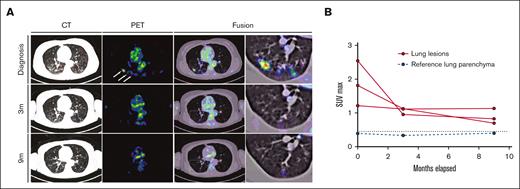
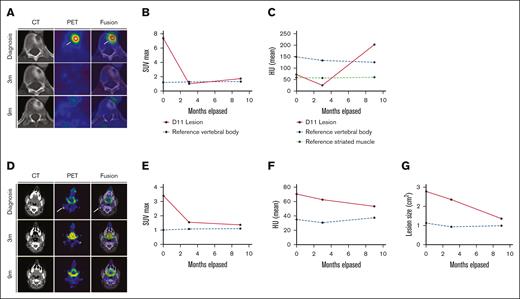
Response to alpelisib was assessed clinically and using PET/CT. Within 6 days of treatment, the patient reported a marked decrease in the frequency and magnitude of night sweats. Within 21 days, a decrease in back pain and increase in vitality were reported. In addition, a complete metabolic response was documented 3 months after the initiation of therapy, with the normalization of all abnormally avid fluorodeoxyglucose loci. This response persisted at the time of follow-up (9 months) (Figures 3 and 4). Moreover, after 9 months, the vertebral lesion exhibited remineralization of the bone matrix, and the lymphadenopathic focus had decreased in its dimensions and density to that of a normal lymph node (Figure 4).
Response dynamics of pulmonary LCH involvement sites upon PI3Kα inhibition. (A) PET, CT, and fusion axial data layers at the level of the lungs were derived from PET/CT studies performed before and during systemic treatment with alpelisib. (B) Quantification of lesion SUVmax values as apparent in panel A. Abnormal FDG uptake in multiple lung nodules on the diagnostic PET image (white arrows). CT, computed tomography; FDG, fluorodeoxyglucose; PET, positron emitted tomography; SUVmax, maximum standard unit value.
Response dynamics of pulmonary LCH involvement sites upon PI3Kα inhibition. (A) PET, CT, and fusion axial data layers at the level of the lungs were derived from PET/CT studies performed before and during systemic treatment with alpelisib. (B) Quantification of lesion SUVmax values as apparent in panel A. Abnormal FDG uptake in multiple lung nodules on the diagnostic PET image (white arrows). CT, computed tomography; FDG, fluorodeoxyglucose; PET, positron emitted tomography; SUVmax, maximum standard unit value.
Response dynamics of skeletal and nodal LCH involvement sites upon PI3Kα inhibition. (A-C) panels depicting imaging data relevant to the lytic lesion in T11. (A) PET, CT, and fusion axial data layers at the level of vertebra T11 derived from PET/CT studies performed before and during systemic treatment with alpelisib. (B-C) Quantification of lesion (B) SUVmax values and (C) HU as apparent in panel A increase in 9 m; HU: P < .001. (D-G) Panels depicting imaging data relevant to the right-sided cervical lymphadenopathy. (D) PET, CT, and fusion axial data layers at the level of vertebra C1 derived from PET/CT studies performed before and during systemic treatment with alpelisib. (E-G) Quantification of lesion (E) SUVmax values, (F) HU and dimensions (G) as apparent in panel D. Abnormal FDG uptake foci in the diagnostic PET and fusion images in A and D are indicated by white arrows. CT, computed tomography; FDG, fluorodeoxyglucose; HU, Hounsfield units; PET, positron emitted tomography; SUVmax, maximum standard unit value.
Response dynamics of skeletal and nodal LCH involvement sites upon PI3Kα inhibition. (A-C) panels depicting imaging data relevant to the lytic lesion in T11. (A) PET, CT, and fusion axial data layers at the level of vertebra T11 derived from PET/CT studies performed before and during systemic treatment with alpelisib. (B-C) Quantification of lesion (B) SUVmax values and (C) HU as apparent in panel A increase in 9 m; HU: P < .001. (D-G) Panels depicting imaging data relevant to the right-sided cervical lymphadenopathy. (D) PET, CT, and fusion axial data layers at the level of vertebra C1 derived from PET/CT studies performed before and during systemic treatment with alpelisib. (E-G) Quantification of lesion (E) SUVmax values, (F) HU and dimensions (G) as apparent in panel D. Abnormal FDG uptake foci in the diagnostic PET and fusion images in A and D are indicated by white arrows. CT, computed tomography; FDG, fluorodeoxyglucose; HU, Hounsfield units; PET, positron emitted tomography; SUVmax, maximum standard unit value.
Given the known potential adverse effects of alpelisib on hyperglycemia, we noted polyuria, polydipsia, and elevation of HbA1C (up to 6.7%) at 750 mg per week after 7 months of treatment. However, these symptoms abated, and HbA1C successfully normalized after a nutritional intervention program.
Treatment with PI3K inhibitor affects PTEN and miRNA expression
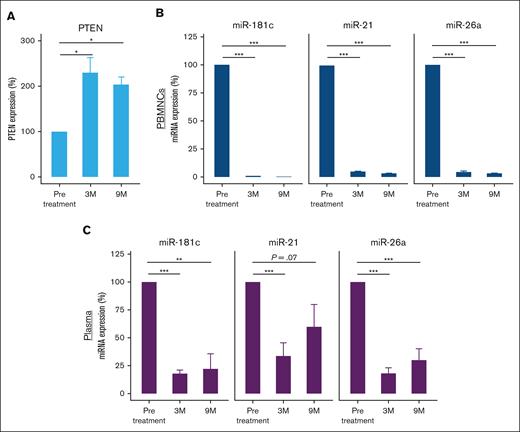
Previous studies have demonstrated a correlation between PTEN expression and the response to alpelisib, specifically highlighting a lack of response to alpelisib when PTEN is downregulated across distinct malignancies.22-24 We, therefore, aimed to determine the effect of treatment with alpelisib on the expression of the tumor suppressor PTEN, the main regulator of the PI3K signaling pathway. A number of miRNAs are known to regulate PTEN expression,25 and prior studies have underscored the utility of miRNA profiles as discerning biomarkers for evaluating treatment efficacy.26-28 To that end, we analyzed PTEN messenger RNA expression levels in PBMCs before treatment and at 3 and 9 months after treatment initiation. The analysis revealed PTEN upregulation after alpelisib treatment (Figure 5A). We further analyzed the expression of miR-21-5p, miR-26a-5p, and miR-181c-5p, which were previously shown to target PTEN25,29-33 because they all contain a binding site for the 3' untranslated region (UTR) of PTEN (supplemental Figure 3). miR-21-5p, miR-26a-5p, and miR-181c-5p levels were significantly higher in the pretreated PBMC and plasma samples than in the samples obtained at 3 and 9 months after treatment initiation (Figure 5B-C).
Expression levels of PTEN and its regulating miRNAs measured by qRT-PCR before and after treatment with alpelisib. (A) PTEN expression levels in PBMCs. PTEN expression was normalized to HPRT1 endogenous controls. (B) miR-21-5p, miR-26a-5p, and miR-181c-5p expression in PBMCs and (C) plasma samples. MiRNA expression was normalized to U6 endogenous control and spike-in control cel-miR-39, respectively. The histograms represent the relative expression from at least 3 experiments. ∗P < .05; ∗∗P < .001; ∗∗∗P < .0001. HPRT1, hypoxanthine phosphoribosyltransferase 1.
Expression levels of PTEN and its regulating miRNAs measured by qRT-PCR before and after treatment with alpelisib. (A) PTEN expression levels in PBMCs. PTEN expression was normalized to HPRT1 endogenous controls. (B) miR-21-5p, miR-26a-5p, and miR-181c-5p expression in PBMCs and (C) plasma samples. MiRNA expression was normalized to U6 endogenous control and spike-in control cel-miR-39, respectively. The histograms represent the relative expression from at least 3 experiments. ∗P < .05; ∗∗P < .001; ∗∗∗P < .0001. HPRT1, hypoxanthine phosphoribosyltransferase 1.
Discussion
Despite the tremendous success in targeting the MAPK pathway in LCH, not all patients harbor mutations that activate ERK kinases, suggesting that the MAPK pathway may not be universally activated in LCH. Anecdotal evidence of successful targeted treatment of various histiocytoses harboring drivers such as RET, ALK, and CSF1R, which are upstream of numerous mitogenic pathways beyond the MAPK pathway, have been previously described.6,34 Here, we provide evidence that activating mutations in PIK3CA can drive histiocytic neoplasms in vivo and that inhibition of PI3K signaling is clinically effective in PIK3CA-mutant histiocytosis.
Our mouse modeling data identify that Pik3ca alterations promote a myelomonocytic neoplasm in vivo when expressed in committed monocyte/dendritic cell progenitors under the CD11c-cre promoter. This resulted in skewing of hematopoiesis toward myelomonocytic expansion and monopoiesis with suppression of B-lymphopoiesis that leads to a hematopoietic neoplasm reminiscent of systemic human histiocytoses. Therefore, activation of the PI3K-AKT-mTOR pathway biologically induces a histiocytosis-like phenotype in vivo. To better assess the effects of Pik3ca alterations in different hematopoietic cell subpopulations, our current mouse model will need to be crossed with other Cre promoter mice that will conditionally express the Pik3caH1047R alteration at different stages of hematopoiesis in future studies (as has been done for BrafV600E).1
At the molecular level, PTEN, the key regulator of the PI3K-AKT-mTOR pathway, was upregulated after PI3Kα inhibition in our patient with PIK3CA-mutated LCH. miRNA molecules that are known to suppress PTEN were highly expressed before alpelisib treatment and were downregulated after treatment, suggesting that treatment with alpelisib directly inhibits the PI3K pathway by blocking the PIK3CA subunit and indirectly affects PTEN regulatory miRNAs. The effect of alpelisib on miRNA expression can be attributed to several mechanisms; the drug might (1) directly affect transcription factors or other regulatory proteins that control miRNA expression; (2) indirectly modulate the activity of kinases involved in cell signaling pathways, some of which might also regulate miRNA expression; (3) affect miRNA biogenesis and processing; or (4) alter the tumor microenvironment, potentially leading to changes in miRNA expression. The exact mechanism by which alpelisib affects miRNA expression will be important to explore further.
Finally, as previously reported in solid tumors, treatment with alpelisib demonstrated a tolerable safety profile at a dose of 750 mg per week and resulted in clinical and metabolic complete remission in our patient with PIK3CA-mutated LCH. We hope that these data will motivate future clinical trial–based studies to evaluate alpelisib response and efficacy in pediatric and adult patients with histiocytoses bearing activation of the PI3K-AKT-mTOR pathway.
Acknowledgments
This study was supported by the Fellow Scholar Award in Basic/Translational Research from the American Society of Hematology, a grant from the Erdheim–Chester Disease Global Alliance Foundation, and K08 CA218901 from the National Institutes of Health/National Cancer Institute (NIH/NCI) during the data collection for this study (B.H.D.). This study is supported in part by the Edward P. Evans Foundation, NIH/NCI (R01 CA251138 and R01 CA242020), NIH/National Heart, Lung, and Blood Institute (R01 HL128239), NIH/NCI P50 CA254838-01, and the Leukemia & Lymphoma Society (O.A.-W.). The authors acknowledge the use of the Integrated Genomics Operation Core, funded by the NCI Cancer Center Support Grant (CCSG, P30 CA08748), Cycle for Survival, and the Marie-Josée and Henry R. Kravis Center for Molecular Oncology.
This work was supported by the NIH/NCI (P30 CA008748), as well as the NCI (R37CA259260; E.L.D.). This was supported by the Frame Family Fund (E.L.D.), the Joy Family West Foundation (E.L.D.), and the Applebaum Foundation (E.L.D.). This work was partially supported by the Histiocytosis Association of America research grant (O.S.).
Authorship
Contribution: B.H.D., O.H.-R., O.A.-W., O.S., R.D.M., and E.L.D. designed the study; B.H.D. and Y.R.C. performed animal experiments; B.H.D., O.H.-R., O.A.-W., M.Y., G.I., M.B.-S., D.G., O.S., and R.D.M. performed clinical studies and assessment; R.D.M. and O.S. provided patient specimens; V.A.A.-G., S.A.D.-T., T.A., D.B.S., and O.H.-R. performed studies and analyses on patient specimens; and B.H.D., O.H.-R., O.A.-W., O.S., R.D.M., and E.L.D. wrote the manuscript with approval from all coauthors.
Conflict-of-interest disclosure: O.A.-W. has served as a consultant for H3 Biomedicine, Foundation Medicine Inc, Merck, Janssen, and Loxo Oncology/Lilly; is on the scientific advisory board of Envisagenics Inc and Harmonic Discovery Inc; and has received prior research funding from H3 Biomedicine, Loxo Oncology/Lilly, and Nurix Therapeutics, unrelated to the current manuscript. D.B.S. has consulted for/received honoraria from Rain, Pfizer, Fog Pharma, Paige. AI, BridgeBio, Scorpion Therapeutics, FORE Therapeutics, Function Oncology, Pyramid, and Elsie Biotechnologies Inc. E.L.D. discloses unpaid editorial support from Pfizer Inc and serves on an advisory board for Day One Therapeutics and Springworks Therapeutics, both outside the submitted work. Alpelisib was kindly provided to the patient via the Managed Access Program at Novartis. The remaining authors declare no competing financial interests.
Correspondence: Eli L. Diamond, Department of Neurology, Memorial Sloan Kettering Cancer Center, 160 E 53rd St, New York, NY; e-mail: diamone1@mskcc.org; and Roei D. Mazor, Clinic of Histiocytic Neoplasms, Institute of Hematology, Assuta Medical Center, 20 Habarzel St, Tel Aviv, Israel, 6971028; e-mail: rd.mazor@gmail.com.
References
Author notes
∗B.H.D. and O.H.-R. contributed equally to the study.
Original data are available upon reasonable request from the corresponding authors Eli L. Diamond (diamone1@mskcc.org) and Roei D. Mazor (rd.mazor@gmail.com).
The full-text version of this article contains a data supplement.


