Key Points
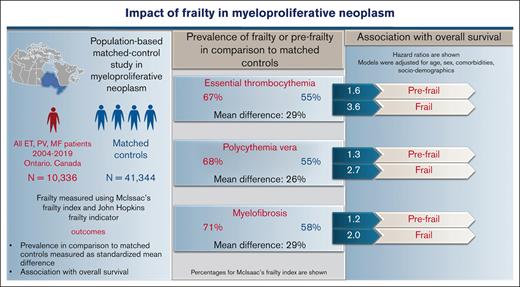
In myeloproliferative neoplasms, frailty is more prevalent compared with matched controls and distinct from aging and comorbidities.
Higher frailty is associated with worse OS independent of advanced age and comorbidity burden.
Abstract
Clinical implications of frailty in myeloproliferative neoplasms (MPN), including essential thrombocythemia (ET), polycythemia vera (PV), and myelofibrosis (MF), are unknown. In this population-based study, all incident cases of MPN from the Ontario cancer registry between 2004 and 2019 (N = 10 336; ET = 5108; PV = 3843; MF = 1385) and their matched controls (for age, sex, residence, and income) in a 1:4 ratio were included. Baseline frailty measured using the Johns Hopkins Adjusted Clinical Groups frailty indicator and McIsaac frailty index (mFI), categorized as fit, prefrail, or frail if mFI <0.10, 0.11 to 0.20, >0.20), was significantly higher in ET, PV, and MF compared with matched controls (standardized mean difference of 0.27, 0.27, and 0.28). Over 23%, 20%, and 34% of patients with ET, PV, and MF were frail or prefrail despite a younger age (<65 years) or minimal comorbidities. In Cox proportional regression, frailty was independently associated with worse overall survival (OS) after adjusting for age, sex, and comorbidities compared with mFI-fit patients. The hazard ratios (95% confidence interval) for OS for mFI-prefrail and mFI-frail patients were: 1.6 (1.3-1.9) and 3.6 (2.9-4.4) in ET, 1.3 (1.1-1.5) and 2.7 (2.1-3.4) in PV, and 1.2 (1.0-1.5) and 2.0 (1.5-2.7) in MF. Patients with MPN have a substantially higher prevalence of frailty compared with matched controls, which is associated with reduced OS, independent of age or comorbidities.
Introduction
In 2018, the American Society of Clinical Oncology guidelines recommended a geriatric assessment for all newly diagnosed patients with cancer >65 years old highlighting the importance of assessing geriatric vulnerabilities in oncologic treatment planning.1 These aging-associated geriatric vulnerabilities can be measured using the concept of frailty.2 Frailty is a clinical syndrome resulting from accelerated aging-associated decline in multiple physiologic systems, impairing the ability to rebound from everyday or acute stressors.2 Although advanced age and comorbidity burden are considered surrogates of frailty, research shows these concepts are overlapping yet distinct.3 When this distinction is known, oncologists’ treatment decisions are influenced in >25% of patients with cancer.4
The 3 classical myeloproliferative neoplasms (MPN), including essential thrombocythemia (ET), polycythemia vera (PV), and primary myelofibrosis (MF), occur predominantly in older individuals.5 With 4 times greater risk of vascular events,6 high incidence of nonMPN solid cancers,7 reduced relative survival,8 and 5 times higher health resource utilization9 compared with age- and gender-matched counterparts, identification of aging-related vulnerabilities is crucial for developing personalized treatment plans. Personalized interventions for prefrail and frail patients would include optimization of comorbidities, nutritional status, physical activity, and possibly earlier institution of disease control measures using cytoreductive treatments to reduce underlying inflammation and prolong disease progression.
The prevalence of frailty in patients with MPN has not been well studied. A systematic review on older patients with cancer by Handforth et al in 201510 noted a 42% (range, 6-86) prevalence of frailty across various cancers but not specifically in MPN. The clonal hematopoiesis perpetuates chronic systemic inflammation in MPN, leading to elevated levels of IL-6 and C-reactive protein.11,12 These inflammatory mediators are strongly linked to frailty development.13 Therefore, we hypothesized that patients with MPN would have a higher prevalence of frailty compared with their normal counterparts without MPN.
Frailty is increasingly used as a marker of risk for poor patient outcomes in oncology research. Prior work in nonMPN cancers shows that frailty predicts chemotherapy toxicities, drug interruptions or treatment changes,14 neuropsychiatric toxicity,15 as well as decreased progression-free survival16 and overall survival (OS).17 Investigators also showed that frailty improves the prediction accuracy of survival models.18 An impressive body of literature reports on the association of disease-related risk factors (molecular mutations, cytogenetics, blood counts), cardiovascular risk factors, advanced age, and comorbidities with adverse outcomes in MPN. But there are no studies to date that have established the impact of frailty on these outcomes. Chronological age is a simple and objective measure but does not account for heterogeneity in the rate of aging, which is more clearly represented by frailty status. For instance, at any given age, those with higher levels of frailty are at an increased risk of death, functional decline, poor quality of life, high health resource utilization, and cardiovascular events independent of comorbidity burden.19 Understanding the implications of frailty in MPN could provide a vital opportunity to improve outcomes by identifying modifiable vulnerabilities and instituting preventable measures, as well as modifying treatment intensity.1
Methods
Study design and participants
We conducted a population-based retrospective observational study of all adults (age >18 years) diagnosed with one of the 3 classical MPNs in Ontario, Canada between 1 January 2004 and 31 December 2019 (Figure 1). We assessed the prevalence of frailty using McIsaac’s cumulative deficit frailty index20 (mFI) and the Johns Hopkins Adjusted Clinical Groups frailty indicator21 (ACG-F) and compared it with controls from the general population of Ontario without a diagnosis of MPN. In patients with MPN, we calculated the hazard ratios (HR) for the association of frailty with OS in the presence of comorbidities and advanced age using survival analysis. We also calculated the changes in the predictive performance of survival models after the addition of frailty.
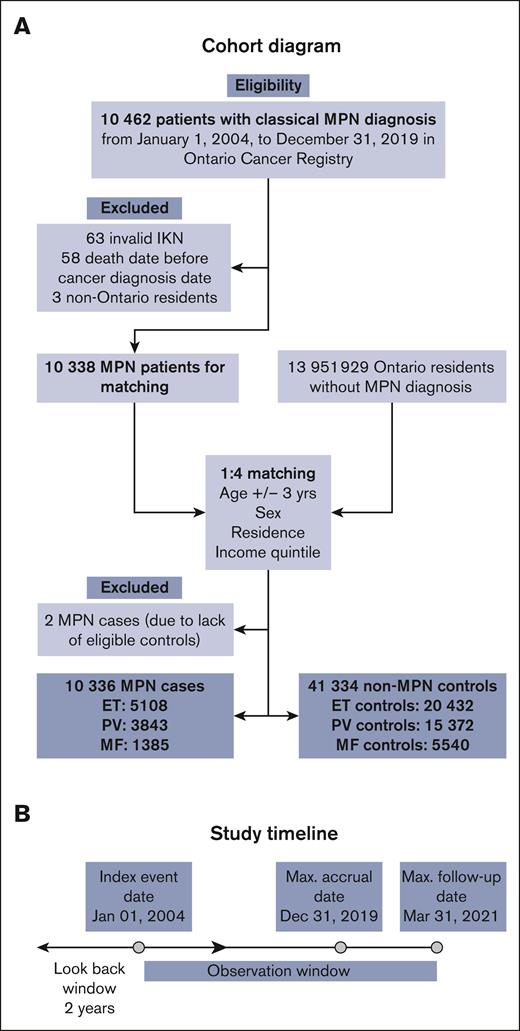
Cohort diagram. (A) Shows cohort creation of cases based on inclusion and exclusion criteria and their controls matched on age +/-3 years, sex, and residence and neighborhood income quintile. (B) Baseline characteristics including frailty were obtained within a 2-year look-back period. IKN, ICES Key Number.
Cohort diagram. (A) Shows cohort creation of cases based on inclusion and exclusion criteria and their controls matched on age +/-3 years, sex, and residence and neighborhood income quintile. (B) Baseline characteristics including frailty were obtained within a 2-year look-back period. IKN, ICES Key Number.
Identification of patients with MPN
We included MPN cases from the Ontario Cancer Registry (OCR) based on ICD-O-3 topography code C42 and morphology codes: 99503, 99623, 99613, 99603, and 99751. OCR passively collects data from hospital discharges from the Canadian Institute for Health Information (CIHI), pathology reports from public hospitals and community laboratories, consultation records of patients referred to one of 14 regional cancer centers and death certificates from the Ontario Registrar General.22
NonMPN controls
Each patient with MPN was randomly matched to 4 nonMPN persons from the general population of Ontario by age ± 3 years, sex, residence area, and income quintile. Residence area was determined using Statistics Canada’s Postal CodeOM Conversion File, which provides a link between the 6-character postal codes and census geographic areas such as dissemination areas, census tracts, and others. The index date for cases was the date of diagnosis of MPN, whereas controls inherited the index date from their matched cases and were alive on the index date.
Frailty assessment
We defined frailty at or within 2 years before the index date using 2 methods: (1) mFI20 (Appendix 1, online only), a continuous measure that was categorized into a 3-level categorical variable based on previous work by Rockwood et al23 as fit (mFI <0.10), prefrail (mFI 0.10-0.20), and frail (mFI >0.20), and (2) the Johns Hopkins ACG-F–defining diagnoses21 (Version 10.0) categorizing patients as fit or frail (Appendix 2, online only).
Data sources and covariates
The administrative data sets used in this study were linked using unique encoded identifiers and analyzed at Institute for Clinical Evaluative Sciences (ICES), Toronto and are listed in Appendix 3, online only. We collected information on several clinical and health service–related factors: age, sex, residence, neighborhood income quintile, comorbidities (diabetes mellitus, hypertension, chronic obstructive pulmonary disease, dementia, heart failure, liver disease, myocardial infarction, dialysis-dependent kidney disease, rheumatic disease, hemiparesis, peripheral vascular disease, and home-oxygen dependency), thrombosis before the index event, and Ontario marginalization index (ON-MARG).24 The ON-MARG index comprises 4 variables (residential instability, material deprivation, dependency, and ethnic concentration) that indicate marginalization of the population. The baseline information on blood counts was available only for ∼70% of patients, and genetic data are not available at ICES; hence, they were not included in the analysis.
Outcome assessment
We assessed the differences in prevalence of frailty between MPN and nonMPN controls. For OS in patients with MPN, we calculated time to event from the index date to the end of the follow-up period, defined as the earliest of the death date, lost to follow-up, or the study end date of 31 March 2021. Patients were censored at the last date of follow-up if they are alive or lost to follow-up. We confirmed in-hospital mortality using the Discharge Abstract Database and post-discharge mortality using the Registered Persons Database.
Statistical analysis
We compared the prevalence of frailty between MPN and nonMPN controls using standardized mean difference (SMD) owing to the large sample size of the database. SMD >10% was considered statistically significant.25 We compared the frailty between 3 classical MPN subtypes using Tukey honest significant difference (HSD) test, a post hoc test that assesses the significance of differences between pairs of group means.26 We calculated the survival probability for each subtype of MPN using the Kaplan-Meier method for the main predictor variable frailty and other covariates using the log-rank test. We selected variables for multivariable analysis if P < .10 on univariable analysis or if they were considered clinically meaningful. We calculated HR using Cox proportional hazard (CPH) regression models that were adjusted for age and comorbidities to measure the association of frailty with OS. In multivariable CPH regression, we evaluated 3 different models to delineate the effects of aging and comorbidities from frailty. In model 1, we included mFI as a continuous variable in increments of 0.03, a value that corresponds to a 1 unit increase in frailty deficit in mFI. In model 2, we included mFI as a categorical variable, and in model 3, we included ACG-F as a measure of frailty. We also checked for interactions between the time period of diagnosis and frailty. To further explore the independent implications of frailty on age and comorbidities, we performed a sensitivity analysis after stratifying our case cohort into younger (<65 years) and older (>65 years) and those with 0 to 1 comorbidity vs 2 or more comorbidities. We visually evaluated proportional hazards assumptions with log-log curves for categorical predictors and Schoenfeld residuals for continuous variables. The main outcome and exposure variables were complete for all participants. Sociodemographic variables were imputed to the group median for only 1% of patients. We compared relative changes in the predictive performance of model 2 (using mFI as a categorical variable) using Royston D-index (concordance index) and Nagelkerke R2 as described by Austin et al.27 All analyses were performed using the R language environment (version 3.1.2). Based on sample size, the power to demonstrate a hazard ratio of 1.5 (mortality of ∼60% with a type 1 error probability [a] of 5%) using mFI was over 99% (Hseih and Lavori method).28
Ethical considerations
The use of data in this project was authorized under section 45 of Ontario’s Personal Health Information Protection Act, which does not require review by a research ethics board. To ensure the privacy and confidentiality of patient information, all data within the ICES data sets was deidentified after linkage using a patient-specific encrypted identifier. Data were accessed only through ICES Central Ontario or through its research analytical environment. Only study personnel had access to the study’s data. Per ICES procedures, cells with <6 observations were suppressed to limit potential breaches of confidentiality.
Results
Study cohort and baseline characteristics
Out of a total of 10 462 eligible patients with MPN, 10 336 were included in the cohort (Figure 1). Of them, 5108 (49%) had ET, 3843 (37%) had PV, and 1385 (13%) had MF. A total of 124 patients were excluded (invalid IKN [n = 63], died before the index date [n = 58], or were nonresidents of Ontario [n = 3]). Out of 13 951 929 residents in Ontario without a diagnosis of MPN, 41 344 were included as matched controls in a ratio of 1:4 (Table 1). Because of matching, age, sex, residence, and income quintile were comparably distributed between cases and controls. There was no difference in marginalization index variables between cases and controls. Notable findings were the significantly higher incidence of thrombotic events (12%) in the 2-year look-back period as compared with controls (4.8%; SMD = 0.26; P < .001).
Baseline characteristics of MPN cases and matched controls
| Variable . | Cases, N = 10 336 (%) . | Controls, N = 41 344 (%) . | Standardized difference∗ . | P value† . |
|---|---|---|---|---|
| Age (y) | <0.001 | >.9 | ||
| Mean (SD) | 66.0 (16.0) | 66.07 (16.0) | ||
| Median (IQR) | 68.0 (56.0-78.0) | 68.0 (56.0-78.0) | ||
| Age (y) (categorical) | 0.002 | >.9 | ||
| Less than 40 y | 735 (7.1) | 2950 (7.1) | ||
| 40-64 y | 3553 (34) | 14 234 (34) | ||
| 65-74 y | 2478 (24) | 9907 (24) | ||
| 75 y or older | 3570 (35) | 14 253 (34) | ||
| Sex | 0 | >.9 | ||
| Female | 5479 (53) | 21 916 (53) | ||
| Type of MPN | NA | |||
| ET | 5108 (49) | NA | ||
| PV | 3843 (37) | NA | ||
| MF | 1385 (13) | NA | ||
| Prior thrombosis | 1230 (12) | 1897 (4.6) | 0.268 | <.001 |
| Y of diagnosis | NA | |||
| 2004-2009 | 868 (8) | NA | ||
| 2010-2015 | 5065 (49) | NA | ||
| 2016-2019 | 4403 (42) | NA | ||
| Residence | 0.007 | .5 | ||
| Rural | 1262 (12) | 5142 (12) | ||
| Urban | 9074 (88) | 36 202 (88) | ||
| Income quintile | 0 | >.9 | ||
| Q1 | 2209 (21) | 8836 (21) | ||
| Q2 | 2058 (20) | 8232 (20) | ||
| Q3 | 2013 (20) | 8052 (20) | ||
| Q4 | 1952 (19) | 7808 (19) | ||
| Q5 | 2061 (20) | 8244 (20) | ||
| (Missing) | 43 | 172 | ||
| Instability | 0.027 | .2 | ||
| Q1 (lowest) | 1671 (16) | 6902 (17) | ||
| Q2 | 1804 (18) | 7334 (18) | ||
| Q3 | 1908 (19) | 7678 (19) | ||
| Q4 | 1997 (20) | 8104 (20) | ||
| Q5 (highest) | 2857 (28) | 10 956 (27) | ||
| (Missing) | 99 | 370 | ||
| Dependency | 0.026 | .2 | ||
| Q1 (lowest) | 1835 (18) | 7418 (18) | ||
| Q2 | 1783 (17) | 7375 (18) | ||
| Q3 | 1855 (18) | 7180 (18) | ||
| Q4 | 1992 (19) | 7727 (19) | ||
| Q5 (highest) | 2772 (27) | 11 274 (28) | ||
| (Missing) | 99 | 370 | ||
| Deprivation | 0.017 | .6 | ||
| Q1 (lowest) | 2056 (20) | 8080 (20) | ||
| Q2 | 2025 (20) | 8211 (20) | ||
| Q3 | 1990 (19) | 7992 (20) | ||
| Q4 | 2026 (20) | 8303 (20) | ||
| Q5 (highest) | 2439 (24) | 9930 (24) | ||
| Ethnic concentration | ||||
| Q1 (lowest) | 2000 (19.3) | 7983 (19.3) | 0.019 | .5 |
| Q2 | 1812 (17.5) | 7479 (18.1) | ||
| Q3 | 1924 (18.6) | 7562 (18.3) | ||
| Q4 | 2062 (19.9) | 8020 (19.4) | ||
| Q5 (highest) | 2439 (23.6) | 9930 (24.0) | ||
| (Missing) | 99 | 370 |
NA, not applicable; Q1-Q5, quintiles.
P values <0.05 are indicated in bold.
Standardized mean difference.
Wilcoxon rank sum test; Pearson’s χ2 test.
Comparison of frailty in patients with MPN with nonMPN controls
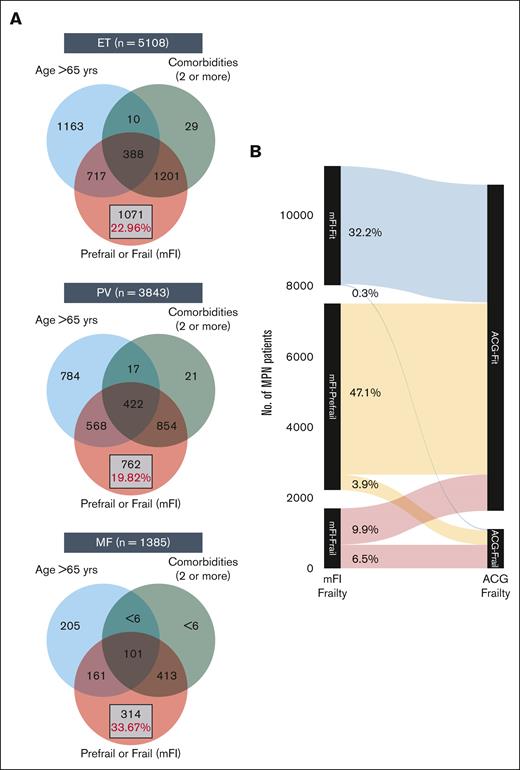
At diagnosis, MPN cases had a higher prevalence of frailty compared with nonMPN–matched controls by both frailty measures: mFI and ACG-F. Using mFI, over 16% of MPN cases were categorized as frail (vs 11% controls) and 51% as prefrail (vs 44% controls) (SMD 0.27; P < .001) (Appendix 4 online only). The higher prevalence of frailty compared with matched controls was consistently seen across all 3 MPN subtypes; however, patients with MF had significantly higher mFI compared with ET and PV (1-way ANOVA P < .001; Tukey HSD post hoc test: P < .001 for both ET vs MF and PV vs MF; P = .25; for ET vs PV). A higher prevalence of frailty in MPN cases was also noted with ACG-F: 11% in all MPN cases (vs 8.2% in controls, SMD 0.08), 9.4% in ET, 12% in PV, and 9.2% in MF. What is important to note is that mFI-frail and mFI-prefrail patients (classified using mFI) are clearly distinct from those with advanced age (>65 years) or those with higher comorbidities (>2) and constitute over 20% of all patients with MPN (Figure 2A-C). The extent of agreement between mFI and ACG for diagnosing frailty was moderate (Cohen kappa statistic of 0.44 [95% confidence interval, 0.43-0.45]) (Figure 2D; Appendix 5 online only).
Distinction between advanced age vs comorbidity burden and frailty. The Venn diagram (A) shows the distinction between advanced age (>65 years), higher comorbidities (2 or more), and presence of prefrail or frail status in ET (A), PV (B), and MF (C). The Sankey diagram (B) shows comparison of frailty assessment using mFI and ACG.
Distinction between advanced age vs comorbidity burden and frailty. The Venn diagram (A) shows the distinction between advanced age (>65 years), higher comorbidities (2 or more), and presence of prefrail or frail status in ET (A), PV (B), and MF (C). The Sankey diagram (B) shows comparison of frailty assessment using mFI and ACG.
Association of frailty with OS in MPN
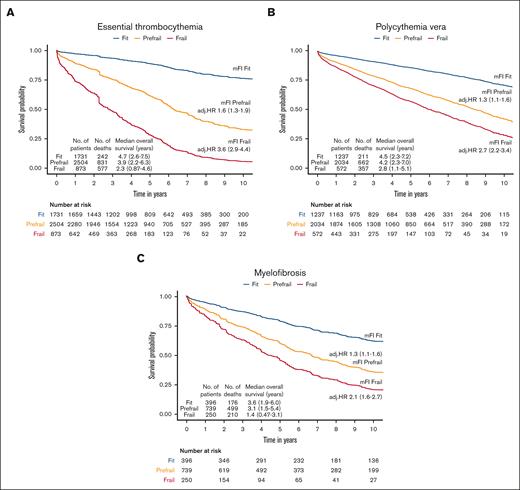
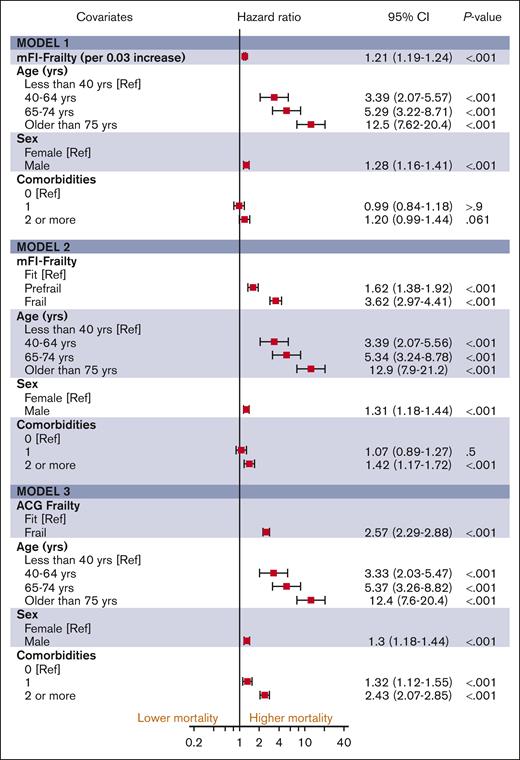
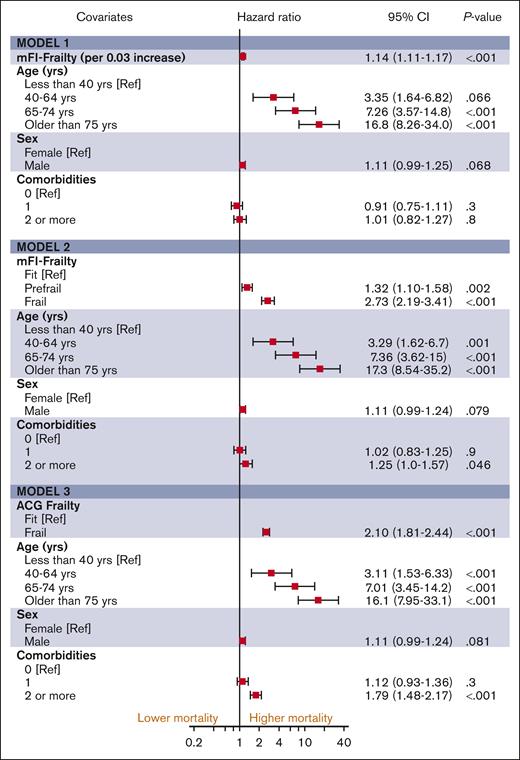
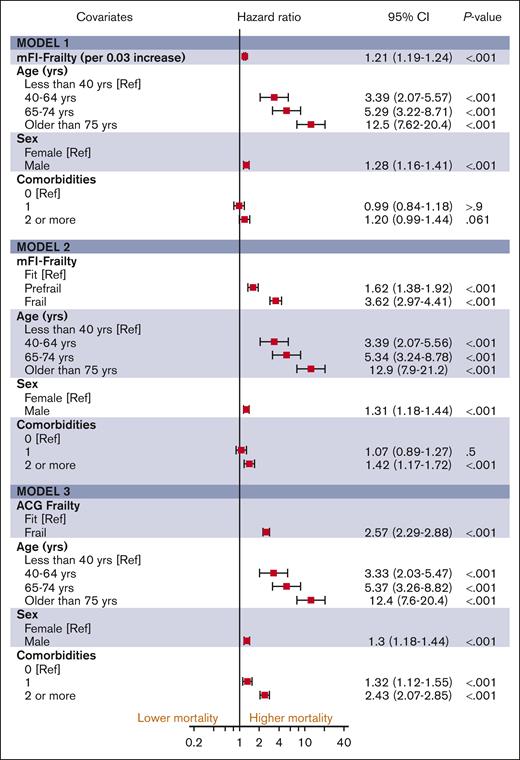
The median follow-up duration in ET, PV, and MF was 3.8 years (interquartile range [IQR], 2.0-6.5), 4.7 years (IQR, 2.0-6.8), and 2.9 years (IQR, 1.3-5.2), respectively. A total of 1650 (32%) ET cases, 1230 (32%) patients with PV and 1385 (44%) patients with MF died during the study follow-up period (Table 2). Univariable analysis for OS (Appendix 6, online only) in all 3 MPN subtypes showed that higher frailty was associated with worse OS, in addition to advanced age, higher comorbidities, male sex, and ON-MARG index variables. In multivariable CPH regression for OS, higher frailty in all MPN subtypes was independently associated with increased risk of mortality after adjusting for age, sex, comorbidities, and marginalization in all 3 models (Figure 3; Appendix Figure 7 online only). The adjusted survival estimates from models 2 and 3 are shown in Figure 4-6. Regarding model diagnostics (Appendices 8 and 9, online only), the proportionality assumptions were violated for age as a continuous variable, which was then included as a categorical variable. The deviance residuals were symmetrically distributed around 0.
Survival probabilities in ET, PV, and MF according to frailty status
| Essential thrombocythemia . | Fit, N = 1731 . | Prefrail, N = 2504 . | Frail, N = 873 . | P value . |
|---|---|---|---|---|
| Follow-up in y | <.001 | |||
| Mean (SD) | 5.39 (3.52) | 4.63 (3.30) | 3.02 (2.69) | |
| Median (IQR) | 4.74 (2.60-7.47) | 3.88 (2.16-6.34) | 2.29 (0.87-4.62) | |
| Range | 0.00-16.90 | 0.01-17.08 | 0.00-14.62 | |
| Vital status, n (%) | <.001 | |||
| Alive/censored | 1489 (86) | 1673 (67) | 296 (34) | |
| Died | 242 (14) | 831 (33) | 577 (66) | |
| Kaplan-Meir survival probabilities, % (95% CI) | <.001 | |||
| 12 mo | 98 (97-98) | 92 (91-93) | 74 (71-77) | |
| 24 mo | 96 (95-97) | 87 (86-89) | 60 (57-64) | |
| 36 mo | 94 (93-95) | 82 (81-84) | 52 (49-56) | |
| 48 mo | 92 (90-93) | 76 (75-78) | 44 (41-48) | |
| 60 mo | 89 (88-91) | 71 (69-73) | 37 (33-41) |
| Polycythemia vera . | Fit, N = 1237 . | Prefrail, N = 2034 . | Frail, N = 572 . | P value . |
|---|---|---|---|---|
| Follow-up in y | <.001 | |||
| Mean (SD) | 5.10 (3.40) | 4.85 (3.23) | 3.40 (2.90) | |
| Median (IQR) | 4.46 (2.28-7.23) | 4.19 (2.26-7.03) | 2.81 (1.12-5.05) | |
| Range | 0.00-16.98 | 0.01-17.26 | 0.00-15.76 | |
| Vital status, n (%) | <.001 | |||
| Alive/censored | 1026 (83) | 1372 (67) | 215 (38) | |
| Died | 211 (17) | 662 (33) | 357 (62) | |
| Kaplan-Meir survival probabilities, % (95% CI) | <.001 | |||
| 12 mo | 97 (96-98) | 93 (91-94) | 78 (75-81) | |
| 24 mo | 94 (93-96) | 88 (87-90) | 64 (60-68) | |
| 36 mo | 92 (91-94) | 83 (81-85) | 58 (54-62) | |
| 48 mo | 90 (88-91) | 78 (76-80) | 48 (44-53) | |
| 60 mo | 86 (84-89) | 73 (71-75) | 42 (38-47) |
| Myelofibrosis . | Fit, N = 396 . | Prefrail, N = 739 . | Frail, N= 250 . | P value . |
|---|---|---|---|---|
| Follow-up in y | <.001 | |||
| Mean (SD) | 4.38 (3.30) | 3.74 (2.96) | 2.10 (2.12) | |
| Median (IQR) | 3.60 (1.89-6.01) | 3.10 (1.47-5.39) | 1.44 (0.47-3.13) | |
| Range | 0.02-16.43 | 0.00-16.39 | 0.00-10.76 | |
| Vital status, n (%) | <.001 | |||
| Alive/censored | 220 (56) | 240 (32) | 40 (16) | |
| Died | 176 (44) | 499 (68) | 210 (84) | |
| Kaplan-Meir survival probabilities, % (95% CI) | <.001 | |||
| 12 mo | 89 (86-92) | 84 (81-86) | 62 (56-68) | |
| 24 mo | 82 (78-86) | 72 (68-75) | 41 (36-48) | |
| 36 mo | 74 (69-78) | 60 (57-64) | 31 (25-37) | |
| 48 mo | 68 (63-73) | 51 (47-55) | 22 (17-29) | |
| 60 mo | 59 (54-65) | 41 (37-45) | 16 (12-22) |
CI, confidence interval; SD, standard deviation.
The Kaplan-Meir estimates for OS according to frailty status. The model was adjusted for age, sex, comorbidity burden, and marginalization index.
The Kaplan-Meir estimates for OS according to frailty status. The model was adjusted for age, sex, comorbidity burden, and marginalization index.
The estimates of association of frailty with OS for ET. All models were adjusted for sex, comorbidity burden, and marginalization index (data not shown).
The estimates of association of frailty with OS for ET. All models were adjusted for sex, comorbidity burden, and marginalization index (data not shown).
The estimates of association of frailty with OS for PV. All models were adjusted for sex, comorbidity burden, and marginalization index (data not shown).
The estimates of association of frailty with OS for PV. All models were adjusted for sex, comorbidity burden, and marginalization index (data not shown).
The estimates of association of frailty with OS for MF. All models were adjusted for sex, comorbidity burden, and marginalization index (data not shown).
The estimates of association of frailty with OS for MF. All models were adjusted for sex, comorbidity burden, and marginalization index (data not shown).
In the sensitivity analysis, after stratifying our case cohort into younger (<65 years) and older (>65 years) (Appendix 10, online only) and those with 0 to 1 comorbidities vs >2 comorbidities (Appendix 11, online only), frailty remained an independent predictor of worse OS in both younger and older patients after adjusting for sex. Similarly, frailty remained a significant predictor of worse OS irrespective of comorbidity burden, whether lower or higher. Notably, in patients with higher comorbidities, advanced age did not have a consistent association with mortality, whereas frailty showed a consistent and independent association with higher mortality. We also checked for an interaction between the time of diagnosis and frailty on OS and did not find a significant interaction, suggesting that the implications of frailty were consistent throughout the study period.
Assessment of added predictive value of measuring frailty and model performances
After establishing the independent association of frailty with a higher risk of mortality, we calculated the added predictive value of frailty measurement using mFI in the survival model for OS (Appendix 12, online only). The increase in relative overall performance of the model as calculated using Nagelkerke R2 was 14.11%, 7.38%, and 15.98% for ET, PV, and MF, respectively.
Discussion
Accurate risk stratification is a critical first step in making cancer treatment decisions. Frailty has emerged as an important tool to identify modifiable geriatric vulnerabilities independent of age and comorbidity burden. In this large population-based study on patients with MPN, we show a significantly higher prevalence of frailty (11% with ACG-F; 16% with mFI) and prefrailty (51% with mFI) compared with matched nonMPN controls and that over 20% of patients are prefrail or frail despite being young and without comorbidities. We note that a higher frailty score was independently associated with worse OS in MPN after adjusting for age, comorbidities, and sociodemographic factors.
To our knowledge, this study is the first to report on the prevalence of frailty with a focus on patients with MPN; thus, our results are not directly comparable. However, they align with the estimates in other malignancies in a systematic review (median, 42%; range, 6-86).10 The authors also highlight the differences in frailty reported with comprehensive geriatric assessment (CGA, 42%) compared with that with Fried’s frailty phenotype (13%), which agrees with the differences noted in our study between mFI and ACG-F. The mFI and ACG-F can be considered conceptually like the CGA and Fried’s frailty phenotypes, respectively, have been validated for use with population-based databases and operationalized at ICES to show consistent associations with adverse outcomes.29 Perhaps a more important finding was that between 20% and 30% of patients were classified as prefrail or frail despite their younger age and lower comorbidity burden. This corroborates previous findings3,30 that there remain several frail, vulnerable individuals who may not be captured by routine clinical measurements of patient fitness, ie, age or comorbidity indices alone.
The most clinically relevant finding was the increasing risk of death with progressively higher frailty. This supports the view that frailty is a continuum, and recognition of the clinically silent prefrail31 state could identify patients at higher risk of adverse outcomes. This agrees with findings from a previously published single-center study on patients with myelofibrosis (n = 438)32 and a related hematological condition myelodysplastic syndrome.33 Although we did not specifically study transitions between various frailty states during follow-up, there is literature to suggest such transition between frailty states (ie, nonfrail, prefrail, and frail) could occur and preventive measures could affect clinical outcomes.34,35 Any new clinical prediction tool could face questions from users on the additional benefit it would provide for decision-making, especially if the measurement is time-consuming. Investigators, therefore, often demonstrate the change in predictive ability of their statistical models with the inclusion of frailty. For example, a recent study on the impact of frailty on coronavirus disease 2019 outcomes evaluated 6 different multivariable models.30 They noted that the inclusion of frailty as a variable improved the predictive accuracy compared with age and comorbidities alone, thus justifying the additional resources needed to measure this predictor variable. We also measured the performance metrics for various prediction models with and without the inclusion of frailty and noted that the inclusion of a frailty index improves the predictive accuracy of the multivariable survival models in patients with MPN. At the same time, we concur that these survival models were limited by the unavailability of molecular markers and disease characteristics, such as blood counts, in the administrative data sets.
Strengths of the study include a large sample from a universal health care system with equal access to care, the availability of matched controls, validated information on survival, and the availability of social factors that could modify frailty outcomes. We also note certain weaknesses. First, there is a selection bias because OCR is a passive registry that may not capture patients unless reported in one of the 4 data sources. Second, a confounding bias as we could not include disease characteristics such as blood counts, splenomegaly, and genetics in survival models because of a lack of availability; and third, an ascertainment bias because of the overlap of some of the variables in mFI with symptoms in MPN, leading to a higher probability of being classified as prefrail or frail. Finally, physical measures of frailty such as grip strength, timed up, and go test are not available because of the nature of administrative databases. We did not extract information on the cause of death because not having access to patient hospital charts would have made it difficult to classify the immediate cause of death as MPN- or nonMPN-related.
The findings of this study have several implications for clinical management and future research in MPN. The implementation of the routine frailty measurements in clinical practice could potentially improve the clinical management of patients with MPN through early identification of biopsychosocial risk factors, optimizing functional status through exercise prescriptions, eliminating polypharmacy, and dietician referral to ensure adequacy of nutrition. Moreover, treatment intensity can be tailored according to frailty. One approach to this is a geriatric assessment.1 As an illustration, consider a patient with the Dynamic International Prognostic Scoring System low-risk MF. At present, such a patient would not receive JAK inhibitor treatment if they did not have constitutional symptoms or splenomegaly. However, if the frailty assessment shows the patient to be prefrail or frail, then consideration could be given for the early institution of JAK inhibitor treatment that helps reduce inflammation, improve symptom burden, and improve nutrition, along with institution of other preventive measures noted earlier to improve outcomes. A scoping review has noted that over 60% of frailty interventional studies in primary care settings have shown reductions in frailty using exercise, nutrition, cognitive training, and rehabilitation.36 Further research should focus on the measurement of frailty as an outcome pre- and postpharmacological treatments to improve the evidence for preventing and managing frailty and the selection, intensity, and timing of treatments in the MPN setting.
Conclusions
Patients with MPN have significantly higher frailty compared with matched controls. Frailty is distinct from advanced age and multimorbidity and is independently associated with increased all-cause mortality. Even a clinically silent state of prefrailty results in a substantially increased risk of mortality. Future areas for research would include studying the dynamics of frailty states and the impact of such transitions, particularly after treatment interventions, on clinical outcomes.
Acknowledgments
This study was supported by Institute for Clinical Evaluative Sciences (ICES). ICES is an independent, nonprofit research institute funded by an annual grant from the Ontario Ministry of Health (MOH) and the Ministry of Long-Term Care. As a prescribed entity under Ontario’s privacy legislation, ICES is authorized to collect and use health care data for the purposes of health system analysis, evaluation, and decision support. Secure access to these data is governed by policies and procedures that are approved by the Information and Privacy Commissioner of Ontario. The opinions, results, and conclusions are those of the authors and are independent from the funding sources. No endorsement by ICES or the MOH is intended or should be inferred. Parts of this material are based on data and information provided by Ontario Health (OH). The opinions, results, views, and conclusions reported in this paper are those of the authors and do not necessarily reflect those of OH. No endorsement by OH is intended or should be inferred. Parts of this material are based on data and information compiled and provided by Canadian Institute for Health Information (CIHI). However, the analyses, conclusions, opinions, and statements expressed herein are those of the author and not necessarily those of CIHI. This document used data adapted from the Statistics Canada Postal Code OM Conversion File, which is based on data licensed from Canada Post Corporation, and/or data adapted from the Ontario Ministry of Health Postal Code Conversion File, which contains data copied under license from Canada Post Corporation and Statistics Canada.
Funding for the research study was obtained from a grant through the Elizabeth and Tony Compter MPN foundation through the Princess Margaret Cancer Foundation, Toronto, ON, Canada. The funder had no role in the design, conduct, or reporting of the study results.
Authorship
Contribution: A.B., V.G., and S.A. conceptualized and designed the study; A.B., N.L., W.C.C., M.C., V.G., and S.A. were responsible for acquisition, analysis, or interpretation of data; A.B. drafted the manuscript and with critical revision of the manuscript for important intellectual content from all authors and performed statistical analysis; V.G. obtained funding; V.G., S.A., and M.C. supervised the study; and all authors contributed to administrative, technical, or material support.
Conflict-of-interest disclosure: The authors declare no competing financial interests.
Correspondence: Aniket Bankar, Division of Medical Oncology and Hematology, Department of Medicine, University of Toronto, 610 University Ave, Toronto, M5G 2M9 Canada; e-mail: aniket.bankar@uhn.ca.
References
Author notes
∗S.A. and V.G. contributed equally to this study.
Data are available on request from the corresponding author, Aniket Bankar (aniket.bankar@uhn.ca).
The full-text version of this article contains a data supplement.

