Key Points
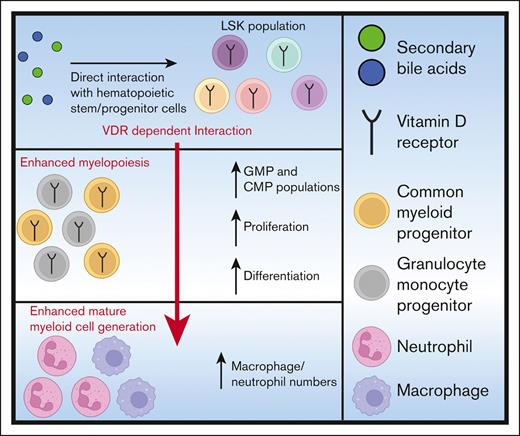
Secondary bile acids interact directly with hematopoietic progenitors to promote myelopoiesis in a VDR-dependent manner.
Secondary bile acids elevated expression of genes associated with differentiation and proliferation in myeloid progenitors.
Abstract
Metabolic products of the microbiota can alter hematopoiesis. However, the contribution and site of action of bile acids is poorly understood. Here, we demonstrate that the secondary bile acids, deoxycholic acid (DCA) and lithocholic acid (LCA), increase bone marrow myelopoiesis. Treatment of bone marrow cells with DCA and LCA preferentially expanded immunophenotypic and functional colony-forming unit–granulocyte and macrophage (CFU-GM) granulocyte-monocyte progenitors (GMPs). DCA treatment of sorted hematopoietic stem and progenitor cells (HSPCs) increased CFU-GMs, indicating that direct exposure of HSPCs to DCA sufficed to increase GMPs. The vitamin D receptor (VDR) was required for the DCA-induced increase in CFU-GMs and GMPs. Single-cell RNA sequencing revealed that DCA significantly upregulated genes associated with myeloid differentiation and proliferation in GMPs. The action of DCA on HSPCs to expand GMPs in a VDR-dependent manner suggests microbiome-host interactions could directly affect bone marrow hematopoiesis and potentially the severity of infectious and inflammatory disease.
Introduction
All circulating mature myeloid cells, such as neutrophils and monocytes, are created via the continuous differentiation of highly proliferative multipotent hematopoietic progenitor cells (HPCs) during myelopoiesis.1,2 Myeloid-biased HPCs are a heterogenous population possessing lineage-restricted common myeloid progenitors (CMPs) and granulocyte-monocyte progenitors (GMPs). Both cell-extrinsic and -intrinsic signals guide the differentiation of GMPs into either neutrophils or monocytes/macrophages.3-6 This process is fundamental to both tissue immune homeostasis and protection from infection.7,8
Recent literature suggests that the commensal microbiome affects bone marrow hematopoiesis.9,10 Microbiota disruption via antibiotic treatment can result in a decreased capacity for myelopoiesis, with decreased GMP and granulocyte production.11,12 Dysbiosis resulting from nutritional deficit, infectious insult, or metabolic disorders can also result in lasting hematologic abnormalities.13-15 Similarly, germ-free animals are hematologically distinct from animals with an intact microbiome, and defects in hematopoiesis can be rectified with the introduction of intestinal commensal bacteria.10,16 Although the underlying mechanisms of these observations are not fully understood, it has been suggested that microbial metabolite production may affect the bone marrow.17 The short-chain fatty acid propionate interacts with the bone marrow to direct the differentiation of monocytes and dendritic cells during allergic inflammation.18 Lactate promotes hematopoiesis by regulating the production of stem cell factor (KIT ligand) via bone marrow stromal cells.19 Similarly, we demonstrated that animals with elevated serum concentrations of secondary bile acids, deoxycholic acid (DCA) and lithocholic acid (LCA), have elevated GMPs.20 However, the tissue compartment that bile acids function in and the pathways that mediate marrow GMP expansion and alteration of myelopoiesis remain unknown.
Primary bile acids are derived from the host via cholesterol metabolism in the liver and then transported to the gut in which they aid in the emulsification of fats and lipids.21 Members of the intestinal microbiota, including Clostridium species, further metabolize primary bile acids into secondary bile acids, such as DCA and LCA.22,23 Secondary bile acids are potent regulators of the immune system, interacting with mature intestinal immune cells, via bile acid receptors, to maintain tissue immune homeostasis and guide intestinal inflammation.24,25 Although bile acid receptors are expressed in select nonintestinal tissues, including the bone marrow, bile signaling in the marrow environment and its contribution to myelopoiesis is not well understood.26,27
In this study, we examined the sufficiency of bile acids to alter myelopoiesis, and discovered that secondary bile acids can augment the production of progenitors constituting the GMP and CMP populations as well as mature myeloid cells. The increased myelopoiesis occurs via direct communication of bile acids with bone marrow hematopoietic stem and progenitor cells (HSPCs), which elevates the expression of myeloid differentiation and cellular proliferation genes and requires the secondary bile acid sensor, the vitamin D receptor (VDR).28,29
Methods
Mice
Four- to 8-week-old, male C57BL/6 mice (wild type [WT] and VDR–/–, The Jackson Laboratories) were housed in a specific pathogen-free facility and provided with autoclaved food and water ad libitum. Sentinels were used to ensure that mice were free of common murine pathogens. All procedures were approved by the institutional animal care and use committee of the University of Virginia.
Isolation of bone marrow for ex vivo experiments
Whole bone marrow was isolated, as previously described.20 After isolation, whole bone marrow was either (1) immediately used in ex vivo assays, (2) stained for fluorescence-activated cell sorting (FACS), or (3) placed into cryostor CS10 (StemCell Technologies) for long-term storage in a −80°C freezer. Cell viability was assayed using trypan blue exclusion, and counting was done on an automatic hemocytometer (TC-20; Bio-Rad).
Colony-forming assay for functional determination of hematopoietic progenitors
Twenty thousand whole bone marrow cells, 1000 lineage (Lin)− Sca-1+ c-Kit+ (LSK) cells, 2000 GMPs, or 1000 CMPs from VDR–/– or WT mice were placed into MethoCult M3434 (StemCell Technologies) per the manufacturer’s protocol. Cells were cultured with either control media (Iscove modified Dulbecco medium [IMDM] + 2% fetal bovine serum [FBS]), DCA (35 μM; Sigma-Aldrich), cholic acid (CA; 35 μM; VWR), LCA (18 μM; Sigma-Aldrich), or 1,25-dihydroxy vitamin D3 (1,25-VITD3; 100 nM, 1 nM, or 1 nM; Sigma-Aldrich). Colony formation of burst forming units–erythroid (BFU-Es), colony-forming unit–granulocyte, erythrocyte, macrophage, and megakaryocyte (CFU-GEMMs), and CFU-granulocyte and macrophage (CFU-GMs) were analyzed on culture-day 11. Colony morphology was assessed with experimental blinding.
Wright-Giemsa staining for GMP morphological assessment
WT or VDR–/– cells from the colony-forming assays were isolated via dissolution of the semisolid media. Colonies were removed by washing with IMDM + 2% FBS. Cells were centrifuged, and the media was decanted via aspiration; this wash step was repeated twice. Isolated cells were stained for FACS to isolate GMPs. GMPs were subjected to FACS using phosphate-buffered saline (PBS) + 3% bovine serum albumin and spun onto microscope slides. The slides were placed in 98% methanol for 7 minutes to fix the cells. Cells were stained with 0.02% Wright-Giemsa stain (Sigma-Aldrich) for 30 minutes and washed with distilled water to remove excess stain. Slides were mounted in Cytoseal XYL (Epredia) and coverslipped. Images were obtained with the NanoZoomer S360 digital scanner (Hamamatsu). Images were uploaded to the PathCore database, and representative images were selected using the PathCore Flow solution.
Liquid coculture experiments
Irradiated AFT024 cells were seeded to confluency in 24-well plates in Dulbecco modified Eagle medium + 10% FBS + 0.05 mM 2-mercaptoethanol in a 33°C, 5% CO2 incubator. Complete media was made adding 0.22 μm filter–sterilized minimum essential medium α with nucleosides (StemCell Technologies) containing 1mM hydrocortisone (StemCell Technologies) to Myelocult M5300 (StemCell Technologies) for a final concentration of 1 μM hydrocortisone. AFT024 media was removed from the wells, and 200 000 whole bone marrow cells in 1 mL of complete media were added to each well. Cells were cultured for 1 week either in control media or in the presence of DCA (35 μM) or LCA (18 μM). After 1 week, media were removed and placed into a collection tube, adherent cells were washed with Hanks balanced salt solution (StemCell Technologies). Hanks balanced salt solution was removed and placed into the collection tube, and cells were treated with Trypsin-EDTA (0.05%; Thermo Fisher Scientific). Trypsinization was halted by washing cells with heat-inactivated FBS, followed by IMDM + 2% FBS. This was placed back into the collection tube and centrifuged to form pellet cells. The media were decanted via aspiration. Cells were resuspended in FACS buffer (PBS + 1% FBS) and stained for spectral flow cytometry.
In silico assessment of bile acid receptor expression
Bile acid receptor messenger RNA expression was compared using the online publicly available database, Haemosphere. Data were derived from the heamopedia mouse RNA–sequencing data set.30
IV DCA treatment
Control mice that were 4- or 6-week-old VDR–/– and WT littermates were IV administered 400 μL of 0.20 mg/mL DCA or PBS 3 times a week for 2 weeks. Cage beddings were swapped every 3 days between genotypes to minimize variability caused by differences in the microbiome.
scRNA-seq
Cells were isolated from our liquid coculture system, and lineage-negative cells were subjected to FACS for single-cell RNA sequencing (scRNA-seq). Cells were sorted using 1% FACS buffer in low–protein binding microcentrifuge tubes (Thermo Fisher Scientific). The cells were then centrifuged at 800g and resuspended in 50 μL of PBS + 0.04% bovine serum albumin and filtered with a Flowmi filter (Millipore Sigma). Cell viability was assessed using the CellDrop cell counter (DeNovix Inc) and the acridine orange/propidium iodide viability assay (DeNovix Inc). The Genome Analysis and Technology core generated the single-cell indexed libraries and performed quality control analyses to ensure high-quality RNA. Briefly, 8000 cells per sample were targeted for use with the 10X Genomics Chromium Controller platform, the Chromium single-cell 3′ library, and the Gel Bead Kit version 3.1 reagent. Generated complementaty DNA was subjected to quality control using the 4200 TapeStation instrument, using the D5000 Kit (Agilent). Quality control was performed on the Illumina Miseq, using the nano 300Cycle kit (1.4 million reads per run). Samples were then deep sequenced on the NextSeq 2000, using the P3-100 Cycle kit. Binary Base Call (BCL) files were converted to a FASTQ format using Illumina bcl2fastq2 software.
scRNA-seq analysis
FASTQ files were used to generate a count matrix using the cell ranger pipeline (10x Pipeline) and then imported to the Seurat R package for in-depth analysis.31 Cell sample size, average unique molecular identifier (UMI) counts per cell, and average detected genes per cell were as follows: for media, 9346, 65 526, and 3270, respectively; and for DCA-treated samples, 8520, 61 884, and 2930, respectively). Cells with unusually low or high total UMI counts (ie, <1000 or >50 000) or a high percentage of UMI counts arising from mitochondrial genes (>10%) were filtered out. Data were normalized across samples using the SCTransform function.32 In the normalization procedure, the variables “percentage of mitochondrial gene expression” and “number of detected genes” were regressed to remove these sources of variation. Principal component analysis and uniform manifold approximation and projection were performed for dimension reduction and data visualization.33 Clustering analysis was implemented via Seurat function FindClusters with Louvain algorithm.34 To determine the number of clusters, we maximized the average silhouette width to ensure modest cohesion within each cluster and separation between clusters. Cluster marker genes and differentially expressed genes between treatments within a cluster were determined through the Seurat function FindMarkers with the MAST algorithm.35 To adjust for multiple comparisons, we controlled false discovery rate through the Benjamini-Hochberg procedure. Genes with an adjusted P value < .05 were considered differentially expressed. Gene Ontology enrichment analysis was conducted for differentially expressed genes between treatments in the GMP cluster through the gene functional annotation tool DAVID.36
Software and statistical analyses
Spectral flow data were analyzed on the flow cytometry analysis software OMIQ. All data were exported into GraphPad Prism (version 9.0.2) for statistical analysis. All figures were compiled and arranged using Adobe Illustrator (version 27.0). All experiments in this study were analyzed using unpaired Student t tests, a one-way analysis of variance with Tukey post hoc test, or a two-way analysis of variance with Šidák or Dunnett post hoc test.
Results
Secondary bile acids expand myeloid cells via direct interaction with bone marrow
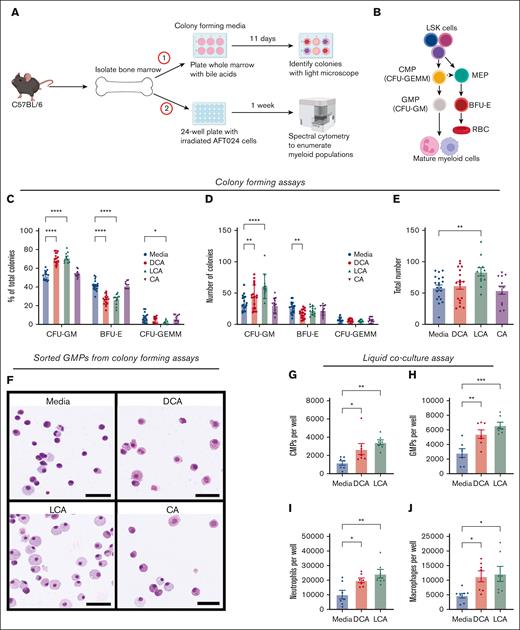
We previously demonstrated that mice with elevated serum secondary bile acids, DCA and LCA, had significantly higher numbers of GMPs than those with normal acid levels, as measured via flow cytometry and colony-forming assays.20 Although secondary bile acids can signal to mature immune cells as well as intestinal cells and hepatocytes,37-39 it was unclear whether DCA and LCA could communicate to the bone marrow to stimulate myelopoiesis. We hypothesized that secondary bile acids act directly on bone marrow cells, and used ex vivo approaches to determine whether secondary bile acids were sufficient to drive myelopoiesis (Figure 1A-B). Whole bone marrow treated with LCA and DCA, but not marrow treated with primary bile acid and DCA precursor CA, exhibited a preferential increase in CFU-GMs (Figure 1C). This preferential expansion involved an increase in the total number of CFU-GMs in DCA/LCA-treated cultures, a decrease in BFU-Es in DCA-treated cultures (Figure 1D), an increase in the total number of all colonies in LCA-treated cultures (Figure 1E), and morphological changes in GMPs, suggesting enhanced maturity, with sorted cells exhibiting macrophage- and neutrophil-like morphologies (Figure 1F).40
Secondary bile acids expand myeloid cells via direct interaction with bone marrow. (A) Whole bone marrow was placed in either (1) colony-forming media or (2) liquid coculture with AFT024 cells. (B) Myelopoiesis schematic representation; CFU-GEMM, CFU-GM, MEP, and BFU-E. (C-E) Whole bone marrow was cultured in colony-forming media with DCA, CA, or LCA. Colonies were analyzed as (C) percentage of total colonies, (D) number of individual colony types, and (E) total colony numbers. (F) Wright-Giemsa staining of FAC-sorted GMPs from colony-forming assays; bar represents 50 μM size. (G-J) Flow cytometric analysis of frequencies of (G) CMPs, (H) CMPs, (I) neutrophils, and (J) macrophages from liquid coculture experiments. All data are shown and represent 3 (colony-forming assay) or 2 (liquid coculture) experimental replicates and were analyzed using one-way analysis of variance (ANOVA) with Tukey post hoc test, or two-way ANOVA with Dunnett post hoc test. ∗P < .05; ∗∗P < .01; ∗∗∗P < .001; ∗∗∗∗P < .0001. MEPs, megakaryocyte erythrocyte progenitors.
Secondary bile acids expand myeloid cells via direct interaction with bone marrow. (A) Whole bone marrow was placed in either (1) colony-forming media or (2) liquid coculture with AFT024 cells. (B) Myelopoiesis schematic representation; CFU-GEMM, CFU-GM, MEP, and BFU-E. (C-E) Whole bone marrow was cultured in colony-forming media with DCA, CA, or LCA. Colonies were analyzed as (C) percentage of total colonies, (D) number of individual colony types, and (E) total colony numbers. (F) Wright-Giemsa staining of FAC-sorted GMPs from colony-forming assays; bar represents 50 μM size. (G-J) Flow cytometric analysis of frequencies of (G) CMPs, (H) CMPs, (I) neutrophils, and (J) macrophages from liquid coculture experiments. All data are shown and represent 3 (colony-forming assay) or 2 (liquid coculture) experimental replicates and were analyzed using one-way analysis of variance (ANOVA) with Tukey post hoc test, or two-way ANOVA with Dunnett post hoc test. ∗P < .05; ∗∗P < .01; ∗∗∗P < .001; ∗∗∗∗P < .0001. MEPs, megakaryocyte erythrocyte progenitors.
To further validate that secondary bile acids drive myelopoiesis, we used a previously described coculture system for murine HPCs41 (Figure 1A), followed by spectral cytometry to analyze immune cell populations (supplemental Figure 1; supplemental Table 1). Bile acid treatment increased both mature and immature myeloid cell populations, including CMPs (Figure 1G; supplemental Figure 2A), GMPs (Figure 1H; supplemental Figure 2B), neutrophils (Figure 1I; supplemental Figure 2C), and macrophages (Figure 1J; supplemental Figure 2D). Bile acid treatment did not elevate the numbers of monocytes (supplemental Figure 2E-H), LSK cells (supplemental Figure 2I-J), or other GMP progenitors such as lymphoid-primed multipotent progenitors (supplemental Figure 2K-L).42
DCA interacts with HSPCs to drive myelopoiesis and does not require stromal cells
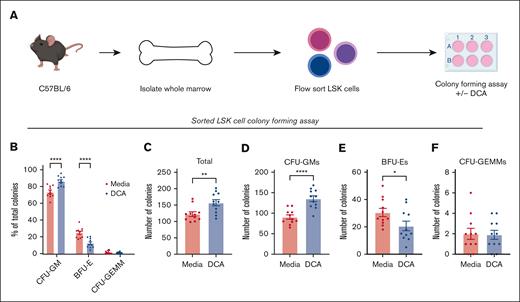
The bone marrow is composed of specialized niches having both hematopoietic and stromal cells. Stromal cells form a critical component that support HSPCs and help guide their proliferation and differentiation.43,44 We aimed to determine the necessity of stromal cells for myeloid expansion during DCA treatment. LSK cells were flow-sorted to enrich HSPCs, and deplete stromal cells and were cultured in colony-forming media in the presence or absence of DCA (Figure 2A; supplemental Table 2). Cultures treated with DCA generated elevated proportions of CFU-GMs (Figure 2B), increased total numbers of colonies (Figure 2C) and CFU-GMs (Figure 2D), decreased BFU-Es (Figure 2E), and did not affect CFU-GEMMs (Figure 2F). Moreover, Addition of a heterogenous population of CD34− cells back to sorted CD34+ cultures resulted in no change in CFU-GM expansion upon treatment with DCA (supplemental Figure 3A-D). These data suggest that stromal cells are not required for DCA-mediated expansion of myelopoiesis and that secondary bile acids can signal directly to HSPCs to alter hematopoiesis.
DCA treatment of bone marrow progenitor cells increased the generation of CFU-GMs in the absence of stromal cells. (A) LSK cells were FAC-sorted from C57BL/6 marrow and placed into colony-forming media in the presence or absence of DCA. Cultures on day 11 were assayed for the presence of CFU-GMs, BFU-Es, and CFU-GEMMs and analyzed as (B) the proportion of total colonies present, (C) the total number of colonies, as well as the total number of (D) CFU-GMs, (E) BFU-Es, and (F) CFU-GEMMs. All data are shown and represent 3 experimental replicates and were analyzed using two-way ANOVA with Šidák post hoc test or an unpaired Student t test. ∗P < .05; ∗∗P < .01; ∗∗∗P < .001; ∗∗∗∗P < .0001.
DCA treatment of bone marrow progenitor cells increased the generation of CFU-GMs in the absence of stromal cells. (A) LSK cells were FAC-sorted from C57BL/6 marrow and placed into colony-forming media in the presence or absence of DCA. Cultures on day 11 were assayed for the presence of CFU-GMs, BFU-Es, and CFU-GEMMs and analyzed as (B) the proportion of total colonies present, (C) the total number of colonies, as well as the total number of (D) CFU-GMs, (E) BFU-Es, and (F) CFU-GEMMs. All data are shown and represent 3 experimental replicates and were analyzed using two-way ANOVA with Šidák post hoc test or an unpaired Student t test. ∗P < .05; ∗∗P < .01; ∗∗∗P < .001; ∗∗∗∗P < .0001.
LSK cells are a heterogenous population of HSPCs with members capable of producing myeloid progenitor cells. Moreover, we have shown previously that bone marrow from DCA-treated animals maintains heightened myelopoiesis 8 weeks after transplantation, when adoptively transferred to treatment-naive animals.20 This suggests that a transplantable fraction of the hematopoietic compartment is affected by elevated serum DCA, rather than a stromal population. Thus, to better understand how DCA exerts its effect on myelopoiesis, flow-sorted CMPs and GMPs were placed into colony-forming media with or without DCA. DCA treatment of CMPs preferentially expanded CFU-GMs without significantly altering the number of CFU-GMs, BFU-Es, or CFU-GEMMs (supplemental Figure 3E-I). Furthermore, the treatment of GMPs did not enhance total colony output (supplemental Figure 3J). Moreover, serial replating of flow-sorted LSK cells treated with DCA in the first plating, but not subsequent platings, showed that DCA-treated cultures had significantly higher colony generation than untreated controls (supplemental Figure 3K). Overall, our data suggest that DCA interacts with GMP progenitors, not GMPs, to enhance myelopoiesis while elevating self-renewal and cellular output of LSK cells.
The VDR is required for CFU-GM expansion during DCA treatment
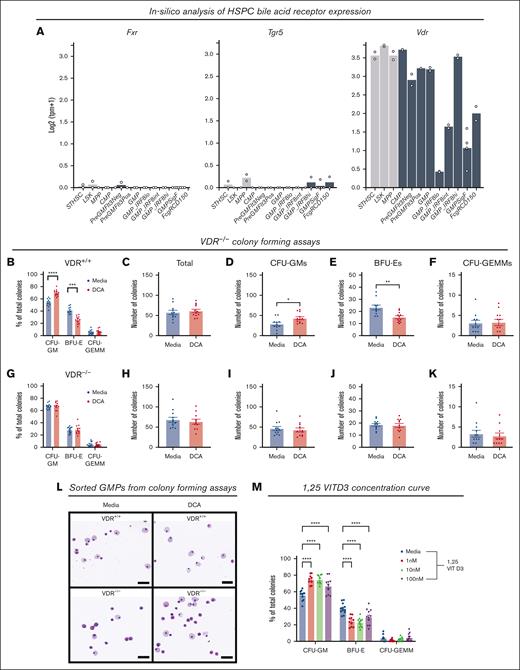
Bile acids signal through bile acid receptors to mediate cellular functions.24,39 Although the functions of these receptors are becoming better understood within metabolic tissues, such as the liver and gut, little is known about the role of bile acid receptors within the bone marrow. We used Haemosphere, a publicly available RNA-seq database, to explore the expression of canonical bile acid receptors, the farnesoid X receptor (FXR) and the Takeda G protein–coupled receptor (TGR5), and secondary bile acid sensor, the VDR, in HSPCs.28-30Fxr and Tgr5 were not expressed in the majority of myeloid progenitors in this data set, whereas Vdr was highly expressed (Figure 3A). Because VDR was recently been shown to be a bile acid sensor,28,29 we examined its contribution to our model and hematopoiesis.
The VDR mediated CFU-GM expansion during DCA treatment. (A) Messenger RNA expression of bile acids receptors Fxr and Tgr5, and bile acid sensor, Vdr, was analyzed in HSPCs using the RNA-seq database Heamosphere. (B-K) Whole bone marrow from (B-F) VDR+/+ littermate controls and (G-K) VDR–/– mice was placed into colony-forming media in the presence of DCA. Colonies were analyzed as (B,G) the proportion of total colonies, (C,H) the total colony number, and the number of (D,I) CFU-GMs, (E,J) BFU-Es, and (F,K) CFU-GEMMS. (L) Wright-Giemsa staining of FAC-sorted GMPs from colony-forming assays; bar represents 50 μM. (M) Colony-forming assay in the presence of VDR ligand 1,25-VITD3. All data are shown and represent 3 experimental replicates. Data were analyzed with either an unpaired Student t test or two-way ANOVA with Dunnett or Šidák post hoc test. ∗P < .05; ∗∗P < .01; ∗∗∗P < .001; ∗∗∗∗P < .0001.
The VDR mediated CFU-GM expansion during DCA treatment. (A) Messenger RNA expression of bile acids receptors Fxr and Tgr5, and bile acid sensor, Vdr, was analyzed in HSPCs using the RNA-seq database Heamosphere. (B-K) Whole bone marrow from (B-F) VDR+/+ littermate controls and (G-K) VDR–/– mice was placed into colony-forming media in the presence of DCA. Colonies were analyzed as (B,G) the proportion of total colonies, (C,H) the total colony number, and the number of (D,I) CFU-GMs, (E,J) BFU-Es, and (F,K) CFU-GEMMS. (L) Wright-Giemsa staining of FAC-sorted GMPs from colony-forming assays; bar represents 50 μM. (M) Colony-forming assay in the presence of VDR ligand 1,25-VITD3. All data are shown and represent 3 experimental replicates. Data were analyzed with either an unpaired Student t test or two-way ANOVA with Dunnett or Šidák post hoc test. ∗P < .05; ∗∗P < .01; ∗∗∗P < .001; ∗∗∗∗P < .0001.
To determine whether VDR was required for GMP expansion, we treated whole marrow from WT littermate controls (Figure 3B-F) or VDR-deficient mice (VDR–/–) (Figure 3G-K) with DCA. DCA treatment expanded CFU-GMs in WT cultures (Figure 3B), did not alter total colony counts (Figure 3C), increased CFU-GMs (Figure 3D), decreased BFU-Es (Figure 3E), and did not affect CFU-GEMMs (Figure 3F). Conversely, DCA treatment of VDR–/– bone marrow did not expand CFU-GMs (Figure 3G) and did not alter the total numbers of colonies (Figure 3H), CFU-GMs (Figure 3I), BFU-Es (Figure 3J), or CFU-GEMMs (Figure 3K). We observed that the VDR was required for the previously observed morphological changes to GMPs in DCA-treated cultures (Figure 3L). Finally, we tested whether the canonical VDR ligand, 1,25-VITD3, also induced myelopoiesis. Whole bone marrow treated with 1,25-VITD3 recapitulated the results from bile acid treatment, supporting that VDR activation drives myelopoiesis in this model system (Figure 3M).
VDR was necessary for DCA-mediated GMP expansion in vivo
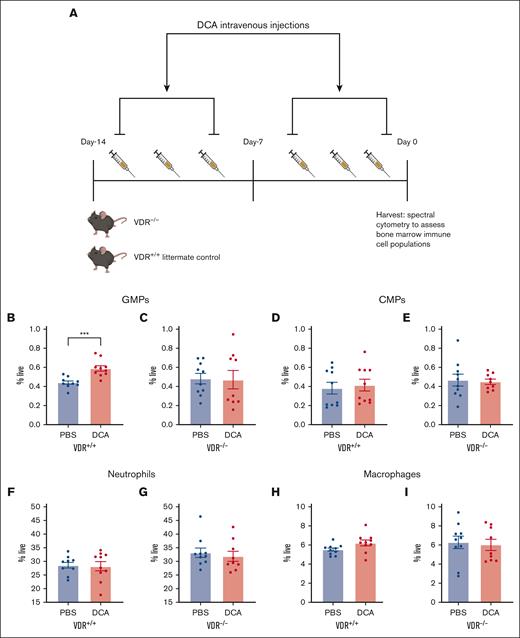
We hypothesized that VDR was required in vivo for the expansion of GMPs after DCA treatment. DCA was administered to VDR–/– mice and their WT littermate controls, as described previously (Figure 4A).20 DCA significantly increased GMPs in WT mice (Figure 4B) but not in VDR–/– mice (Figure 4C). No significant difference in CMPs, neutrophils, or macrophages was detected in WT (Figure 4D,F,H) or VDR–/– mice (Figure 4E,G,I). Moreover, monocytes, LSK cells, and lymphoid-primed multipotent progenitors did not increase in either WT (supplemental Figure 4A,C,E,G) or VDR–/– mice (supplemental Figure 4B,D,F,H).
VDR was necessary for DCA-mediated GMP expansion in vivo. (A) VDR–/– and WT littermate control mice, 4 or 6 weeks old, were given DCA IV 6 times over the course of 2 weeks. (B-I) Bone marrow was isolated from WT littermate controls (B,D,F,H) as well as VDR–/– mice (C,E,G,I). The following populations were analyzed: (B,C) GMPs, (D,E) CMPs, (F,G) neutrophils, and (H,I) macrophages. All data are shown and represent 2 experimental replicates, and data were analyzed using unpaired Student t test. ∗P < .05; ∗∗P < .01; ∗∗∗P < .001; ∗∗∗∗ P < .0001.
VDR was necessary for DCA-mediated GMP expansion in vivo. (A) VDR–/– and WT littermate control mice, 4 or 6 weeks old, were given DCA IV 6 times over the course of 2 weeks. (B-I) Bone marrow was isolated from WT littermate controls (B,D,F,H) as well as VDR–/– mice (C,E,G,I). The following populations were analyzed: (B,C) GMPs, (D,E) CMPs, (F,G) neutrophils, and (H,I) macrophages. All data are shown and represent 2 experimental replicates, and data were analyzed using unpaired Student t test. ∗P < .05; ∗∗P < .01; ∗∗∗P < .001; ∗∗∗∗ P < .0001.
DCA treatment increases differentiation and proliferation in GMPs
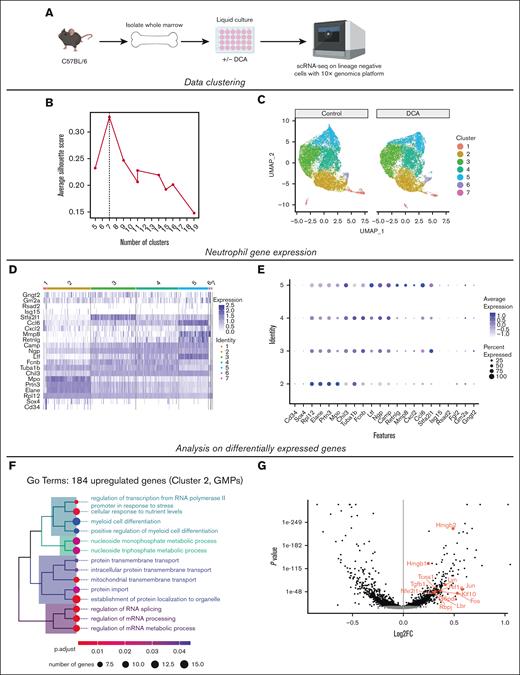
To explore how DCA affects GMPs to alter myeloid cell development, we used scRNA-seq of sorted Lin− cells (supplemental Table 2) from liquid culture with and without DCA (Figure 5A), as described in Figure 1. We tested data quality by examining the number of genes and UMIs on a per-cell basis, the mitochondrial and ribosomal transcript counts as a percentage of the total transcript count, the ratio of the total number of transcripts to the percentage of mitochondrial gene expression, and the total number of genes (supplemental Figure 5A-F).31 In addition, we analyzed the relationship between the total number of transcripts and genes and the percentage of these represented within the top 50 expressed genes (supplemental Figure 5G-H).31
DCA treatment increases differentiation and proliferation in GMPs. (A) Lin− cells were FAC-sorted from our liquid coculture system in the presence or absence of DCA, and subjected to scRNA-seq using the 10x Genomics platform. (B) Selection of an optimal number of clusters by maximizing the silhouette width in Louvain clustering after dimensional reduction with PCA. (C) Cell cluster visualization using uniform manifold approximation and projection after PCA dimensional reduction. (D) Expression of known neutrophil genes across clusters. (E) Dot plot of genes associated with neutrophil maturity analyzed throughout the clusters to identify GMPs. (F) Top categories from a GO analysis using the 184 most upregulated genes within cluster 2 after mapping genes using the Entrez Gene NCBI database. (G) Volcano plot of cluster 2 with significantly upegulated and downregulated genes labeling genes associated with myeloid cell development identified in the GO analysis. GO, gene ontology; PCA, principal component analysis.
DCA treatment increases differentiation and proliferation in GMPs. (A) Lin− cells were FAC-sorted from our liquid coculture system in the presence or absence of DCA, and subjected to scRNA-seq using the 10x Genomics platform. (B) Selection of an optimal number of clusters by maximizing the silhouette width in Louvain clustering after dimensional reduction with PCA. (C) Cell cluster visualization using uniform manifold approximation and projection after PCA dimensional reduction. (D) Expression of known neutrophil genes across clusters. (E) Dot plot of genes associated with neutrophil maturity analyzed throughout the clusters to identify GMPs. (F) Top categories from a GO analysis using the 184 most upregulated genes within cluster 2 after mapping genes using the Entrez Gene NCBI database. (G) Volcano plot of cluster 2 with significantly upegulated and downregulated genes labeling genes associated with myeloid cell development identified in the GO analysis. GO, gene ontology; PCA, principal component analysis.
A silhouette width analysis was performed to optimize the number of clusters to a 7-cluster model (Figure 5B).45 Dimensionality reduction was performed using a principal component analysis before uniform manifold approximation and projection visualization of clusters (Figure 5C).33,34 To identify clusters, we used myeloid gene expression profiles established in previous scRNA-seq studies.46,47 Cluster 2 was identified as GMPs based on the expression of marker genes including Elane, Sox4, Cd34, and Mpo, and clusters 3 to 5 were identified as neutrophil progenitors based on the stepwise induction of Ltf, Mmp8, and Cxcl2 throughout the clusters (Figure 5D-E).46 Cluster 1 was identified as early HSPCs by the expression of Gata2, Egr1, and Il1rl1 (supplemental Figure 5I),46-49 and cluster 6 consisted of monocytic progenitors demonstrated by the high expression of monocyte development genes (supplemental Figure 5J).47 A Gene Ontology analysis was performed on both significantly upregulated (Figure 5F) and downregulated (supplemental Figure 5K) genes in cluster 2 when treated with DCA.
Myeloid differentiation genes were upregulated during DCA treatment (Figure 5F-G). Among these genes, DCA treatment upregulated activator protein-1 genes Fos, Jun, and Hif1α, which are all implicated in cellular proliferation and myelopoiesis.50-53 We then examined how DCA could alter cell cycle activity in GMPs (supplemental Figure 5L). We observed a significantly higher proportion of GMPs in the G2M phases of the cell cycle in the DCA group (supplemental Figure 5M) as well as a significantly higher G2M score in DCA-treated GMPs at a per-cell level (supplemental Figure 5N). Moreover, DCA significantly increased expression of a cellular proliferation marker and G2M gene, Mki67, in GMPs on a per-cell basis (supplemental Figure 5O-P). This suggests a mechanism by which DCA treatment heightens myeloid differentiation, proliferation, and colony formation by increasing cell cycle activity and myelopoiesis gene expression in bone marrow progenitors. Collectively, these data demonstrate that secondary bile acids enhance myelopoiesis by interacting directly with HPCs in a VDR-dependent manner and elevating the expression of genes associated with proliferation and myeloid differentiation in GMPs.
Discussion
The key discoveries in our work establish a new paradigm to explain how individual microbial metabolites can shape myeloid cell development via marrow-resident metabolite receptors. Treatment with secondary bile acids was sufficient to enhance the proliferation and differentiation of both mature and immature myeloid cells in ex vivo cultures. Interestingly, DCA treatment of a sorted LSK population was sufficient to promote myelopoiesis, demonstrating that secondary bile acids could directly interact with HSPCs outside the stromal environment. The VDR was required for the DCA-mediated expansion of CFU-GMs and GMPs, as demonstrated by the failure of DCA to enhance myelopoiesis in VDR–/– mice and VDR-deficient marrow ex vivo. Treatment of whole bone marrow with the canonical VDR ligand 1,25-VITD3 mimicked these observations, suggesting that VDR activation promotes myelopoiesis of marrow cells ex vivo. Finally, we discovered that DCA treatment was associated with the elevated expression of genes associated with myeloid differentiation and cellular proliferation in GMPs.
Our study adds novel insights to the role of bile acids in hematopoiesis. Previous studies have demonstrated that bile acids, notably taurocholic acid, can act as chemical chaperones in the fetal liver to prevent protein aggregation in rapidly expanding hematopoietic stem cells.54 Serum bile acid concentration is also associated with enhanced recovery from myelosuppressive chemotherapy in humans and administration of taurodeoxycholic acid promotes hematopoietic recovery in mice after treatment with 5-fluorouracil.55 It is important to note that these studies did not interrogate the role of direct bone marrow bile acid signaling or decouple potential interactions with hepatic or intestinal tissues. Herein, we analyzed how bile acids communicate with the bone marrow and assessed whether specific action on hematopoietic progenitors were sufficient to elevate myelopoiesis vs more indirect mechanisms involving other tissue compartments. We demonstrated that secondary bile acid treatment of marrow cells ex vivo was sufficient to enhance myelopoiesis and that this action was dependent upon the VDR. Therefore, to our knowledge, our results establish a novel pathway by which secondary bile acids can enhance myelopoiesis via direct interactions with marrow-resident receptors.
Our results suggest an interdependence of bile acid–enhanced myelopoiesis and the VDR. Previous studies have established that secondary bile acids interact with the VDR in the intestinal environment and can signal through the canonical bile acid receptors FXR and TGR5 in stromal cells within the bone marrow environment to enhance osteogenesis.26-28 However, until this study, it remained unknown whether secondary bile acids could interact with the VDR within the marrow, particularly in HSPCs. We determined that secondary bile acids could communicate directly with HSPCs because DCA treatment of a FAC-sorted LSK population enhanced myelopoiesis. Importantly, recent lineage-tracing experiments have shown that multipotent progenitors within the LSK population are the major contributor to adult blood cell development and that all GMPs, CMPs, and mature myeloid cells are derived from progenitors within this population.2,56 In silico data demonstrated that, in hematopoietic progenitors, the Vdr gene was highly expressed compared with Fxr and Tgr5. DCA treatment failed to promote myelopoiesis in animals and whole marrow deficient in VDR. VDR activation can induce myeloid differentiation, notably granulopoiesis in zebrafish models, as well as monopoiesis in murine and human CD34+ cord blood cells, and promote survival and proliferation of HPCs.57-60 Importantly, these studies were performed using 1,25-VITD3, and this study is, to the best of our knowledge, the only to date to examine VDR-bile interactions in hematopoietic progenitors. Therefore, our work uncovers a new pathway by which bile acids communicate with hematopoietic progenitors via the VDR, with the capacity to shape lifelong myelopoietic processes.
We observed that secondary bile acid treatment was sufficient to broadly enhance myelopoiesis, elevating CMPs, GMPs, neutrophils, and macrophages ex vivo but not in vivo. This is consistent with our previous results that animals with elevated serum DCA exhibit elevated GMPs, but only during infectious insult were more mature myeloid cells observed in the intestine.20 Thus, we aimed to better understand how bile–VDR signaling altered mature myeloid cell development from the GMP population. We determined that GMPs from secondary bile acid–treated cultures have significantly elevated expression of the myeloid differentiation/proliferation genes Jun and Fos and the cell proliferation marker gene Mki67. The protein products of activator protein-1 genes Fos and Jun, c-Fos and c-Jun, respectively, are known regulators of the cell cycle, and c-Jun interactions with master myeloid transcription factor PU.1 are required for myeloid cell generation from multipotent progenitors.61-63 Moreover, VDR deficiency has been shown to decrease the expression of the protein product of Mki67, KI67, in murine LSK cell populations.58 Our results suggest that secondary bile acids are sufficient to expand the GMP population by promoting the proliferation and differentiation of hematopoietic progenitors. However, additional signals may be required in vivo to promote the differentiation of cells within the GMP population to mature myeloid cells.
In conclusion, we have demonstrated that secondary bile acids are sufficient to drive bone marrow myelopoiesis by interacting directly with the LSK population in a VDR-dependent manner. This work adds to the mechanistic insight of how bile acids can potentiate systematic immune responses via direct interactions with progenitor cells. Increased understanding of bile acid–VDR interactions in gut–marrow communication highlights the critical role of microbiome-derived metabolites in myelopoietic regulation, which will affect human health both during homeostasis and during the context of infectious and inflammatory disease.
Acknowledgments
The authors are grateful to C. Chew, T. Harper, A. Wendling, and M. Solga at the Flow Cytometry Core facility at the University of Virginia (UVA) for expert advice (RRID: SCR_017829), K. Sol-Church and the Genome Analysis and Technology Core (RRID: SCR_018883), as well as P. Kumar and M. Anwaruddin at the UVA Bioinformatics core for assistance with scRNA-seq, P. Pramoonjago and the Biorepository and Tissue Research Facility at UVA for assistance with the Wright-Giemsa staining experiments, J. Gatesman and the Center for Comparative Medicine for assisting with intravenous DCA administration, and Timothy Bender at UVA for review of the manuscript. All graphics were created with BioRender.com.
This work was supported by National Institutes of Health (NIH), National Institute of Allergy and Infectious Diseases grants R01 AI146257 (S.L.B.), 2R37 AI026649 (W.A.P.J.), and R01 DK68634 (E.H.B.). B.T. was supported by NIH grant 5T32AI007046.
Authorship
Contribution: B.T. designed and performed experiments, analyzed results, and wrote the manuscript; S.K. and S.L. carried out computational analysis of the scRNA-seq data; J.R., M.J.U., and D.N.O. performed experiments and edited the manuscript; S.B. edited the manuscript; E.H.B. provided feedback, gave expert advice on experimental design, discussed data, and edited the manuscript; W.A.P.J. provided oversight on experimental design and analysis, and edited the manuscript; and S.L.B. designed and supervised the conduct of the work, and edited the manuscript.
Conflict-of-interest disclosure: The authors declare no competing financial interests.
Correspondence: Stacey L. Burgess, University of Virginia School of Medicine, PO Box 801340, Room 1706, Carter Harrison Research Building, MR6, Charlottesville, VA 22907-1340; e-mail: slb5rc@virginia.edu.
References
Author notes
Single-cell RNA sequencing data are deposited in the Gene Expression Omnibus database (accession number GSE215639; accession token Cdmjegwcrjqbroz).
Data are available on request from the corresponding author, Stacey L. Burgess (slb5rc@virginia.edu).
The full-text version of this article contains a data supplement.

