

Key Points
GOLM1 is significantly upregulated in ALK+ ALCL by nucleophosmin-ALK through AKT/mTOR/miR-145.
GOLM1 suppressed ALCL cells' apoptosis by prolonging B-cell lymphoma-extra large protein's stability and promoting ALK+ ALCL’s progression.

Abstract
Golgi membrane protein 1 (GOLM1) is aberrantly expressed in many types of solid tumors and contributes to cancer development; however, its role in hematopoietic and lymphoid neoplasms remains unknown. Here, we report that GOLM1 was significantly upregulated in anaplastic large cell lymphoma (ALCL), particularly in anaplastic lymphoma kinase-positive (ALK+) ALCL. Mechanistically, the expression of GOLM1 was induced by nucleophosmin-ALK in both ALK-transformed T cells and ALCL cell lines through AKT/mTOR pathway. Knockdown of GOLM1 expression led to a reduction in the growth and viability of ALCL cells with increased spontaneous apoptosis, whereas ectopic expression of GOLM1 protected ALCL cells from apoptosis induced by staurosporine treatment. Moreover, GOLM1 directly interacted with B-cell lymphoma-extra large protein (a crucial anti-apoptosis regulator) and significantly prolonged its stability. Introduction of GOLM1 promoted ALK+ ALCL cells colony formation in vitro and tumor growth in a murine xenograft model. Taken together, our findings demonstrate, to our knowledge, for the first time that GOLM1 plays a critical role in suppressing apoptosis and promoting the progression of ALK+ ALCL and provide evidence that GOLM1 is a potential biomarker and therapeutic target in ALK-induced hematological malignancies.
Introduction
Anaplastic large cell lymphoma (ALCL) is a distinct category of non-Hodgkin lymphoma, accounting for 2% to 7% of all non-Hodgkin lymphoma cases.1,2 The natural progression of this disease is still unclear because of the identity of multiple cell origins.1,3-5 The nucleophosmin (NPM)-anaplastic lymphoma kinase (ALK) fusion receptor tyrosine kinase was identified in a subset of patients,6 leading to subdivision of this disease into ALK+ ALCL and ALK- ALCL as distinct entities in the current World Health Organization classification.7 Although ALK+ ALCLs show much better response to therapy than ALK− ALCL, clinicians and researchers also observed that patients with ALK+ ALCL usually present with advanced stage disease (stage III or IV),8 and survival rate dramatically decreases in late stages.9,10 ALK+ lymphomas in transgenic mice take several months to develop.11 Our previous report showed that it took the NPM-ALK (NA) fusion protein about 1 month to induce normal human T cells to transform into ALCL-like tumor cells.12 These data suggest that a combination of lesions is required for the transformation of ALK+ cells. The transforming properties and signaling elicited by ALK fusion proteins have been extensively studied, whereas new downstream pathways of ALK are still emerging.13,14 Interestingly, through bioinformatics analysis, we discovered that Golgi membrane protein 1 (GOLM1) is highly correlated with ALK expression. Therefore, we explored the role of GOLM1 in ALK+ ALCL.
GOLM1, also named GOLPH2 or GP73, is a type-II Golgi transmembrane protein. It was first identified and cloned from a complementary DNA (cDNA) library derived from the liver of a patient with adult giant cell hepatitis,15 and then independently identified in the “Discovery of Secretory Protein Program.”16 The expression of GOLM1 is regulated by multiple factors including microRNA-200, -143, and -145.3,5,17-20 Clinical data has shown that GOLM1 is highly expressed in the serum of patients with liver disease, especially hepatocellular carcinoma (HCC).21-23 Compared with alpha-fetoprotein (AFP) sensitivity, which has been used in clinic for the past 40 years,22 GOLM1 is more sensitive in diagnosing the early stages HCC,24,25 even in AFP- HCC.26 GOLM1 can regulate the recycling of epidermal growth factor receptor by facilitating its intracellular transport, thereby prolonging the activation of downstream kinases and further promoting the metastasis of HCC.27 The expression of GOLM1 in the serum of patients with HCC caused by hepatitis B and C virus infections is significantly upregulated.28 The overexpression of GOLM1 has also been reported in other solid tumors types including prostate cancer,29 lung cancer,30 etc. The elevated GOLM1 level in the serum of patients with lung cancer30 or urine of patients with prostate cancer,29 indicates that GOLM1 may be a good candidate biomarker for the diagnosis of cancer. It has been noted that elevated GOLM1 can also reduce CD8+ T-cell infiltration31 and suppress its function32 in the tumor microenvironment.
Although it has been reported that GOLM1 plays an important role in the development of solid tumors, the role of GOLM1 in hematopoietic and lymphoid neoplasms remains unclear. In this study, we explored these aspects of GOLM1’s novel biological activities in suppressing apoptosis and promoting the progression of ALK+ ALCL.
Materials and methods
Cells and tissue samples
For the use of blood samples from healthy donors, written informed consent was obtained in accordance with approval from the Human Sample Ethical Committee of Shanghai Jiao Tong University. The isolation, expansion, and infection of CD4+ T cells were performed according to a previously described protocol.12 The ALK+ ALCL cell lines SUP-M2, Karpas299, DEL, and SUDHL-1, and ALK− cutaneous T-cell lymphoma cell lines Myla3675, Myla2059 were kindly provided by Mariusz A. Wasik (University of Pennsylvania, Philadelphia, Pennsylvania, The United States). All cells including Jurkat T cells (Ma lab stock) were grown in RPMI 1640 medium supplemented with 10% fetal bovine serum, 100 U/mL of penicillin, and 100 mg/mL of streptomycin. ALCL tissues were acquired as excisional biopsies obtained for diagnostic purposes and were used in this study under a protocol approved by the University Review Board (ML2019031). Diagnosis and GOLM1 staining were established by standard morphological and immunohistochemical criteria. Images were obtained with a NIKON Eclipse ci and analyzed by Image J software. Quantification of the immunohistochemical staining of GOLM1 and ALK proteins in tumors was evaluated on the basis of the ratio and intensity of the staining and scored by multiplying the percentage of positive cells by the intensity.33 Three random fields in each section were calculated.
Reverse transcription-quantitative polymerase chain reaction (RT-qPCR)
Total RNA was extracted by Trizol reagent (Invitrogen) and reverse transcription was performed using PrimeScript RT reagent Kit with gDNA Eraser (Takara). Expression level of GOLM1 messenger RNA (mRNA) were quantified by Real-time PCRs performed by Bio-Rad Laboratories CFX sequence detection system, using primers (5′-AGAGCGTCAACAAGCTGTACC-3′ and 5′-CAGAGGAATTACGGCAGGCTG-3′). All assays were performed in 3 independent replicates. The fold difference in RNA levels was calculated on the basis of the difference between CT values (ΔΔCT) obtained for control and individual mRNA. Relative miR-145 expression was measured by RT-PCR and calculated by the ΔΔCt method relative to U6, following the protocol described elsewhere.20
Western blot
Cells were lysed in RIPA buffer supplemented with protease inhibitor. Protein (20-40 μg) was resolved on a 10% sodium dodecyl sulfate/polyacrylamide gel electrophoresis gel and transferred to the PVDF membrane. The membrane was blocked with 3% to 5% bovine serum albumin and probed by the primary antibodies against poly-(ADP-ribose) polymerase-1 (PARP-1) (Santa Cruz Biotechnology), B-cell lymphoma-extra large (BCL-XL) (Cell Signaling Technology), cleaved caspases-3 (Cell Signaling Technology), and GOLM1 (Sino biology). The data were acquired by Odyssey fluorescence detection system (LI-COR Biosciences, Lincoln, NE).
DNA constructs and ALK inhibitors
Lentiviral vector pLKO.1 containing short hairpin RNA (shRNA) sequence targeting GOLM1 (GAACAGTGTGAGGAGCGAATA) or scramble sequence (TCGAAGGAATAGTGAGGAACG) was constructed for GOLM1 knockdown. The GOLM1 full-length coding sequence was cloned from Hanjiahuai cDNA library into a lentivirus vector. Karpas 299 cells were subjected to CRISPR/Cas9-mediated knockout of GOLM1 by lentiviral infection of lentiCRISPR v2 based vector carrying the guide sequences specific for GOLM1 (shown in supplemental Figure 7B). Positive single-cell clones were screened using 4 μg/mL puromycin and verified by sequencing and western blot. The ALK inhibitors CEP28122 (kindly provided by Mariusz A. Wasik) and crizotinib (MedChemExpress) were used for the inhibition of ALK activity.
Apoptosis assay
Cells were stained using Annexin V fluorescent conjugates (BD Biosciences, Franklin Lakes, NJ) and propidium iodide according to the manufacturer’s protocol. Data were obtained with the Accuri C6 flow cytometer (BD Biosciences) and analyzed with FlowJo software (Tree Star Inc, Ashland, OR).
MTS assay
The CellTiter 96 AQueous One Solution Cell Proliferation Assay (Promega, Madison, WI) was used for the MTS assay following manufacturer’s instruction. Data were collected from triplicate experiments.
Colony formation
Cells were plated for 28 days in semisolid agar prepared and then stained by p-iodonitrotetrazolium violet for 24 hours according to the standard protocol. Colonies were visualized by regular camera and analyzed by Image J software.
Tumorigenesis studies
The mouse study was conducted in accordance with the recommendations of Shanghai Jiao Tong University Animal Care guidelines. All experimental protocols were approved on 1 August 2016, by the Shanghai Jiaotong University Animal Care Committee. Nonobese diabetic/severe combined immunodeficiency mice, aged 6 weeks, were obtained from Beijing Vital River Laboratory Animal Technology Co, Ltd for SUP-M2 tumor growth; and 2 × 10⁷ luciferase stably expressed SUP-M2 cells in 100 μL phosphate-buffered saline were injected subcutaneously into the mice. Mice were monitored both at day 1 and week 6 after injection for tumor growth by bioluminescence imaging with the Xenogen Spectrum System and Living Image software version 3.2 (Calipere PerkinElmer, Hopkinton, MA), according to a previously described protocol.12
Bioinformatics and statistical analysis
The online public database Oncomine was used to identify the mRNA expression correlation between GOLM1 and ALK in human patients with lymphoma. The thresholds were set as follows: P value = .0001; fold change, 2; gene rank, 10%; analysis type, coexpression analysis; and data type, mRNA. The correlation factor were generated automatically for “Eckerle lymphoma” data set, whereas the original data from other data sets were extracted and Pearson R was calculated manually. For data analysis, the 2-tailed Student t test and SPSS analysis of the immunohistochemistry data set were used. P < .05 was considered statistically significant and denoted with ∗; P < .01 was denoted with ∗∗. All data are presented as the mean ± standard error of the mean or standard deviation.
Results
GOLM1 is upregulated in ALK+ ALCL tissues and cell lines
To identify genes that may be correlated with ALK+ ALCL, we analyzed the Oncomine database, a data mining platform that separates ALCL as a distinct cancer type. We found that among the 19 574 measured genes from the “Eckerle lymphoma” data set,34 the expression of several genes, including GOLM1, were highly correlated with ALK expression (Figure 1A; supplemental Figure 1). Further analysis of the relative mRNA level of GOLM1 (Figure 1B) confirmed that GOLM1 was significantly upregulated in ALK+ ALCL (P < .0001) compared with normal T/natural killer cells or ALK- ALCL. The expression of GOLM1 is also slightly increased in ALK-- ALCL. The ALCL samples obtained from other data sets, including the Iqbal Lymphoma,35 Piccaluga Lymphoma,36 Piva Cell Line,37 Ballester Lymphoma,38 and Barretina Cell Line39 data sets, were also analyzed (Figure 1C; supplemental Table 1). A strong linear relationship was observed between GOLM1 and ALK with a Pearson R of 0.72. The levels of GOLM1 expression in ALCL tissues were examined by immunohistochemistry in formalin-fixed, paraffin-embedded tissue samples from 14 ALCL cases. The pilot experiment data verified that the anti-GOLM1 antibody was specific and suitable for localizing GOLM1 to the Golgi region (supplemental Figure 2). The expression of GOLM1 showed distinct patterns (P < .001) between ALK+ and ALK- ALCL. There was a weak or moderate GOLM1 expression in all 6 ALK- ALCL tissue samples, whereas 6 out of 8 ALK+ ALCL samples had a relatively high expression of GOLM1 (Figure 1D).

GOLM1 is overexpressed and correlates with ALK in human ALK+ ALCL. (A) Correlation of the expression levels of GOLM1 and ALK. Colors are z score normalized to depict relative values within rows. (B) The GOLM1 transcript (calculated as log2 median-centered intensity) as studied in Human Genome U133 Plus 2.0 Array platform in samples from patients with ALK+ ALCL from the Oncomine database (Eckerle lymphoma) and compared with normal T lymphocyte/NK cells and ALK- ALCL. (C) Correlation between mRNA transcript levels of ALK and GOLM1 in human samples from patients with ALCL from Oncomine database. (D) A representative image of immunohistochemistry analysis to show the expression of GOLM1 in ALK+ ALCL, but not in samples from patients with ALK- ALCL. Original magnification 200×. (E-F) GOLM1 mRNA and protein expression in the ALK+ ALCL cell lines DEL, SUP-M2, Karpas 299, SUDHL-1, and other cell lines was evaluated by qPCR and western blotting, respectively. Data, presented as the mean ± SD, are representative of 3 independent experiments. NK, natural killer; SD, standard deviation.
GOLM1 is overexpressed and correlates with ALK in human ALK+ ALCL. (A) Correlation of the expression levels of GOLM1 and ALK. Colors are z score normalized to depict relative values within rows. (B) The GOLM1 transcript (calculated as log2 median-centered intensity) as studied in Human Genome U133 Plus 2.0 Array platform in samples from patients with ALK+ ALCL from the Oncomine database (Eckerle lymphoma) and compared with normal T lymphocyte/NK cells and ALK- ALCL. (C) Correlation between mRNA transcript levels of ALK and GOLM1 in human samples from patients with ALCL from Oncomine database. (D) A representative image of immunohistochemistry analysis to show the expression of GOLM1 in ALK+ ALCL, but not in samples from patients with ALK- ALCL. Original magnification 200×. (E-F) GOLM1 mRNA and protein expression in the ALK+ ALCL cell lines DEL, SUP-M2, Karpas 299, SUDHL-1, and other cell lines was evaluated by qPCR and western blotting, respectively. Data, presented as the mean ± SD, are representative of 3 independent experiments. NK, natural killer; SD, standard deviation.
To determine the GOLM1 expression status of ALK+ ALCL, we performed qPCR analysis in various B- and T-lymphoma cell lines. The results showed that all 4 ALK+ ALCL cell lines highly expressed GOLM1 mRNA to various degrees, whereas all other ALK- cell lines had lower GOLM1 expression (Figure 1E). Moreover, there was no evidence to show that the mRNA level of GOLM1 expression was related to virus infection, particularly Epstein-Barr virus infection in B-cell lymphoma (supplemental Figure 3A). The striking dichotomy was confirmed at the protein level, as determined by western blotting (Figure 1F). All 4 ALK+ ALCL cell lines highly expressed GOLM1, whereas there was no detectable protein expression in ALK- cell lines. Interestingly, the endogenous expression levels of GOLM1 in ALK+ ALCL cell lines were comparable with those of overexpressed GOLM1 in HCC cell lines (supplemental Figure 3B).
GOLM1 expression is upregulated by NA through the AKT-mTOR pathway
To study whether ALK regulated the expression of GOLM1, the ALK+ ALCL cell lines SUP-M2 and Karpas 299 and ALK- T-cell lymphoma cell line Jurkat were treated with the ALK inhibitors CEP281222 or crizotinib. Compared with the dimethyl sulfoxide (DMSO) treatment group, the cells exhibited downregulated GOLM1 expression at the mRNA (Figure 2A) and protein (Figure 2B) levels after treatment with ALK inhibitors. Next, we exogenously expressed wild-type NA or mutants devoid of enzymatic activity (KD) in Jurkat, SUP-M2, and Karpas 299 cells by lentivirus infection (the expression of NA was confirmed by flow cytometry, as shown in supplemental Figure 4A). Increasing GOLM1 mRNA expression was observed in the NA-transduced but not KD-transduced groups in both the SUP-M2 and Karpas 299 cell lines, whereas Jurkat cell lines showed no alteration of GOLM1 at mRNA and protein levels (supplemental Figure 4B-C). In contrast, GOLM1 mRNA expression did not change in the KD group compared with the control group, suggesting that lentiviral infection does not increase GOLM1 expression in ALCL. We previously demonstrated that the in vitro transduction of normal human CD4+ T lymphocytes with a lentiviral vector expressing NA (not KD) is able to induce their malignant transformation.12 To determine whether GOLM1 is upregulated during NA mediated malignant transformation of normal T cells, we similarly treated and transduced purified normal CD4+ T cells with lentiviral vector expressing NA or KD as described previously,12 followed by analysis of GOLM1 expression (the growth curve was recorded as supplemental Figure 4D to confirm the transformation). GOLM1 RNA and protein levels were evaluated for human T-cell samples at days 0, 7, 14, 28, 35, and 49 after lentiviral transduction (the expression of NA was monitored by flow cytometry, as shown in supplemental Figure 4F). Deep sequencing of an independent set of samples collected at day 6, 9, 12, 33, and 63 confirmed that GOLM1 was upregulated during the transformation process40 (supplemental Figure 4E). Strikingly, the mRNA and protein levels of GOLM1 gradually increased during the transformation process (Figure 2C-D) but did not increase after KD transduction (supplemental Figure 4G). Consistently, the positive regulation of GOLM1 by NA was also confirmed by transduction of a lentiviral vector expressing NA or KD into the ALK- cutaneous T-cell lymphoma cell lines MyLa2059 and MyLa3675 (Figure 2E).

GOLM1 is upregulated by NA. (A) The ALK inhibitor reduces the transcription level of GOLM1 in ALK+ ALCL cells. The total RNA from ALK+ ALCL (SUP-M2 and Karpas 299) and Jurkat T-cell lines with or without treatment of the ALK inhibitors CEP28122 (100 nM)41 or crizotinib (2 μM)42 for 24 hours were subjected RT-qPCR analysis. (B) The ALK inhibitor reduces the protein level of GOLM1 in ALK+ ALCL cells. The whole cell lysate from ALK+ ALCL (SUP-M2 and Karpas 299) and Jurkat cell lines with or without treatment of ALK inhibitor CEP28122 (100 nM) for 24 hours were subjected to western blotting. (C-D) Purified CD4+ T cells were stimulated with anti-CD3/CD28 beads and either transduced with wild-type NA or KD or left uninfected, then cultured in CO2 incubator. Cells were count and expanded according to previous description.12 GOLM1 mRNA and protein were gradually increased during human T-cell transformation process upon lentivirus-encoded NA (Lenti-NA) infection. Samples were collected at 0, 7, 14, 28, 35, and 49 days after infection. (E) The mRNA and protein levels of GOLM1 in MyLa2059 and MyLa3675 cells transduced with NA or its KD mutant were individually detected by qPCR and western blot. (F-K) The pan-AKT inhibitor Ipatasertib and mTOR inhibitor rapamycin reduced the transcription and protein levels of GOLM1 in ALK+ ALCL cells. The total RNA and cell lysate from ALK+ ALCL cell lines with or without treatment of Ipatasertib or rapamycin at indicated concentration for 24 hours were subjected qPCR and western blot analysis. (∗P < .05, ∗∗∗P < .001, 2-tailed Student t test).
GOLM1 is upregulated by NA. (A) The ALK inhibitor reduces the transcription level of GOLM1 in ALK+ ALCL cells. The total RNA from ALK+ ALCL (SUP-M2 and Karpas 299) and Jurkat T-cell lines with or without treatment of the ALK inhibitors CEP28122 (100 nM)41 or crizotinib (2 μM)42 for 24 hours were subjected RT-qPCR analysis. (B) The ALK inhibitor reduces the protein level of GOLM1 in ALK+ ALCL cells. The whole cell lysate from ALK+ ALCL (SUP-M2 and Karpas 299) and Jurkat cell lines with or without treatment of ALK inhibitor CEP28122 (100 nM) for 24 hours were subjected to western blotting. (C-D) Purified CD4+ T cells were stimulated with anti-CD3/CD28 beads and either transduced with wild-type NA or KD or left uninfected, then cultured in CO2 incubator. Cells were count and expanded according to previous description.12 GOLM1 mRNA and protein were gradually increased during human T-cell transformation process upon lentivirus-encoded NA (Lenti-NA) infection. Samples were collected at 0, 7, 14, 28, 35, and 49 days after infection. (E) The mRNA and protein levels of GOLM1 in MyLa2059 and MyLa3675 cells transduced with NA or its KD mutant were individually detected by qPCR and western blot. (F-K) The pan-AKT inhibitor Ipatasertib and mTOR inhibitor rapamycin reduced the transcription and protein levels of GOLM1 in ALK+ ALCL cells. The total RNA and cell lysate from ALK+ ALCL cell lines with or without treatment of Ipatasertib or rapamycin at indicated concentration for 24 hours were subjected qPCR and western blot analysis. (∗P < .05, ∗∗∗P < .001, 2-tailed Student t test).
Previous studies have shown that NA activates multiple signal transduction pathways, including signal transducer and activator of transcription 3 (STAT3) and AKT (and its downstream target mammalian target of rapamycin, mTOR).14 To further identify which signaling pathway is involved in the regulation of GOLM1 by ALK, ALCL cell lines were treated with pharmacologic inhibitors of the STAT3 (Stattic), and pan-AKT (Ipatasertib) proteins were used in different dosage to treat ALCL cell lines. The results showed that AKT but not STAT3 is responsible for ALK-mediated regulation of GOLM1 expression, as assessed by GOLM1 mRNA and protein levels in responding Sttatic (supplemental Figure 5) and Ipatasertib (Figure 2F-G). Interestingly, we observated that Jurkat cells, which have high levels of activated AKT because of lack of PTEN activity,43 did not present an increase in GOLM1 levels after transduction with lentiviral vector expression (NA), suggesting that another suppression of the mechanism might exist in Jurkat cells. Consistent with previous studies showing that ALK can induce mTOR activation through the activation of AKT1 and AKT2,44 we also observed that the expression of GOLM1 in ALCL cell lines was inhibited by the mTOR inhibitor rapamycin (Figure 2H-I). In agreement with mTOR being reported as a negative regulator of microRNA-145 (miR-145) expression, and miR-145 being able to inhibit GOLM1 expression by targeting 256 to 268 nt of the GOLM1 gene coding sequence, miR-145 was upregulated by rapamycin treatment in a dose-dependent manner (Figure 2J-K). This further confirmed that ALK regulated the expression of GOLM1 through the AKT-mTOR pathway.
GOLM1 can protect ALK+ ALCL from apoptosis
To determine the effects of GOLM1 on ALCL cells, we generated cells with stable GOLM1 shRNA knockdown (shGOLM1) mediated by specific lentivirus-encoded GOLM1 shRNAs, and confirmed that GOLM1 was knocked down by >95% at the mRNA level (Figure 3A) and 67% to 76% at the protein (Figure 3B) level. The knockdown of GOLM1 in ALCL cells was associated with lower cumulative cell numbers during expansion compared with that of the scramble control group, as determined by cell counting every 2 days (Figure 3C). To determine whether the lower cell number resulted from a lower proliferation rate, we first labeled cells with CFSE and observed the dilution of CFSE among the shGOLM1, scramble, and no shRNA groups. The results showed that the 3 groups had similar proliferation rates (supplemental Figure 6). Meanwhile, cell counts with trypan blue showed that the cell viability decreased around 47.2% to 74.6% in different ALK+ ALCL cell lines (Figure 3D), suggesting that GOLM1 may protect cells from death. We further analyzed the growth and cell death rates in the exogenous NA-expressing ALK− cell lines MyLa2059 and MyLa3675 (which also render the expression of GOLM1) and Jurkat cell lines (with no increase in of GOLM1 levels). Consistently, cell growth and viability were dramatically enhanced along with the increase in GOLM1 expression in NA-expressing MyLa2059 and MyLa3675 cells, whereas they were not significantly changed in Jurkat cells with no alteration in GOLM1 expression (Figure 3E-F).

Inhibition of GOLM1 expression in ALK+ ALCL cells reduces cell viability. (A) Establishment of GOLM1 stable knockdown in ALK+ALCL (SUDHL-1, SUP-M2, and Karpas 299) and Jurkat cells. Cells were infected by lentivirus-encoded GOLM1 or scramble shRNA, and stable clones were selected. The GOLM1 mRNA and (B) protein were detected by qPCR or western blotting (∗P < .05, ∗∗∗P < .001, 2-tailed Student t test). (C) The growth curves of GOLM1 knockdown ALK+ ALCL cells and (D) NA or KD expressing ALK- cells. The shGOLM1 or shscramble ALK+ ALCL cells were seeded as 1 × 10⁵ per well (200 μL) for expansion. The cells were counted and seeded as 1 × 10⁵ per well (200 μL) every other day during 8 or 10 days period. (E) The viability of GOLM1 knockdown ALK+ ALCL cells and (F) NA or KD expressing ALK- ALCL cells. The cells were seeded as 1 × 10⁵ per well (200 μL). Cell viability was determined by trypan blue staining.
Inhibition of GOLM1 expression in ALK+ ALCL cells reduces cell viability. (A) Establishment of GOLM1 stable knockdown in ALK+ALCL (SUDHL-1, SUP-M2, and Karpas 299) and Jurkat cells. Cells were infected by lentivirus-encoded GOLM1 or scramble shRNA, and stable clones were selected. The GOLM1 mRNA and (B) protein were detected by qPCR or western blotting (∗P < .05, ∗∗∗P < .001, 2-tailed Student t test). (C) The growth curves of GOLM1 knockdown ALK+ ALCL cells and (D) NA or KD expressing ALK- cells. The shGOLM1 or shscramble ALK+ ALCL cells were seeded as 1 × 10⁵ per well (200 μL) for expansion. The cells were counted and seeded as 1 × 10⁵ per well (200 μL) every other day during 8 or 10 days period. (E) The viability of GOLM1 knockdown ALK+ ALCL cells and (F) NA or KD expressing ALK- ALCL cells. The cells were seeded as 1 × 10⁵ per well (200 μL). Cell viability was determined by trypan blue staining.
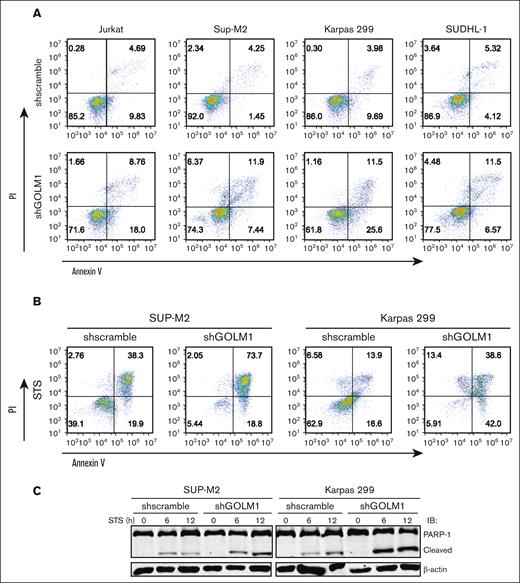
To investigate whether GOLM1 affects the apoptosis of ALK+ ALCL cells, we performed flow cytometry analysis based on Annexin V/propidium iodide staining. The data showed a higher percentage of apoptotic cells (both early and late apoptosis) after GOLM1 knockdown in ALK+ ALCL cells (Figure 4A). In addition, both ALK+ ALCL with shGOLM1 (or shscramble) and NA (or KD)-expressing ALK− cells were individually treated with the broad kinase inhibitor staurosporine (STS) or DMSO control to induce cell death, followed by flow cytometry analysis. The results showed that apoptosis was induced after STS treatment for 24 hours, and the shGOLM1 group exhibited nearly 2-fold more apoptosis than the scramble group (Figure 4B). Cells were also treated with STS for 0, 6 or 12 hours and the cleavage of PARP (Figure 4C) was evaluated. Notably, PARP cleavage was markedly increased in the shGOLM1 group in both SUP-M2 and Karpas 299 cells. In addition, we knocked out GOLM1 in Karpas 299 cells (supplemental Figure 7A), generated knockout cell lines by serial dilution, and verified the results through sequencing and western blotting (supplemental Figure 7B-C). Knockout of GOLM1 by CRISPR/cas9 resulted in an increase in the apoptosis rate under both natural and STS-treated conditions (supplemental Figure 7D). To further confirm the effects of GOLM1 on apoptosis, SUP-M2 cells were transduced with lentivirus encoding both GOLM1 and mCherry (which are separated by the T2A system),45 and clones stably overexpressing GOLM1 were selected. Consistent with this, knockdown of GOLM1 by shGOLM1 resulted in lower growth and viability in both the DMSO control and STS-treated groups, as determined by MTS optical density reading (Figure 4D). We found that GOLM1 overexpression significantly increased the growth and viability of SUP-M2 cells after STS treatment, whereas no difference was observed between the control and GOLM1 overexpression groups when STS was not added to induce apoptosis (possibly because SUP-M2 growth and viability reached their maximum capacity). Similar results were observed in GOLM1 overexpressing or GOLM1 knockdown Karpas 299 and SUDHL-1 cells (Figure 4D).
GOLM1 contributes to the antiapoptotic activity of ALK+ ALCL cells. (A) The apoptosis of cells with shGOLM1 or shscramble was detected by flow cytometry with Annexin V/PI staining. (B) Cells with shGOLM1 or shscramble knockdown were treated with STS for 24 hours, followed by apoptosis analysis as described in panel A. (C) The levels of PARP1 cleavage in the SUP-M2 and Karpas 299 cells with shGOLM1 or shscramble after treatment with 0.1 μM STS treated for 0, 6, or 12 hours were detected by western blotting. (D) The effect of GOLM1 on the growth rate and apoptosis of SUP-M2, Karpas 299, and SUDHL-1 cells with shGOLM1 or overexpressed (GOLM1) was determined by MTS conversion (∗P < .05, ∗∗∗P < .001, 2-tailed Student t test). The cell lysate from cells with same treatment as above column was extracted and western blot was performed to evaluate GOLM1 protein level. (E) SUP-M2 cells with shGOLM1 or overexpressed GOLM1 were treated with crizotinib (2 μM) for 24 hours and performed flow cytometry with Annexin V/PI staining. PI, propidium iodide.
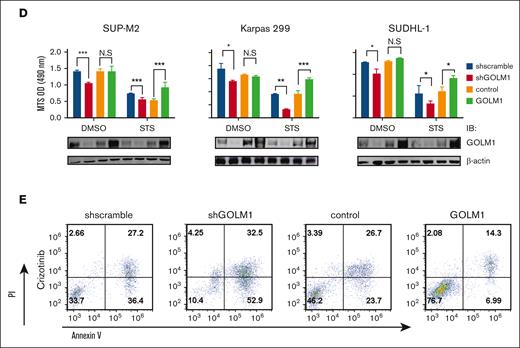
To further prove that GOLM1 is required for the survival of ALK+ ALCL cells, SUP-M2 cells with either GOLM1 knockdown or GOLM1 overexpression were individually treated with the ALK inhibitor crizotinib (Figure 4E) or the solvent DMSO (supplemental Figure 8). The results showed that enhanced resistance to crizotinib was observed with GOLM1 overexpression. In contrast, increased apoptosis in response to ALK inhibitors was observed with GOLM1 knockdown. These results indicate that GOLM1 plays a role in protecting cells from apoptosis.
GOLM1 promotes tumor growth in vivo
Apoptosis has long been considered a process that cells must evade in order to develop cancer; although tumor cells are not more resistant to apoptosis than their normal tissue counterparts.46 To determine whether GOLM1 affects the cellular transformation of ALCL in vitro, we performed colony formation assays of ALK+ and ALK− cells with different levels of GOLM1 expression in soft agarose (Figure 5A). The results showed that both Karpas 299 and SUP-M2 GOLM1 knockdown cells maintained only ∼46% anchorage-growth ability in the number of colonies compared with the scramble group, whereas MyLa2059 orindependent MyLa3675 cells exhibited better anchorage-independent colony formation with NA expressing (Figure 5A-B). The data suggest that GOLM1 may have an intrinsic ability to influence cellular transformation, which may underlie its tumor-promoting activities in vivo. To assess the effects of GOLM1 on tumor growth in vivo, we generated SUP-M2 cell lines stably expressing firefly luciferase with GOLM1 knockdown or overexpression. The SUP-M2 cells (shscramble) formed large tumors in 3 of 6 mice as xenografts at 6 weeks after intraperitoneal injection into SCID mice (Figure 5C-D), whereas all 6 mice injected with SUP-M2 GOLM1 overexpressing cells developed large tumors that infiltrated the peritoneal wall. Only baseline luciferase activity was observed in 4 out of 6 mice in the GOLM1 knockdown cell injection group at week 6, which might indicate that few or no cells survived. Taken together, these data demonstrate that GOLM1 can promote ALK+ ALCL tumor growth in vivo and is essential in the tumorigenesis of ALK+ ALCL.

GOLM1 promotes tumor growth in vitro and in vivo. (A-B) The anchorage-independent growth of ALCL cells. Cells were subjected to soft agar colony formation assay individually. The colonies were stained by crystal violet and counted by using Image J software. Data from triplicate experiments were presented as mean ± SD (∗P < .05, ∗∗∗P < .001, two-tailed Student t test). (C-D) GOLM1 contributes to ALCL tumor growth in a xenograft mouse model. The tumor burden of NOD/SCID mice intraperitoneally engrafted with 2 × 10⁷ SUP-M2-luc cells with stably expressing GOLM1, GOLM1 knockdown, or scramble control at weeks 0 and 6 were analyzed by the intensity of bioluminescence signal. Data, presented as individual mice, are representative of 3 independent experiments. NOD, nonobese diabetic; SCID, severe combined immunodeficiency; SD, standard deviation.
GOLM1 promotes tumor growth in vitro and in vivo. (A-B) The anchorage-independent growth of ALCL cells. Cells were subjected to soft agar colony formation assay individually. The colonies were stained by crystal violet and counted by using Image J software. Data from triplicate experiments were presented as mean ± SD (∗P < .05, ∗∗∗P < .001, two-tailed Student t test). (C-D) GOLM1 contributes to ALCL tumor growth in a xenograft mouse model. The tumor burden of NOD/SCID mice intraperitoneally engrafted with 2 × 10⁷ SUP-M2-luc cells with stably expressing GOLM1, GOLM1 knockdown, or scramble control at weeks 0 and 6 were analyzed by the intensity of bioluminescence signal. Data, presented as individual mice, are representative of 3 independent experiments. NOD, nonobese diabetic; SCID, severe combined immunodeficiency; SD, standard deviation.
GOLM1 inhibits apoptosis by enhancing BCL-XL protein stability
We showed that GOLM1 knockdown increased apoptosis, whereas its overexpression protected ALK+ ALCL cells from chemically induced apoptosis. It has been shown that STS does not affect endoplasmic reticulum (ER) stress47; therefore, it is unlikely that the increasing apoptosis in GOLM1 knockdown cells was a result of GOLM1 influence on the ER. To further analyze how the apoptotic pathway is affected by the expression of GOLM1, we isolated cDNA from shscramble and shGOLM1 SUP-M2 cells and performed RNA sequencing analysis. A volcano plot showed that 123 genes were upregulated (fold change >2) and 235 genes were downregulated (fold change <0.5) in the GOLM1 knockdown group compared with the shscramble group (Figure 6A), with the most differentially expressed genes involved in protein processing in the ER (Figure 6B). A heatmap was used to visualize 20 genes that were significantly dysregulated in the GOLM1 knockdown group in 2 independent samples (Figure 6C). Notably, genes in the apoptosis pathway showed no alterations in transcription level when the cutoff was set as ≥2-fold (Figure 6D). Because the B-cell lymphoma 2 (BCL-2) protein family controls cell death and mainly changes at the protein level, we evaluated the protein levels of BCL-2, myeloid cell leukemia 1 and BCL-XL in SUP-M2 cells. The results showed that neither BCL-2 nor myeloid cell leukemia 1 were significantly changed at the protein levels after GOLM1 overexpression, whereas endogenous BCL-XL expression was significantly increased with or without STS treatment (Figure 6E). The physical interaction of GOLM1 and BCL-XL was confirmed (Figure 7A) by expressing exogenous His-tagged GOLM1 and FLAG-tagged BCL-XL in 293T cells after coimmunoprecipitation (co-IP) assay. Immunoprecipitation in SUP-M2 cells with anti-GOLM1 antibody followed by western blotting with anti-BCL-XL antibody, and vice versa indicated that GOLM1 and BCL-XL physically interacted in SUP-M2 cells (Figure 7B). To further confirm the interaction within the cellular compartment, we transfected a plasmid encoding GOLM1 tagged with green fluorescent protein (GFP) (GOLM1-GFP) into SUP-M2 and Karpas 299 cell lines, followed by an immunofluorescence assay. The colocazation of GOLM1 and BCL-XL was visualized as the overlap of the signals from GFP and BCL-XL staining (Figure 7C). Consistent with previous results, an increased protein level of BCL-XL was observed in GOLM1-GFP expressing cells, compared with that of surrounding cells without the GOLM1-GFP signal in both SUP-M2 and Karpas 299 cell lines (Figure 7C).

GOLM1 expression increase the expression of BCL-XL. (A) RNA-seq was performed for shGOLM1 or shscramble SUP-M2 cells and the differentially expressed genes were analyzed and presented as a volcano plot. (B) Functional pathway analysis performed by Database for Annotation, Visualization, and Integrated Discovery and KEGG database, and the top 10 most significant pathway are presented as GO terms. (C) The heat map depicts most changed genes in shGOLM1 RNA-seq data compared with scramble samples. (D) The heat map shows no genes significantly change in apoptosis pathway in in shGOLM1 RNA-seq data compared with scramble samples, which was analyzed and plotted by R project software. (E) SUP-M2 cells with GOLM1 overexpression or control were treated with DMSO or STS, and then the protein levels of PARP-1, BCL-XL, BCL-2, MCL-1, GOLM1, and cleaved caspase 3 were detected by western blotting. GO, Gene Ontology; MCL, myeloid cell leukemia.
GOLM1 expression increase the expression of BCL-XL. (A) RNA-seq was performed for shGOLM1 or shscramble SUP-M2 cells and the differentially expressed genes were analyzed and presented as a volcano plot. (B) Functional pathway analysis performed by Database for Annotation, Visualization, and Integrated Discovery and KEGG database, and the top 10 most significant pathway are presented as GO terms. (C) The heat map depicts most changed genes in shGOLM1 RNA-seq data compared with scramble samples. (D) The heat map shows no genes significantly change in apoptosis pathway in in shGOLM1 RNA-seq data compared with scramble samples, which was analyzed and plotted by R project software. (E) SUP-M2 cells with GOLM1 overexpression or control were treated with DMSO or STS, and then the protein levels of PARP-1, BCL-XL, BCL-2, MCL-1, GOLM1, and cleaved caspase 3 were detected by western blotting. GO, Gene Ontology; MCL, myeloid cell leukemia.

GOLM1 blocks cell apoptosis through stabilizing BCL-XL. (A) Exogenous GOLM1 associates with BCL-XL. 293T cells cotransfected with His-GOLM1 and Flag-BCL-XL, were subjected co-immunoprecipitation (IP) followed by immunoblotting (IB) as indicated antibodies. (B) Endogenous GOLM1 interacts with BCL-XL. SUP-M2 cells were subjected co-IP followed by immunoblotting (IB) as indicated antibodies. Normal immunoglobulin G (IgG) is used as control. (C) Representative images with GOLM1-GFP and BCL-XL coexpression (scale bar, 5 μm) in SUP-M2 and Karpas 299 cells. Cells were transfected with plasmid encoded GOLM1-GFP and performed immunofluerescent staining with anti- BCL-XL antibody. The colocalization of GOLM1-GFP and BCL-XL is indicated by an arrow. (D) 293T cells transfected by BCL-XL alone or with GOLM1 were treated with CHX and harvested at indicated time points. (E) The relative intensity of each band in panel D were quantitated by Image J software. (∗P < .05, ∗∗∗P < .001, 2-tailed Student t test).
GOLM1 blocks cell apoptosis through stabilizing BCL-XL. (A) Exogenous GOLM1 associates with BCL-XL. 293T cells cotransfected with His-GOLM1 and Flag-BCL-XL, were subjected co-immunoprecipitation (IP) followed by immunoblotting (IB) as indicated antibodies. (B) Endogenous GOLM1 interacts with BCL-XL. SUP-M2 cells were subjected co-IP followed by immunoblotting (IB) as indicated antibodies. Normal immunoglobulin G (IgG) is used as control. (C) Representative images with GOLM1-GFP and BCL-XL coexpression (scale bar, 5 μm) in SUP-M2 and Karpas 299 cells. Cells were transfected with plasmid encoded GOLM1-GFP and performed immunofluerescent staining with anti- BCL-XL antibody. The colocalization of GOLM1-GFP and BCL-XL is indicated by an arrow. (D) 293T cells transfected by BCL-XL alone or with GOLM1 were treated with CHX and harvested at indicated time points. (E) The relative intensity of each band in panel D were quantitated by Image J software. (∗P < .05, ∗∗∗P < .001, 2-tailed Student t test).
Given that BCL-XL levels increased with GOLM1 expression and that the physical interaction of these proteins was observed, we speculated that GOLM1 may function by enhancing BCL-XL protein stability. We treated 293T cells transfected with BCL-XL in the presence or absence of GOLM1, with the protein synthesis inhibitor cycloheximide (CHX). A striking difference in BCL-XL protein levels was observed between cells transfected with BCL-XL alone or both BCL-XL and GOLM1 (Figure 7D-E). Usually, BCL-XL has a half-life of 24 to 36 hours, however, when GOLM1 was overexpressed even after 36 hours, BCL-XL level remained constant (Figure 7D-E). These data suggest that GOLM1 can stabilize BCL-XL through a physical interaction and, thereby, protect ALK+ ALCL cells from apoptosis.
Discussion
GOLM1 overexpression has been identified in multiple solid tumor types, but not in hematopoietic and lymphoid neoplasms. Through the investigation of the clinical data from the database and the evaluation of the clinical samples and ALK-ALCL cell lines, we found that GOLM1 expression was significantly upregulated in ALK+ ALCL. We further identified that the aberrant expression of GOLM1 was induced by NA through the AKT/mTOR pathway. The expression level of GOLM1 is correlated with the viability of ALK+ ALCL cells owing to its influence on cell apoptosis. We further demonstrated that GOLM1 could interact with the important antiapoptotic regulator BCL-XL, and the stability of BCL-XL was prolonged by the overexpression of GOLM1. Overexpression of GOLM1 can enhance the colony forming capacity and promote tumor formation of ALCL cells in mouse xenografts. Our findings demonstrate an important role of GOLM1 in the transformation of ALK+ ALCL cells and the underlying mechanisms of its inhibition of apoptosis.
It is interesting that the upregulation of GOLM1 was observed in both samples of patients with ALK- and with ALK+ ALCL from the “Eckerle lymphoma” data set, although levels in the latter samples were much higher. We showed that ALK could regulate GOLM1 expression at mRNA level through the AKT/mTOR pathway. By pharmacologically inhibiting STAT3 phosphorylation, we showed that the STAT3 pathway is not involved in the regulation of GOLM1 expression at either the mRNA or protein level, which also suggests that in certain ALK- ALCL subset driven by the STAT3 signaling pathway GOLM1 may not be regulated.48 Our histochemistry data from clinical samples indicated that GOLM1 is not robustly upregulated in ALK- ALCL. It would be interesting to explore whether the overexpression of GOLM1 is a phenomenon restricted to ALK+ ALCL or shared by other unique subsets of ALK- ALCL.
The expression of GP73 in hepatocytes in advanced liver disease can be upregulated via HIF2α pathways, which are induced by hepatitis B virus.15,49 In our preliminary evaluation, we did not find that GOLM1 expression could be induced by Epstein-Barr virus infection in lymphoma, which differs from the situation in HCC. It has been reported that GOLM1 is a better biomarker for the early diagnosis of HCC and prostate cancer. Our previous study showed that GOLM1 is secreted from certain B lymphoma cell lines.50 Because the majority of patients with ALCL present in the clinic with late-stages diseases,8 and the 5-year survival rate dramatically decreases with disease progression,9,10 it would be interesting to explore whether GOLM1 levels also increase in the serum of patients with ALK+ ALCL.
The Golgi complex occupies a central position at the intersection of the secretory and endocytic trafficking pathways and receives vesicles from a range of destinations. As a Golgi membrane protein, GOLM1 plays a critical role in the recycling, spatial redistribution, and signaling kinetics of EGFR and other kinases27 by serving as a specific cargo adapter to assist them in anchoring to the trans-Golgi network and then recycling them back to their functional subcellular location. It is also interesting to find that GOLM1 not only interacts with BCL-XL but also prevents BCL-XL degradation. BCL-XL plays a critical role in cell survival by protecting the integrity of the mitochondrial outer membrane (MOM) and preventing cytochrome release. It is mainly localized in the MOM,51,52 and its transportation to the MOM relies on retrome complex in the endocytic vesicles.53 Although GOLM1 mainly resides in the Golgi in a steady state, there is evidence that it can be trafficked out of the Golgi to a later compartment (such as endosomes)54 or redistributed to the ER and then recycled back again.55 It is possible that BCL-XL is recycled back to the ER through its interaction with GOLM1 and otherwise trafficked to the endosome for degradation. Therefore, GOLM1 enhances the stability of BCL-XL and protects cells from apoptosis. Others have reported that PD-L1 stability can be enhanced by GOLM132 in HCC. We also observed that knocking down GOLM1 reduced the protein levels of BCL-XL in GOLM1 overexpressing HCC cell lines (data not shown). This suggests that the enhancement of BCL-XL by GOLM1 stability and its further function in preventing cell apoptosis are not limited to ALK+ ALCL.
In summary, we demonstrate that GOLM1 is overexpressed in ALK+ ALCL and promotes cell viability and tumor progression by interacting with and stabilizing BCL-XL to inhibit antiapoptosis. This study suggests that GOLM1 is a novel biomarker for ALK+ ALCL diagnosis and has the potential for use in individualized treatment.
Acknowledgments
The authors thank Mariusz Wasik for providing ALK inhibitor and Jiahuai Han for providing GOLM1 cDNA construct used in this study.
This work was supported by the National Natural Science Foundation of China (81772166 to F.W.; 81471930, 81672015 to Q.C.; 31670913 to X.M.).
Authorship
Contribution: Z.Z., S.D., L.Z., Y.W., J.P., L.D., C.Z., and H.W. performed the experiments, analyzed the data, and wrote the manuscript; Y.C., Y.Y., F.Z., and Y.T. contributed to blood donor communication and sample collection; Q.C., J.L.R., and X.M. proofread the manuscript and gave intellectual suggestions; F.W., Q.C., and X.M. contributed to the conception and design, data analysis and interpretation, and manuscript writing and provided financial support; and all authors read and approved the final version of the manuscript.
Conflict-of-interest disclosure: The authors declare no competing financial interests.
Correspondence: Qiliang Cai, MOE/NHC/CAMS Key Laboratory of Medical Molecular Virology, Shanghai Institute of Infectious Disease and Biosecurity, Shanghai Frontiers Science Center of Pathogenic Microorganism and Infection, School of Basic Medical Science, Shanghai Medical College, Fudan University, Shanghai, 200032, China; e-mail: qiliang@fudan.edu.cn; Xiaojing Ma, Department of Microbiology and Immunology, Weill Cornell Medicine, 1300 York Avenue, New York, NY, USA 10021; e-mail: xim2002@med.cornell.edu; and Fang Wei, Sheng Yushou Center of Cell Biology and Immunology, Joint International Research Laboratory of Metabolic & Developmental Sciences, School of Life Sciences and Biotechnology, Shanghai Jiao Tong University, Shanghai 200240, China; e-mail: fangwei@sjtu.edu.cn.

