

Key Points
DDX6 is the direct target of tumor suppressor miR-148a-3p in AML.
DDX6 promotes AML development.

Abstract
Regulation of gene expression at the RNA level is an important regulatory mechanism in cancer. However, posttranscriptional molecular pathways underlying tumorigenesis remain largely unexplored. In this study, we uncovered a functional axis consisting of microRNA (miR)-148a-3p, RNA helicase DDX6, and its downstream target thioredoxin-interacting protein (TXNIP) in acute myeloid leukemia (AML). Using a DROSHA-knockout cell system to evaluate miR-mediated gene expression control, we comprehensively profiled putative transcripts regulated by miR-148a-3p and identified DDX6 as a direct target of miR-148a-3p in AML cells. DDX6 depletion induced cell cycle arrest, apoptosis, and differentiation, although delaying leukemia development in vivo. Genome-wide assessment of DDX6-binding transcripts and gene expression profiling of DDX6-depleted cells revealed TXNIP, a tumor suppressor, as the functional downstream target of DDX6. Overall, our study identified DDX6 as a posttranscriptional regulator that is required for AML survival. We proposed the regulatory link between miR-148a-3p and DDX6 as a potential therapeutic target in leukemia.
Introduction
Acute myeloid leukemia (AML) is a heterogeneous disease characterized by dysregulation of normal blood development and outgrowth of abnormal, undifferentiated leukemia cells.1 Besides genetic and epigenetic alterations, mechanisms of posttranscriptional gene regulation have been increasingly recognized to play important roles in the pathogenesis of AML. These mechanisms involve aberrant splicing,2 RNA modifications,3 translation,4 and microRNA (miRNA)–mediated gene silencing.5 Several promising therapeutic approaches targeting these mechanisms are currently being tested in preclinical and clinical settings.6-8 Therefore, the identification of additional regulators of these pathways can further elucidate the molecular mechanisms underpinning the development of AML while uncovering therapeutic vulnerabilities that can be exploited for AML therapy.
miRNAs are small and noncoding RNAs of 22 nucleotides (nts) that regulate gene expression posttranscriptionally.9-14 In mammals, miRNAs are synthesized by a conserved biogenesis pathway where the microprocessor converts primary miRNAs into precursor miRNAs, which are then cleaved into miRNA duplexes by DICER.11,13,15 miRNA, together with AGO, forms a core of the miRNA-mediated RNA-induced silencing complex, which is recruited to target messenger RNAs (mRNAs) to trigger mRNA decay and suppress translation.9,12-14 miRNAs can function as both tumor suppressors and oncogenes (also called oncomiRs) in various types of cancers.16,17 Over the last decade, miRNAs have been implicated in nearly all aspects of AML pathogenesis from cellular proliferation to survival, differentiation, self-renewal, and therapy resistance.5,18 Several miRNAs including miR-148a-3p are downregulated and are thus proposed to play a tumor-suppressive role in AML.19 Despite this knowledge, the biological relevance and precise molecular mechanisms underpinning the function of many miRNAs in AML remain to be elucidated.
RNA helicases constitute a group of proteins that unwind and remodel RNA structures. RNA helicases are involved in virtually all parts of RNA metabolism.20 In cancer, several RNA helicases, including eIF4A, DDX3, and DHX29, function to selectively drive the expression of oncogenes to enhance the survival of cancer cells.21 In addition, abnormal expression of a handful of RNA helicases, that is, DDX5, DDX17, DDX1, DDX3X, and DDX6, are implicated in cancer development.21 However, their function is highly context-dependent and cancer type–specific. DDX6 (also named Rck/p54) was initially found to be deleted in B-cell lymphoma and hence postulated to have a tumor-suppressive role22; simultaneously, its expression is elevated in several solid tumors such as glioblastoma and lung and colorectal cancers.23,24 Knockdown of DDX6 hinders the proliferation of human colorectal cancer cells,25 but overexpression of DDX6 suppresses the growth of other cell types.26,27 In addition, it is demonstrated that DDX6 can modulate stem cell identity by controlling P-body–mediated translational control.28 However, the role of DDX6 and how it functions in blood cancers is not known. Here, we uncovered a direct functional link between miR-148a-3p and RNA helicase DDX6 in promoting the survival of AML cells. We identified an oncogenic role of DDX6 in AML and nominated the regulatory axis miR-148a-3p/DDX6 as a potential vulnerability for AML survival.
Methods
Transfection of miRNA mimics
HCT116 DROSHA-KO cells, a gift from Narry Kim (Seoul National University),29 were seeded in 6-well plates at the confluence of ∼30%. Either miR-148a-3p mimics or control miRNAs were transfected to the cells at the final concentration of 10 nM using Lipofectamine 3000 (Invitrogen, #L3000-008). Transfection experiments were conducted in triplicate.
Creation of miR-148a-3p lentiviral–expressing vector
The primary transcript of miR-148a-3p that contained the pre–miR-148a hairpin and 30 nt segments flanking at both ends were cloned into pRRL vector by using EcoRI and XhoI digestion and T4 DNA ligase.
Construction of mRNA libraries
Transfected cells were harvested 48 hours posttransfection, and total RNA was extracted using TRIzol (Ambion, #15596018). Collibri 3′ mRNA Library Prep Kit for Illumina (Invitrogen, #A38110024) was used for library preparation. In brief, 500 ng of extracted total RNA were reverse transcribed with the oligo(dT)-containing reverse primers, specifically targeting poly(A)-RNAs and generating complementary DNAs (cDNAs). RNAs were then degraded by the RNA removal reagents at 95°C. The complementary strands of cDNAs were then synthesized with the random forward primers in a 1-cycle PCR reaction. The resulting double-stranded DNAs were then purified using magnetic beads and amplified with a pair of primers containing i5 and i7 indexes to generate the DNA libraries. The concentration and size distribution of the DNA libraries were examined by Qubit dsDNA HS Assay Kit (Invitrogen, #Q32854) and Fragment Analyzer system, respectively. Finally, the examined DNA libraries were subjected to next-generation sequencing.
Construction and analysis of small RNA libraries
The small RNA construction and analysis were performed similarly as previously described.30,31 In brief, the small RNA sequencing libraries were constructed from total RNA samples isolated from HCT116 cells using the TruSeq Small RNA Library Prep Kits (Illumina). The DNA libraries of small RNAs were sequenced by NovaSeq 6000 (Illumina). The resulting DNA sequencing reads were processed by Cutadapt32 (-a AGATCGGAAGAG CACACGTC -A GATCGTCGGACTGTAGAACTCTGAAC), removing the adapters. Next, the sequencing reads were refined by FASTX-Toolkit (fastq-join, fastq_quality_filter -q 30 -p 90, version 0.0.14), which merged paired-end reads, and discarded low quality reads. The refined sequencing reads were finally aligned to the human genome (GRCh38) using Bowtie2, which was set to allow unmatched nucleotides only at their 3′ end.33 The aligned reads were annotated using the miRNA annotation data from miRBase version 22.34 hsa-miR-320a, hsa-miR-320b-1, and hsa-miR-320c-1, which are DROSHA-independent miRNAs, were used as normalization factors of miRNA expression.
mRNA sequencing analysis
The sequencing reads of mRNA were also adapter-trimmed and refined by Cutadapt32 (-a ′A{18}AGATCGGAAGAGCACACGTCTGAACTCCAGTCAC′) and FASTX-Toolkit (fastq_quality_filter -q 30 -p 70, version 0.0.14), respectively. The resulting sequencing reads were mapped to the human genome (GRCh38) using STAR, which was set to permit splice junction mapping.35 Mapped reads were labeled using the human gene transfer format file downloaded from Ensembl. Read distribution across the gene body was obtained using RSeQC.36
Quantitative reverse transcription PCR
Total RNA was extracted from cells using RNeasy Plus Mini Kit (QIAGEN) following the standard manual of the TRIzol method. In the reverse transcription (RT) of mRNAs, 1 μg of total RNAs were reverse transcribed using oligo(dT) primer and SuperScript IV Reverse Transcriptase (Invitrogen, #18080-093). In the RT of miRNAs, 50 ng of total RNAs were added to a specific stem-loop RT primer designed for each miRNA.37 cDNAs from the RT reactions for mRNA or miRNA were used to perform qPCR by iTaq Universal SYBR Green Supermix (Bio-Rad, #1725122). Glyceraldehyde-3-phosphate dehydrogenase and U6 were used as the internal control for mRNA and miRNA quantification, respectively. For regular mRNA transcripts, an equal amount of RNA from samples (∼200 ng) was reverse transcribed into cDNA using iScript Reverse Transcription Supermix, and qPCR was performed using a QuantStudio 5 Real-Time PCR System detection using primers together with SYBR green master mix (ABI systems). All reactions were run in triplicate in 3 independent experiments and amplified in a 10 μL reaction according to the manufacturer’s protocol. Primer sequences for RT and qPCR are shown in supplemental Table 6.
Dual-reporter assays
The DNA sequence coding for the 3′ UTR of DDX6 or RAB12 was inserted after the CDS of the firefly luciferase (FL) in pGL plasmid, generating pGL-FL-DDX6–wild-type (WT) or pGL-FL-RAB12-WT. The 7 nt binding sites of miR-148a-3 in the inserted 3′ UTR were mutated into AAAAAAA, producing pGL-FL-DDX6-mut or pGL-FL-RAB12-mut.
The 2 DNA sequences, long and short DNA fragments, coding for the 3′ UTR of TXNIP were amplified from the genomic DNA of K562 cells. The long DNA (1416 nt) contained the putative DDX6-binding sites. The long and short DNAs were also inserted after the CDS of the FL in the pGL plasmid, generating pGL-FL-TXNIP-DDX6 and pGL-FL-TXNIP-noDDX6. Primer sequences for pGL plasmid cloning and mutagenesis are shown in supplemental Table 7.
In the miRNA reporter assays, 200 pmol of miR-148a-3p mimics (or control miRNAs), 3 ng of Renilla luciferase (RL) plasmid (pGL-RL), and 50 ng of pGL-FL-DDX6-WT, pGL-FL-DDX6-mut, pGL-FL-RAB12-WT, or pGL-FL-RAD12-mut were cotransfected into the HEK293T cells. In the DDX6 reporter assays, 3 ng of pGL-RL, 20 ng pGL-FL-TXNIP-DDX6 or pGL-FL-TXNIP-noDDX6, and 90 ng of pXGR-DDX6 plasmid were used. The luciferase signals were measured 48 hours after the transfection using FlexStation 3 Multi-Mode Microplate Reader (Molecular Devices) as previously described.31
Immunoblot
200 000 cells were lysed in 40 μL 1× Laemmli protein loading buffer and boiled for 5 minutes. Whole-cell lysates were run on a 4% to 15% gradient agarose gel and transferred to a nitrocellulose membrane. Membranes were probed with antibodies against DDX6/RCK antibody (Cell Signaling, #9407), TXNIP (Abcam, #ab188865), and actin (Sigma, #A3854).
Flow cytometry
To monitor cellular differentiation status, cells were stained with the following antibodies: APC-CD11b (Thermo Fisher Scientific, #CD11b05) and PE-CD14 (eBioscience, #12-0149-42). To measure apoptosis, cells were washed with phosphate-buffered saline (PBS; Sigma) and incubated with APC-Annexin V (BD Biosciences, #550474) in the Annexin V binding–buffer in a reaction volume of 100 μL for 15 minutes, according to the manufacturer's instructions. 4′,6-diamidino-2-phenylindole was added before the analysis. For cell cycle analysis, samples were fixated in 3.7% formaldehyde in PBS for 30 minutes at RT. Cells were permeabilized in PBS/bovine serum albumin (1%)/Tween20 (0.025%) for 15 minutes at RT and harvested in PBS containing 10 μg/mL propidium iodide for DNA labeling.
To assess the engraftment of human leukemia cells in NRG-recipient mice, bone marrow cells collected from animals were treated with red blood cell lysis buffer before staining with 2 antibodies against human CD45 surface marker, that is, anti-hCD45–AF700 clone 2D1 (BioLegend, #368514) and anti-hCD45–PE clone H130 (eBioscience, #12-0459-42).
All flow cytometry samples were analyzed on a BD LSRFortessa Cell Analyzer.
Cell lines
The parental HCT116 and HCT116 DROSHA-KO cells were cultured in McCoyʼs 5A medium (Gibco, #16600082), supplemented with 10% fetal bovine serum (FBS) (Gibco, #10270106) and 1% of penicillin-streptomycin (Gibco, #15140122). Human leukemia cells MOLM13 (AML French-American-British classification [FAB] M5a; MLL-AF9 fusion, FLT3-ITD), NB4 (APL/FAB M3; PML-RARA fusion), OCI-AML3 (hyperdiploid karyotype with NPM1 mutation type A and DNMT3A R882C), Kasumi-1 [hypodiploid karyotype, t(8;21) and KIT mutation N822], KG-1 [hypodiploid karyotype, FGFR1OP2-FGFR1 (OP2-FGFR1) fusion gene], and MOLM-13-Cas9 cells (MOLM-13 cells engineered to constitutively express Cas9, which was a gift from the Kharas Laboratory at Memorial Sloan Kettering Cancer Center) were cultured in RPMI 1640 medium supplemented with 10% FBS, penicillin (100 units per mL), and streptomycin (100 units per mL). HEK293T cells were grown in Dulbecco’s modified Eagle medium medium with 10% FBS, penicillin (100 units per mL), and streptomycin (100 units per mL). The cells were incubated at 37°C in a humidified 5% CO2 incubator. All cell lines were purchased from ATCC and tested negative for mycoplasma contamination.
Lentivirus production
HEK293T cells were cultured in 15-cm plates and grown to 90% confluency before cell transfection. The lentiviral transfer vector DNA, together with psPAX2 packaging and pMD2.G envelope plasmid DNA was combined in a ratio of 4:3:1, respectively. A sterile 1-mL pipette was used to vigorously bubble air through the DNA mix, during which 1.5 mL 2× N-2-hydroxyethylpiperazine-N′-2-ethanesulfonic acid (HEPES)–buffered saline (280 mM NaCl, 50 mM HEPES, 1.5 mM Na2HPO4, and pH 7.0) was added dropwise into the precipitate. After the incubation of the solution at room temperature for 5 minutes, the solution was added dropwise to HEK293T cells. The plates were rocked gently in a circular motion to distribute the precipitates and then returned to the incubator at 5% CO2. Cells were replaced with fresh growth medium which was added 24 hours after transfection. The viral collection was performed at 48 and 72 hours after the transduction. The supernatants from the 2 harvests were passed through a 0.45 μm pore PVDF Millex-HV filter (Millipore) and stored in the freezer at −80 °C for subsequent uses.
Lentiviral transduction
MOLM-13 and NB4 cells were transduced with lentiviruses by spinfection (1400 RPM, 1 hour, 37°C) in RPMI with 10% FBS at the density of 500 000 cells per mL. Cells were counted using a hemocytometer. Twenty-four hours after the transduction, cells transduced with shRNAs targeting DDX6 (TRCN0000074693 and TRCN0000074695) or control scrambled shRNA (Addgene, #1864) were treated with 3 μg/mL puromycin for selection. MOLM13-Cas9 (constitutively expressing Cas9) was transduced with lentivirus pLKO5.sgRNA.EFS.GFP-expressing sgRNAs targeting DDX6 (sgRNA-1 and sgRNA-2) or control green fluorescent protein empty vector. Transduction efficiency of >90% green fluorescent protein positivity was achieved. In both the assays, 72 hours after transduction, cells were collected for all downstream phenotypic and functional evaluation.
Cell culture of CB-CD34+ HSPCs
CB-CD34+ cells were purified and provided by the hematology cell bank at BC Cancer Research Centre. CD34+ cells were expanded in media supplemented with Iscove modified Dulbecco medium 80%, BIT 9500 Serum Substitute for Cell Culture (Stemcell Technologies Cat # 09500) 20%, human stem cell factor (100 ng/mL), human thrombopoietin (100 ng/mL), human FLT3-ligand (100 ng/mL), and interleukin 6 (20 ng/mL). Cells were incubated at 37°C in humidified 5% CO2 incubator.
Viral transduction and proliferation assay of CB-CD34+ HSPCs
A total of 100 000 CD34+ cells were plated in culture media supplemented with cytokines and seeded in a 96-well plate. Cells were transduced with control shRNA-scramble and shRNAs targeting DDX5 by spinfection (1400 rpm, 1 hour, 37°C). Twenty-four hours after the transduction, transduced cells were treated with 1μg/mL puromycin. Forty-eight hours after puromycin selection, cells were plated at 200 000 cells per mL and followed for proliferation. Cells were counted at the indicated time points using a hemocytometer.
In vivo transplantation
We transplanted 0.5 × 10⁶ of the control and DDX6-depleted MOLM13 cells and 1 × 10⁶ NB4 cells into NRG mice (NOD-Rag1nullIL2rγnull) (purchased from BCCRC mouse facility). Female NRG-recipient mice were irradiated (800 cGy) 1 day before receiving the tail vein injection with transduced cells. We included mice with the same number of sexes and ages (8-10 weeks) in different groups for experiments. Mice were then followed up for disease development and euthanized when they reached humane end points. All the procedures were performed according to the University of British Columbia and British Columbia Cancer Research Centre Animal Protocols and Ethics.
Analysis of TCGA data sets
Raw RNA-seq counts for The Cancer Genome Atlas (TCGA)-LAML study38 were downloaded and normalized using the R packages TCGAbiolinks39 and edgeR,40 respectively.
To determine any significant differences in miR-148a or DDX6 expression between patients in the TCGA-LAML data set, 2 statistical approaches were used. When comparing patients between different cytogenetic subgroups, a 1-way analysis of variance test was used, with Tukey test used as the post hoc test. To determine differences between patients with CN-AML bearing different mutations, Mann-Whitney U test corrected for multiple comparisons with the Benjamini-Hochberg method41 was used. Patients with CN-AML with a specific mutation were compared against all other patients with CN-AML who lacked the said mutation, to assess if a gene was significantly deregulated.
To determine if miR-148a or DDX6 expression was associated with patient survival, patients were dichotomized into high- or low-expressing groups using cutoffs generated by the R package maximally selected rank statistics.42 Log-rank tests were then performed to determine differences in overall survival based on the gene expression. The R packages survival43 and survminer44 were used for statistical analysis and visualization.
Statistics
Except for the TCGA analysis, all data analysis and statistical tests were performed using GraphPad Prism or Microsoft Excel. Statistical tests performed and significance calculated are as indicated for each data set. In brief, to determine the significant changes between control vs perturbed conditions, which have a normal distribution (ie, control vs knockdown/knockout), 2-tailed unpaired Student t tests were performed. To determine the significance of survival differences between control vs perturbed conditions, a log-rank Mantel-Cox test was performed.
Results
Genome-wide identification of target mRNAs of miR-148a-3p using DROSHA-KO cell model
It has been demonstrated that the expression of miR-148a-3p is downregulated in AML, and high-risk patients with low miR-148a-3p have a lower rate of relapse-free survival.19 We independently analyzed an additional data set (GSE142700) of coexpression of miRNA and mRNA in patients with cytogenetically normal AML (CN-AML) and confirmed that miR-148a-3p is expressed at a decreased level in patients with CN-AML compared with healthy donors (supplemental Figure 1A). To further investigate the expression patterns of miR-148a-3p in AML, we analyzed the TCGA data sets and observed that miR-148a-3p is generally expressed at relatively similar levels among different AML cytogenetic subtypes as well as mutation-classified subgroups within CN-AML (supplemental Figure 1B-C). Interestingly, analysis of miR-148-3p expression in conjunction with the overall survival of patients with AML in the TCGA data set revealed a positive correlation between a reduced miR-148a-3p level and poorer prognosis in patients (Figure 1A). This trend was also observed when AML subgroups were further subdivided (Figure 1B-F; supplemental Figure 1D), with the most significant correlations observed in AML with complex karyotype and CN-AML carrying FLT3-ITD mutations. These data strongly indicated a biological relevance of miR-148a-3p in AML. Then, we validated that overexpression of miR-148a-3p slowed the growth of human MOLM13 leukemia cells (supplemental Figure 1E), further supporting the tumor-suppressive role of miR-148a-3p in the survival of AML cells.45 Given that only a few targets of miR-148a-3p have been reported so far,46,47 we set out to comprehensively identify miR-148a-3p targets to gain insights into its role in AML.
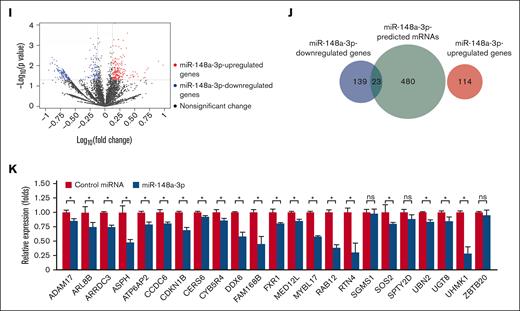
Genome-wide identification of target mRNAs of miR-148a-3p using DROSHA-KO cell model. Kaplan-Meier curves showing outcomes of patients with AML from the TCGA data set with high vs low expression of miR-148a-3p in all patients (n = 188) (A), patients with complex karyotype (n = 24) (B), normal karyotype (CN-AML) (n = 80) (C), patients with CN-AML with NPM1 mutations (n = 46) (D), patients with CN-AML with FLT-ITD mutations (n = 23) (E), and patients with CN-AML with DNMT3A mutations (n = 32) (F). P value was calculated by log-rank test. (G) The scheme of miR-148a-3p target identification. miR-148a-3p–downregulated targets were obtained from transcriptome analysis of the DROSHA-KO cells transfected with miR-148a-3p mimics. The miR-148a-3p predicted targets were the common predicted targets of miR-148a-3p using TargetScan48 and miRDB.49 The overlapping targets between miR-148a-3p–downregulated and miR-148a-3p–predicted targets were considered as putative miR-148a-3p targets. (H) Distribution of the sequencing reads across the genes. The gene body of each gene covering from its 5′ end to 3′ end was scaled from 0 to 100 percentile. Most reads were enriched at the 3′ UTR region of the genes. (I) Differential gene expression. The fold change in the gene expression of DROSHA-KO cells transfected miR-148a-3p and control miRNA was calculated using total read count as normalization factors. The miR-148a-3p upregulated and downregulated genes showed at least 1.3-fold changes and P < .05. Blue dots indicate downregulated genes; red dots, upregulated genes; and black dots, nonsignificant change. The overlapping genes between upregulated genes (red circle) or downregulated genes (blue circle) (J) and predicted targets of miR-148a-3p (green circle) (K). (L) Quantitative reverse transcription PCR was conducted for 23 overlapping targets found in HCT116 cells, and their relative expression was normalized against glyceraldehyde-3-phosphate dehydrogenase.
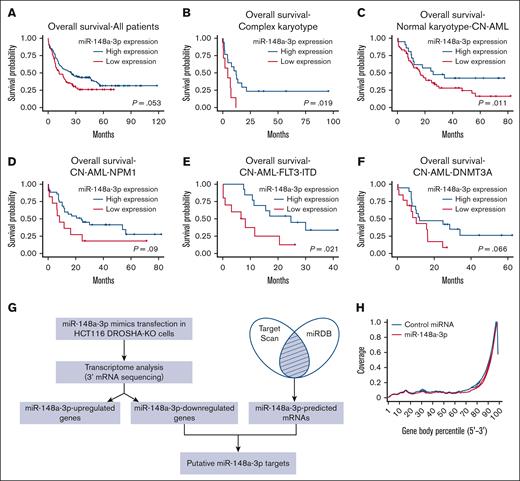
To systematically identify endogenous target mRNAs of miRNA, we used a DROSHA-knockout (KO) cell line of HCT116 (a colorectal cancer cell line), where we disabled DROSHA function to abolish miRNA biogenesis and expression. This system allowed for a clean background without DROSHA-dependent miRNA-mediated gene silencing, which resulted in the upregulation of miRNA-targeted mRNAs. Then, we transfected DROSHA-KO cells with a miRNA mimic and read out the consequences of miRNA's expression by measuring changes in the abundance of mRNAs. The method enabled an unbiased and genome-wide screening for potential targets of miRNAs. Transcripts that are downregulated in the presence of miRNA mimics are identified as putative miRNA targets. We conducted small RNA sequencing analysis for parental HCT116 cells and identified 10 highly expressing miRNAs, including miR-148a-3p (supplemental Figure 1F). Furthermore, analysis of small RNA sequencing profiles demonstrated that DROSHA-KO in HCT116 resulted in minimal detection of miR-148a-3p (supplemental Figure 1G).29 Next, we validated the overexpression of miR-148a-3p mimics in DROSHA-KO cells using quantitative polymerase chain reaction (qPCR) (supplemental Figure 1H) and performed RNA transcriptomic profiling to identify miR-148a-3p targets (Figure 1G). We analyzed the distribution of the mRNA sequencing (mRNA-seq) reads across the gene body and showed that most sequencing reads mapped to the 3′ untranslated region (UTR) of mRNAs (Figure 1H). This indicated that the mRNA-seq was conducted properly because the Collibri 3′ mRNA Library Prep Kit was designed for sequencing the 3′ end region of mRNAs in proximity to their poly-A tail. In addition, the results from 3 repeats of mRNA-seq were highly reproducible (supplemental Figure 1I).
From these analyses, we identified 114 and 162 upregulated and downregulated mRNAs, respectively, in the DROSHA-KO cells on transfection with miR-148a-3p mimics (supplemental Table 1; Figure 1I). Next, we used TargetScan48 and miRDB49 to obtain 503 predicted target mRNAs of miR-148a-3p (miR-148a-3p–predicted mRNAs), which were scored by both programs (supplemental Table 2). Subsequently, we overlapped the altered transcripts and the predicted mRNAs to identify 23 putative target mRNAs, which were found to be miR-148a-3p–predicted and miR-148a-3p–downregulated mRNAs (Figure 1J; supplemental Table 3). In contrast, the miR-148a-3p–predicted and miR-148a-3p–upregulated mRNAs did not share any genes in common (Figure 1J). Among 23 miR-148a-3p candidate targets, 7 genes, that is, ADAM17,50 ATP6AP2,51 CDKN1B,52 MYBL1,53 RAB12,54 SOS2,55,56 and UHMK157 were previously verified. By using quantitative reverse transcription PCR, we further validated the reduction of 20 out of 23 putative targets on miR-148a-3p overexpression (Figure 1K). Overall, our approach was rigorous and experimentally nominated previously unidentified miR-148a-3p mRNA targets.
miR-148a-3p targets DDX6 in leukemia cells
Among the newly identified miR-148a-3p targets, we were interested in RNA helicase DDX6 owing to its involvement in posttranscriptional gene regulation. DDX6 has been shown to interact with the internal ribosomal entry site and 5′ cap structure binding protein eIF4E to modulate translation.58-60 DDX6 is also known to be recruited by the RNA-induced silencing complex to facilitate miRNA-mediated gene silencing.61 To further validate that DDX6 is a direct target of miR-148a-3p, we inserted the 3′ UTR region of DDX6 downstream of the FL coding sequence (CDS) in the reporter plasmid to generate the pGL-FL-DDX6–WT construct (Figure 2A; supplemental Figure 2). We used RAB12, a previously characterized target of miR-148a-3p,53 as the control and created pGL-FL-RAB12-WT plasmid. To confirm that the effects are mediated through miR-148a-3p binding, we mutated the binding site of miR-148a-3p in DDX6 and RAB12's 3′ UTR region in the mutated pGL-FL-DDX6 (pGL-FL-DDX6-mut) and pGL-FL-RAB12-mut constructs. The results of the reporter assays demonstrated that miR-148a-3p reduced the expression of FL from both the pGL-FL-DDX6-WT and pGL-FL-RAB12-WT plasmids (Figure 2B). Importantly, we observed that the mutation of the binding sites reversed the effects of miR-148a-3p on the FL expression (Figure 2B). These results strongly indicated that miR-148a-3p directly binds to the 3′ UTR region in the DDX6 transcript and diminishes its expression. To confirm the regulation of DDX6 gene expression by miR-148a-3p in leukemia cells, we cloned the primary transcript encoding miR-148a-3p into a lentiviral backbone to overexpress miR-148a-3p in MOLM13 leukemia cells (Figure 2C). We observed that miR-148a-3p overexpression significantly downregulated DDX6 mRNA and protein expression levels (Figure 2D-E). Taken together, these data strongly indicated that DDX6 is a relevant target of miR-148a-3p in AML.

miR-148a-3p targets DDX6 in leukemia cells. (A) The WT 3′ UTR (ie, contains the binding site of miR-148a-3p) or mutated 3′ UTR-mut (ie, includes the mutated binding site of miR-148a-3p) of DDX6 or RAB12 was inserted downstream of the FL CDS in the reporter plasmid, pGL-FL. (B) Dual-luciferase reporter assays were conducted for DDX6 and RAB12. The FL signal was normalized against the Renilla luciferase signal. (C) miR-148a-3p overexpression in MOLM3 cells (miR148a-3p OV MOLM13). The expression of miR-148a-3p was calculated by qPCR and normalized against U6. (D) qPCR showing reduction of DDX6 mRNA in miR148a-3p OV MOLM13. DDX6 mRNA abundance was calculated by qPCR and normalized against glyceraldehyde-3-phosphate dehydrogenase. (E) Western blot showing a decrease in DDX6 protein in miR148a-3p OV MOLM13. CMV, cytomegalovirus; EV, empty vector.
miR-148a-3p targets DDX6 in leukemia cells. (A) The WT 3′ UTR (ie, contains the binding site of miR-148a-3p) or mutated 3′ UTR-mut (ie, includes the mutated binding site of miR-148a-3p) of DDX6 or RAB12 was inserted downstream of the FL CDS in the reporter plasmid, pGL-FL. (B) Dual-luciferase reporter assays were conducted for DDX6 and RAB12. The FL signal was normalized against the Renilla luciferase signal. (C) miR-148a-3p overexpression in MOLM3 cells (miR148a-3p OV MOLM13). The expression of miR-148a-3p was calculated by qPCR and normalized against U6. (D) qPCR showing reduction of DDX6 mRNA in miR148a-3p OV MOLM13. DDX6 mRNA abundance was calculated by qPCR and normalized against glyceraldehyde-3-phosphate dehydrogenase. (E) Western blot showing a decrease in DDX6 protein in miR148a-3p OV MOLM13. CMV, cytomegalovirus; EV, empty vector.
DDX6 expression is elevated in patients with AML and correlated with poor prognosis
To further investigate the relevance of DDX6 in various types of cancers and AML, we surveyed the expression of DDX6 across different cancer types in the TCGA data sets. We noticed that the DDX6 mRNA expression in AML was significantly higher than in other cancer types, suggesting a role of DDX6 in the pathogenesis of the diseases (supplemental Figure 3A). Data from the MILE leukemia cohort62 showed that DDX6 expression is elevated in primary patient samples, particularly within the t(8;12), t(15,17), and AML (with complex karyotype) subgroups (Figure 3A). Importantly, DDX6 expression in the GSE42519 data set63 was found to be upregulated in leukemia blasts isolated from patients with AML compared with the closest normal counterparts across diverse genetic subtypes (Figure 3B). In addition, we surveyed the TCGA data sets to evaluate DDX6 expression across different AML subtypes and did not observe any significant deregulation among cytogenetic subtypes or molecular subgroups among patients with CN-AML (Figure 3C-D). The analysis of survival correlation in the full patient cohort showed that a higher expression of DDX6 in patients with AML tends to be correlated with lower survival rates (Figure 3E). The trend held up in the complex karyotype subgroup (Figure 3F). However, we saw a strong association of elevated DDX6 expression with poor survival within a small cohort of patients with rearranged mixed lineage leukemia (MLL) (n = 8) (supplemental Figure 3B). Interestingly, we observed a correlation between higher DDX6 expression and worse prognosis in patients with CN-AML (Figure 3G-J; supplemental Figure 3C). Further analysis revealed a significant correlation between high DDX6 expression and less favorable prognosis in patients with CN-AML carrying NPM1 mutations (Figure 3H). Taken together, these data suggested the involvement of DDX6 in the pathogenesis of AML.

DDX6 expression is elevated in patients with AML. (A) DDX6 mRNA expression across different cytogenetic subgroups of AML. Data from MILE study.62 Data are presented as mean log2 expression with range. ∗P < .05, ∗∗P < .01; Student t test. (B) DDX6 mRNA expression across different cytogenetic subgroups of AML.63 Data are presented as mean log2 expression with range. ∗P < .05, ∗∗P < .01, ∗∗∗P < .001, and ∗∗∗∗P < .00001; unpaired Student t test. DDX6 mRNA expression from TCGA data sets across different cytogenetic subgroups of AML (C) and normal karyotype patients with CN-AML bearing different mutations (D). Data are presented as mean log2 expression with range. Unpaired Student t test. Kaplan-Meier curves showing the outcomes of patients with AML from the TCGA data set with high vs low expression of DDX6 in all patients (n = 150) (E), patients with complex karyotype (n = 18) (F), normal karyotype (CN-AML) (n = 60) (G), patients with CN-AML with NPM1 mutations (n = 33) (H), patients with CN-AML with FLT-ITD mutations (n = 18) (I), and patients with CN-AML with DNMT3A mutations (n = 24) (J). P value was calculated by log-rank test. inv, inverted; ns, not significant.
DDX6 expression is elevated in patients with AML. (A) DDX6 mRNA expression across different cytogenetic subgroups of AML. Data from MILE study.62 Data are presented as mean log2 expression with range. ∗P < .05, ∗∗P < .01; Student t test. (B) DDX6 mRNA expression across different cytogenetic subgroups of AML.63 Data are presented as mean log2 expression with range. ∗P < .05, ∗∗P < .01, ∗∗∗P < .001, and ∗∗∗∗P < .00001; unpaired Student t test. DDX6 mRNA expression from TCGA data sets across different cytogenetic subgroups of AML (C) and normal karyotype patients with CN-AML bearing different mutations (D). Data are presented as mean log2 expression with range. Unpaired Student t test. Kaplan-Meier curves showing the outcomes of patients with AML from the TCGA data set with high vs low expression of DDX6 in all patients (n = 150) (E), patients with complex karyotype (n = 18) (F), normal karyotype (CN-AML) (n = 60) (G), patients with CN-AML with NPM1 mutations (n = 33) (H), patients with CN-AML with FLT-ITD mutations (n = 18) (I), and patients with CN-AML with DNMT3A mutations (n = 24) (J). P value was calculated by log-rank test. inv, inverted; ns, not significant.
DDX6 is required for the survival of AML cells
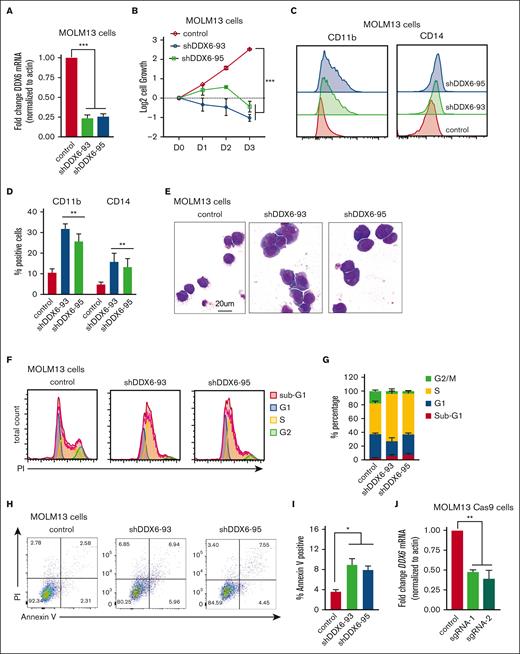
To directly evaluate the functional requirement of DDX6 in human leukemia cells, we knocked down DDX6 using 2 independent short hairpin RNAs (shRNAs) (shDDX6-93 and shDDX6-95). Given that t (15;17) is the cytogenetic group showing the most elevated DDX6 expression (Figure 3A-B) and there is a strong correlation between high DDX6 expression and more aggressive diseases in the MLL-rearranged group (supplemental Figure 3B), we first chose MOLM13, an AML cell line carrying MLL-AF9 fusion proteins and NB4, a t(15;17) APL cell line, to evaluate the impact of DDX6 depletion. An efficient knockdown of DDX6 was consistently obtained with both shRNAs (Figure 4A; supplemental Figure 4A-B). The depletion of DDX6 strongly suppressed the cell growth of MOLM13 (Figure 4B) and NB4 (supplemental Figure 4C) cells. The knockdown of DDX6 also resulted in the induction of myeloid differentiation as evidenced by a significant increase in the percentage of cells expressing myeloid surface markers, such as CD11b and CD14 (Figure 4C-D) in NB4 cells (supplemental Figure 4D). The push in differentiation on DDX6 knockdown was also observed through the changes in the morphology of leukemia cells as DDX6-depleted cells exhibited an increase in the cytoplasm to nuclear ratio and adoption of the lobulated nucleus, a feature of differentiated myeloid cells (Figure 4E). Moreover, we examined the impact of DDX6 in the cell cycle and found an accumulation of cells arrested in the S phase on DDX6 ablation, resulting in a reduced percentage of cells cycling in G1 and G2/M in both MOLM13 (Figure 4F-G; supplemental Figure 4G) and NB4 (supplemental Figure 4E). The cell cycle defects were coupled with an increase in apoptosis in DDX6-depleted MOLM13 (Figure 4H-I) and NB4 leukemia cells (supplemental Figure 4F). To determine whether the phenotypes are also relevant in other AML subtypes, we performed DDX6 knockdown using 3 additional AML cell lines with distinct genetic backgrounds, that is, OCI-AML3 (hyperdiploid karyotype with NPM1 mutation type A and DNMT3A R882C), KASUMI-1 [hypodiploid karyotype, t(8;21) and KIT mutation N822], and KG-1 (hypodiploid karyotype, FGFR1OP2-FGFR1 [OP2-FGFR1] fusion gene). We observed that DDX6 depletion also inhibited cell growth significantly and induced apoptosis in these cell lines (supplemental Figure 4H-P). These data strongly support that DDX6 is required for the survival and proliferation of AML cells.
DDX6 is required to maintain myeloid leukemia survival in vitro and in vivo. (A) qPCR analysis showing the efficient knockdown of DDX6 using 2 independent shRNAs vs control-scramble shRNA in MOLM13 cells. MOLM-13 cells were transduced with lentiviruses expressing either a scramble (control) shRNA or DDX6-targeting shRNAs (shDDX6-93 and shDDX6-95). Cells were selected for puromycin resistance and assayed 3 days after the transduction. (B) The proliferation of MOLM13 cells described in panel A over 3 days, beginning on day 3 after the transduction (day 0); n = 3 independent experiments; ∗∗∗P < .001; 2-tailed unpaired Student t test. (C) Representative flow plots showing the increased presence of CD11b and CD14 high populations upon DDX6 knockdown by shDDX6-93 and shDDX6-95 in MOLM13 cells. (D) A quantitative summary of the flow results shown in panel C. (E) A representative Giemsa staining demonstrating the morphological changes observed in MOLM13 cells on DDX6 knockdown by shDDX6-93 and shDDX6-95 shown in panel A. (F) Representative flow plots showing cell cycle profiles of control vs DDX6-depleted MOLM13 cells. (G) A quantitative summary of the cell cycle profiling of MOLM13 cells shown in panel F. (H) Representative flow plots showing apoptotic analysis using propidium iodide and Annexin V staining of control vs DDX6 depleted MOLM13 cells. (I) A quantitative summary of the apoptotic analysis of MOLM13 cells shown in panel H. (J) qPCR analysis showing knockout of DDX6 in the bulk population using 2 independent sgRNAs vs control empty vectors in MOLM13-constitutively expressing Cas9 (MOLM13-Cas9) cells. MOLM13-Cas9 cells transduced with sgRNAs against DDX6 and control vector were sorted based on green fluorescent protein positivity and assayed at 3 days after the transduction for proliferation (K), at 4 days after the transduction for myeloid differentiation (L), and cell cycle (M). (N) The proliferation of CB-CD34+ HSPCs transduced with lentiviruses expressing either a scramble (control) shRNA or DDX6-targeting shRNAs (shDDX6-93 and shDDX6-95). (O) Apoptotic analysis of CD34+ HSPCs on DDX6 depletion 72 hours and 96 hours after the virus transduction. (P) Scheme of experimental design for in vivo leukemia assessment. (Q) Representative flow plots showing the presence of engrafted human leukemia cells, (double positive for 2 antihuman CD45 antibodies) in recipient mice transplanted with MOLM13 carrying control vs shDDX6-3 and shDDX6-95. (R) A quantitative summary of the flow results shown in panel Q. (S) Overall survival of sublethally irradiated mice transplanted with MOLM-13 cells on day 4 after the transduction (n = 8 mice per group). ∗P < .05, ∗∗P < .01; Mantel-Cox test. All bar graphs showing data as mean ± standard error of the mean; n = 3 independent experiments; ∗P < .05, ∗∗P < .01, ∗∗∗P < .001; 2-tailed unpaired Student t test. BM, bone marrow.
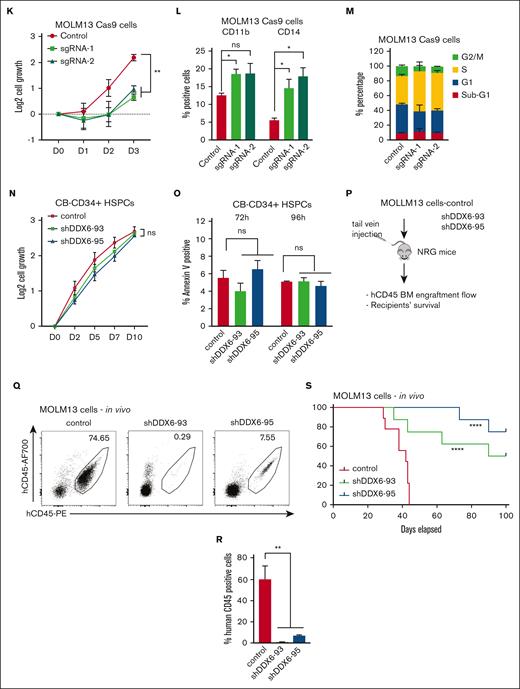
To support the findings using the RNA interference approach, we used CRISPR/Cas9 as an orthogonal method to evaluate the effects of DDX6 loss-of-function in leukemia cells. We generated 2 independent lentiviral backbones carrying single-guide RNAs (sgRNAs) (sgRNA-1 and sgRNA-2) to target DDX6 in MOLM13-constitutively expressing Cas9. We obtained ∼50% to 60% depletion efficiency in the bulk population of transduced cells (Figure 4J). Similar to the shRNA-mediated knockdown of DDX6, we observed that DDX6 depletion by sgRNAs inhibited leukemia cell growth (Figure 4K), induced myeloid differentiation (Figure 4L), and cell cycle arrest (Figure 4M; supplemental Figure 4Q). These data further validated a functional requirement of DDX6 in AML.
Next, we evaluated whether there is a differential requirement for DDX6 function in leukemia cells vs normal hematopoietic stem/progenitor cells (HSPCs). We efficiently depleted DDX6 expression in cord blood–derived CD34+ (CB-CD34+) HSPCs using the 2 shRNAs, that is, shDDX6-93 and shDDX6-95 (supplemental Figure 4R), and followed the proliferation and survival of the cells. In contrast to the strong inhibition of growth observed in AML cell lines, the loss of DDX6 function did not attenuate the proliferation of CB-CD34+ cells in liquid culture (Figure 4N). We also observed no induction of apoptosis in HSPCs at either early time points (72 and 96 hours after viral transduction) (Figure 4O), when an increase in apoptotic activity in leukemia cells was observed, or at later time points (4 and 7 days after plating in liquid culture). Cells were plated in culture 72 hours after viral transduction (supplemental Figure 4S). The results demonstrated that DDX6 is dispensable for the survival of normal HSPCs and therefore could represent a leukemia-specific vulnerability.
Finally, to establish the requirement for DDX6 function in leukemia development in vivo, we transplanted MOLM13 cells transduced with control or shDDX6-93 and shDDX6-95 into immunodeficient NOD-Rag1null IL2rgnull (NRG) mice (Figure 4P). When recipient mice from the control group showed signs of distress and moribundity, we collected bone marrow samples from 3 experimental groups and evaluated disease burden based on the presence of engrafted human CD45+ leukemia cells. Knockdown of DDX6 resulted in a large decrease in the percentage of transplanted leukemia cells (Figure 4Q-R). Similar effects were observed with transplanted controls vs DDX6-depleted NB4 cells (supplemental Figure 4T-U). Most importantly, we demonstrated that DDX6 depletion delayed leukemia progression in vivo (Figure 4S). Taken together, these data strongly indicated a functional requirement of DDX6 in promoting the survival of leukemia cells in vitro and in vivo.
DDX6 represses tumor suppressor thioredoxin-interacting protein (TXNIP) in AML cells
Given the requirement of DDX6 for the survival of AML cells (Figure 4), we reasoned that DDX6 might suppress the expression of tumor suppressor genes important for the viability and growth of AML cells. To identify the relevant targets of DDX6, we analyzed the DDX6 enhanced crosslinking immunoprecipitation sequencing data conducted on K562 and HepG2 by ENCODE.64 We generated a list of DDX6-direct interacting mRNAs in K562 and HepG2 (supplemental Table 4). Gene set enrichment analysis using Enricher for DDX6 targets in K562 revealed the involvement of DDX6 downstream targets in the regulation of G2/M cell cycle transition, ubiquitin activity, mRNA stability, and cell differentiation (supplemental Figure 5A). Next, we evaluated the ENCODE-deposited transcriptomic profiles of both K562 and HepG2 on shRNA-mediated knockdown of DDX664 (supplemental Table 5). We overlapped DDX6-direct binding mRNAs with genes whose expression is upregulated on DDX6 depletion in both cell lines and obtained a list of 14 putative DDX6-direct target mRNAs (Figure 5A).

DDX6 represses tumor suppressor TXNIP in AML cells. (A) Fourteen DDX6 targeting candidates were identified by overlapping DDX6-upregulated mRNAs and DDX6-bound mRNAs found in K562 and HepG2 cells. The enhanced crosslinking immunoprecipitation of DDX6 conducted for K562 and HepG2 cells were obtained from ENCODE (accession numbers ENCSR141OIM and ENCSR893EFU). The transcriptomics data of K562 and HepG2, transfected with shDDX6, were also received from ENCODE (accession numbers ENCSR147ZBD and ENCSR119QWQ). (B) An increased expression of TXNIP mRNA in HepG2 and K562 cells after the DDX6 knockdown from the transcriptomics analysis in panel A. (C) Immunoblots showing the upregulated protein level of TXNIP after the DDX6 knockdown in MOLM13 cells. (D) Quantification of western blot data shown in panel C. The bar graph showing data as mean ± standard error of the mean; n = 5 independent experiments; ∗P < .05, ∗∗P < .01, ∗∗∗P < .001; 2-tailed Student t test. (E) The binding peaks of DDX6 in TXNIP mRNA transcript found in enhanced crosslinking immunoprecipitation of DDX6 conducted in K562 (accession number ENCSR141OIM). (F) The 3′ UTR region of TXNIP containing 3 DDX6 binding sites was inserted downstream of the FL CDS in the reporter plasmid, pGL-FL, generating pGL-FL-TXNIP-DDX6. In the pGL-FL-TXNIP-noDDX6 construct, 3 DDX6 binding sites were removed. Dual-luciferase reporter assays were conducted for TXNIP using HEK293T cells without (G) or with DDX6 overexpression (H). (I) A proposed model illustrating a functional link between miR-148a-3p and DDX6 in promoting the survival of myeloid leukemia cells.
DDX6 represses tumor suppressor TXNIP in AML cells. (A) Fourteen DDX6 targeting candidates were identified by overlapping DDX6-upregulated mRNAs and DDX6-bound mRNAs found in K562 and HepG2 cells. The enhanced crosslinking immunoprecipitation of DDX6 conducted for K562 and HepG2 cells were obtained from ENCODE (accession numbers ENCSR141OIM and ENCSR893EFU). The transcriptomics data of K562 and HepG2, transfected with shDDX6, were also received from ENCODE (accession numbers ENCSR147ZBD and ENCSR119QWQ). (B) An increased expression of TXNIP mRNA in HepG2 and K562 cells after the DDX6 knockdown from the transcriptomics analysis in panel A. (C) Immunoblots showing the upregulated protein level of TXNIP after the DDX6 knockdown in MOLM13 cells. (D) Quantification of western blot data shown in panel C. The bar graph showing data as mean ± standard error of the mean; n = 5 independent experiments; ∗P < .05, ∗∗P < .01, ∗∗∗P < .001; 2-tailed Student t test. (E) The binding peaks of DDX6 in TXNIP mRNA transcript found in enhanced crosslinking immunoprecipitation of DDX6 conducted in K562 (accession number ENCSR141OIM). (F) The 3′ UTR region of TXNIP containing 3 DDX6 binding sites was inserted downstream of the FL CDS in the reporter plasmid, pGL-FL, generating pGL-FL-TXNIP-DDX6. In the pGL-FL-TXNIP-noDDX6 construct, 3 DDX6 binding sites were removed. Dual-luciferase reporter assays were conducted for TXNIP using HEK293T cells without (G) or with DDX6 overexpression (H). (I) A proposed model illustrating a functional link between miR-148a-3p and DDX6 in promoting the survival of myeloid leukemia cells.
Among the identified DDX6 targets, TXNIP is a well-known tumor suppressor in several solid tumors, for example, breast cancer, liver cancer, prostate cancer, and AML.65 Overexpression of TXNIP has been shown to induce growth arrest and leukemia cell death. We found that DDX6 knockdown led to the upregulation of TXNIP in both HepG2 and K562 cells (Figure 5B). An increased TXNIP expression was also observed in human DDX6-depleted induced pluripotent stem cells (supplemental Figure 5B).28 Importantly, we validated that knockdown of DDX6 significantly increased TXNIP protein expression across all tested leukemia cell lines, including MOLM13 (Figure 5C-D), OCI-AML3, KASUMI-1, KG-1 (supplemental Figure 5C-E, respectively), and also in sgRNA-mediated DDX6-depleted MOLM13 Cas9 (supplemental Figure 5F). Finally, to examine if DDX6 directly regulates the expression of TXNIP via binding to its 3′ UTR, we inserted the TXNIP 3′-UTR-WT or its truncated version, which has the DDX6 binding sites removed, in the luciferase reporter plasmids (Figure 5E-F). We demonstrated that the deletion of DDX6 binding sites on TXNIP 3′ UTR mildly but reproducibly increased the reporter gene expression (Figure 5G). In addition, the overexpression of DDX6 further enhanced the difference in the expression of 3′-UTR-WT– and 3′-UTR-mut–containing reporter genes, indicating that DDX6 regulates the expression of TXNIP via interaction with its 3′ UTR (Figure 5H). Overall, these data strongly support TXNIP as the direct target mediating DDX6 function in AML cells.
Discussion
Our study identified several previously uncharacterized targets of miR-148a-3p using a genome-wide and unbiased approach. In human cells, a miRNA often targets multiple mRNAs and silences their expression. In addition, an mRNA is usually targeted by many miRNAs. Thus, the overexpression or knockdown of a miRNA frequently causes moderate changes in its target mRNA expression levels, making it challenging to discover relevant targets. Here, using DROSHA-KO cells allowed us to better dissect the effects of the overexpression of miRNA mimic. We demonstrated that the system reliably uncovers miR-148a-3p–targeted transcripts. A similar approach can be implemented to study other miRNAs in different cell contexts.
The abnormal expression of miR-148a-3p was observed in various types of cancer.30 In breast cancer, a lower expression of miR-148a-3p was observed in tumor tissues and was linked to a higher rate of lymph node metastasis.66 Furthermore, miR-148a-3p also helps in preventing the immune invasion of breast cancer via targeting HLA-G.67 In contrast, high levels of circulating miR-148a-3p were significantly associated with tumor size and distant metastasis as well as indicated a poor overall survival rate in patients with osteosarcoma.68 Given the important role of miR-148a-3p in many biological processes, the function of miR-148a-3p targets is likely relevant not only in AML but also in other tumor types. Future studies will determine whether additional miR-148a-3p downstream transcripts also contribute to the pathogenesis of AML.
In this study, we uncovered a miR-148a-3p/DDX6/TXNIP functional axis important for the survival of AML cells (Figure 5I). We demonstrated that in AML, attenuated expression of miR-148a-3p increases DDX6, which in turn suppresses the expression of tumor suppressor, TXNIP. The depletion of DDX6 compromised the survival of AML cells both in vitro and in vivo. In contrast to B-cell lymphoma,22 DDX6 functions as an oncogene in the context of AML. We observed the highest expression level of DDX6 mRNA in AML in comparison with all other cancer types. On one hand, elevated DDX6 expression was found in 2 independent patient cohorts, strongly supporting its role in promoting the progression of the disease, on the other hand, there is minimum impact on the survival of normal HSPCs on ablation of DDX6, indicating a leukemia-specific dependency of this functional axis. With the advent of several new exciting technologies, including nucleic acids–based technologies, the therapeutic approaches to the target gene and protein function are readily expanded. Small molecule inhibitors of RNA helicases such as DDX3X69 and eIF4F70 have been developed and are shown to have specific activities to selected helicases. Hence, it is possible to screen and identify compounds selectively inhibiting DDX6 enzymatic activity. Other potential methods to suppress DDX6 function in AML include RNA interference–mediated knockdown of DDX6 expression and the development of aptamers obstructing the interaction of DDX6 with its mRNA targets. In addition, DDX6 protein can potentially be modulated directly with targeted protein degrader drugs. The differential expression and functional requirement of DDX6 in leukemia vs normal cells point to a therapeutic window to effectively target DDX6 activity as a vulnerability in leukemia cells.
Acknowledgments
The authors thank Narry V. Kim (Seoul National University, Korea) for sharing DROSHA-knockout cells and the original reporter plasmids. The authors thank G. Edin and the staff of the British Columbia Cancer Centre Flow core and Animal Research Centre for their technical assistance. The authors are grateful to their lab members, especially Shaohua Li, for their discussion and technical assistance. The results shown here are in part based upon data generated by the The Cancer Genome Atlas Research Network.
This work was in part funded by the British Columbia Cancer Centre startup fund and the Croucher Foundation (CIA17SC03).
L.P.V. is the scholar of the American Society of Hematology. C.T.L. is the recipient of the Hong Kong PhD fellowship.
Authorship
Contribution: C.T.L. designed and performed target identification and verification using DROSHA-knockout and HEK293T cells, collected and analyzed the published omics data, and wrote the manuscript; M.G. designed, performed, and analyzed functional assessments in leukemia cells and wrote the manuscript; L.E. and A.R. performed the analysis of the Cancer Genome Atlas data sets; H.S. performed experiments to support the functional evaluation in leukemia cells; M.Y. performed the cloning and validation of short hairpin RNAs and single-guide RNAs; A.A. assisted with data acquisition and in vivo transplantation experiments; and T.A.N. and L.P.V. supervised and analyzed the data and wrote the manuscript.
Conflict-of-interest disclosure: The authors declare no competing financial interests.
Correspondence: Ly P. Vu, Faculty of Pharmaceutical Sciences, The University of British Columbia, Vancouver, BC, V6T IZ3, Canada; e-mail: lvu@bccrc.ca; and Tuan Anh Nguyen, Division of Life Science, The Hong Kong University of Science and Technology; e-mail: tuananh@ust.hk.

