

TO THE EDITOR:
SIRT6 is a NAD+-consuming deacetylase with different abilities, including genomic stability and chromatin accessibility regulation.1 Importantly, it plays a controversial role in cancer, acting as a tumor suppressor or oncogene depending on the tumors.2 Such a pleiotropic effect gave rise to extensive efforts to understand the cellular mechanisms by which SIRT6 upsets each cancer specifically.3-11 We previously reported that multiple myeloma (MM) cells exhibit high levels of SIRT6 in response to their genomic instability. Indeed, SIRT6, by downregulating the expression of extracellular signal-regulated kinase signaling–related genes, suppresses ETS-domain transcription factor (ELK1) activity and increases DNA repair levels via Chk1, resulting in DNA-damaging agents’ resistance.12 Here, we investigated the role of SIRT6 in MM by focusing on its relationship with the splicing machinery.
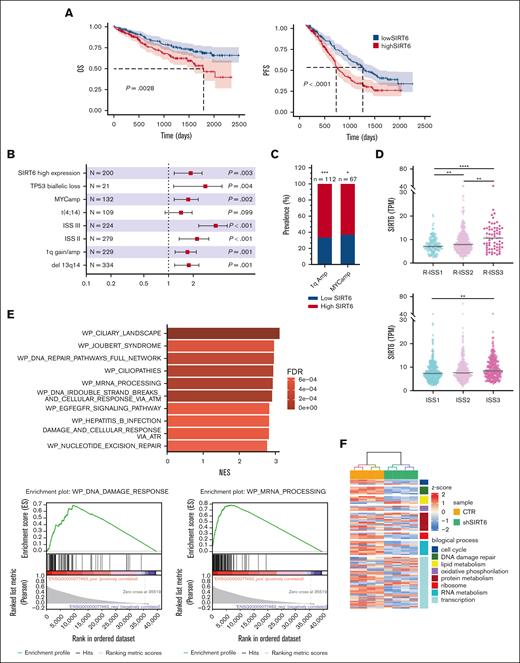
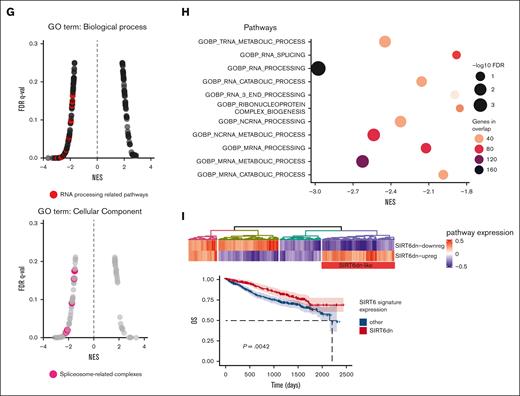
We initially confirmed the impact of SIRT6 on the survival of patients with MM using the large-scale cohort of the Multiple Myeloma Research Foundation CoMMpass data set (n = 797) and dividing patients according to gene expression levels (top vs bottom quartile): higher levels were associated with poor outcomes in both progression-free survival (hazard ratio [HR], 1.73; 95% confidence interval [CI], 1.32-2.28; P < .0001) and overall survival (OS) (HR, 1.78; 95% CI, 1.22-2.6; P = .0028). (Figure 1A). A univariate Cox-model analysis confirmed that patients with MM in SIRT6 highest quartile had significantly worse OS (P = .003), similar to those with major cytogenetic and clinical risk factors such as c-Myc amplification (c-MYC amp) (P = .002), TP53 biallelic loss (P = .004), 13q/RB1 deletion (P = .001), 1q gain/amp (P = .001), and International Staging System (ISS) stage 3 (P < .001). (Figure 1B). Main prevalence of high SIRT6 expressors was found among patients with MM with c-MYC amp, 1qAmp, and high risk defined by the ISS and revised ISS (R-ISS) as well. (Figure 1C-D) Overall, we identified a group of patients with MM with higher SIRT6 expression, characterized by more aggressive disease and poor outcome. To identify biological features associated with SIRT6 expression, we carried out a gene set enrichment analysis with the WikiPathways gene set by comparing the highest and lowest SIRT6 expression quartiles. As shown in Figure 1E, beyond the already reported DNA damage response, pathways associated with RNA biology, RNA processing, and splicing processes were positively correlated to SIRT6 expression, suggesting that SIRT6 is engaged with greater DNA and RNA instability. To gain insights into specific role played by this chromatin remodeler on RNA processing dysregulation, we performed a transcriptome microarray profiling of MM cells (NCI-H929 and MM1.S) with short hairpin RNA–mediated SIRT6 silencing compared with a nonsilencing shRNA (Figure 1F). Among the most significant deregulated events compared with control, DNA damage and RNA metabolism stand out as downregulated biological processes, with a strong negative enrichment of RNA processing pathways and cellular components of spliceosome machinery, according to Gene Ontology terms annotation (Figure 1G-H). To support the translational relevance of these data, transcriptome changes derived from SIRT6 knockdown were validated among patients with MM included in the Multiple Myeloma Research Foundation CoMMpass data set: patients with higher signature enrichment had a prognostic advantage than those with lower levels, in terms of OS (HR, 0.65; 95% CI, 0.48-0.87; P = .0042) but not in progression-free survival (HR, 0.86; 95% CI, 0.71-1.05; P = .14) (Figure 1I; supplemental Figure 1). Collectively, these data confirm the clinical significance of SIRT6 in MM and show that gene sets associated with RNA biology, RNA processing, and splicing pathways are enriched in SIRT6-depleted cells.
SIRT6 expression levels affect clinical outcome of patients with MM and affect RNA editing processes. (A) Kaplan-Meier survival curves of high (red) and low (blue) SIRT6-expressing patients with MM of the CoMMpass cohort, corresponding to the top and bottom quartile, respectively, on OS (left) and progression-free survival (right) data. Log-rank test P value in each group is reported. (B) Forest plot based on Cox univariate analysis for OS. Squares represent HRs; bars represent 95% CI. (C) Bar graph showing the prevalence of primary patient samples, included in the CoMMpass with 1qAmp and Myc Amp displaying high vs low SIRT6 level. The P value was calculated by performing a logistic regression using a maximum likelihood estimation. ∗P < .05; ∗∗∗P < .001. (D) Scatter plot displaying SIRT6 expression level, according to R-ISS (top) and ISS (bottom) status of the analyzed patients with MM. The P value was calculated using unpaired t test. (E) The top 10 most enriched WikiPathways, resulting from a gene set enrichment analysis (GSEA) on patients with MM included in the CoMMpass study by performing a Pearson correlation with SIRT6 expression (TPM); examples of GSEA-derived enrichment plots for genes involved in the DNA repair and RNA processing (right). (F) Heatmap of the significant differentially expressed genes in SIRT6 knockdown compared with scramble control MM cells. Each column presents data from scramble or SIRT6-depleted cells, and each row represents a gene. Gene expression is shown by pseudo color scale (−2 to 2), with red denoting high and blue denoting low expression level of a gene. (G) GSEA NES and FDR q values for downregulated pathways, according to Gene Ontology gene set and clustered by biological process (right) and cellular component (left) among deregulated genes in SIRT6-depleted cells; red points indicate splicing-related pathways accumulation. (H) Bubble plot shows the NES of the most significant GO-BP terms related to the RNA processing, enriched in SIRT6-depleted cells compared with control; size and colors represents log10 FDR and the genes in overlap between the microarray and the gene sets, respectively. (I) Heatmap showing SIRT6-KD signature expression in newly diagnosed patients with MM derived from CoMMpass data set: group of patients with gene expression in accordance with SIRT6 silencing is highlighted in the red rectangle (SIRT6dn-like). Lower panel shows Kaplan-Meyer curves of the OS probability for SIRT6dn-like patients compared with the others. Log-rank test P value is reported. NES, normalized enriched scores.
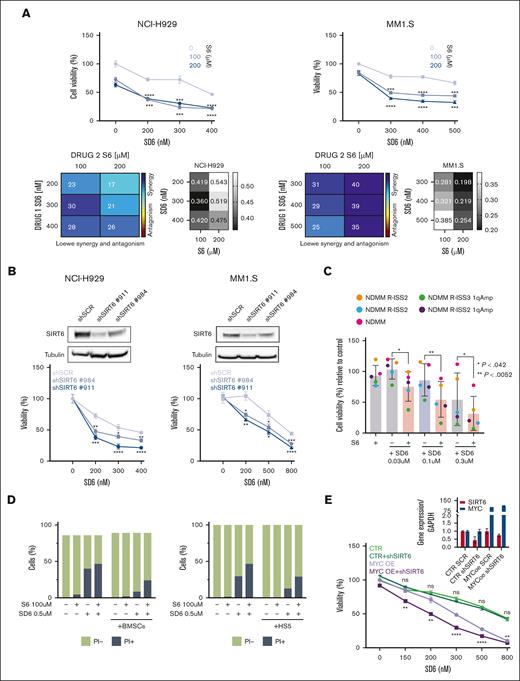
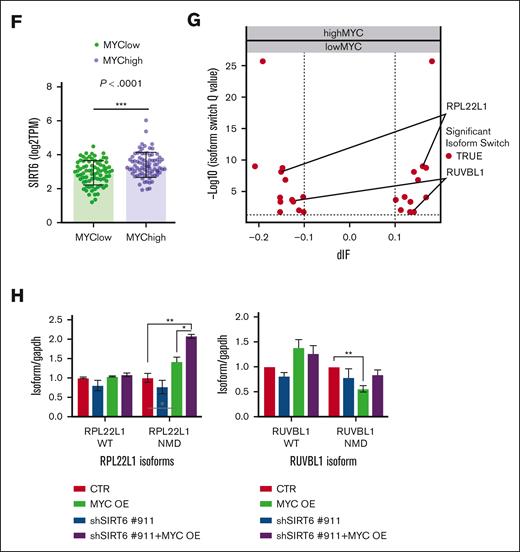
Because we recently proved that pervasive spliceosome machinery components deregulation of MM cells represents an exploitable vulnerability, we have deepened these findings.13 The anti-MM activity of the SIRT6 pharmacological inhibitor (S6) was tested in combination with the splicing modulator sudemycin D6 (SD6).14 As shown in Figure 2A, low doses of S6 plus SD6 were found to be synergistic; similar data were obtained using genetic approaches with short hairpin RNA targeting SIRT6. (Figure 2B) Moreover, this effect was partially rescued by the re-expression of the SIRT6 retroORF construct (lacking 3`UTR sequence) in SIRT6-KD cells (supplemental Figure 2). Of note, SIRT6 inhibition primed spliceosome modulator activity also on CD138+ tumor plasma cells isolated from high-risk, newly diagnosed patients with patients with MM (R-ISS2 and R-ISS3). (Figure 2C) To strengthen the relevance of these findings, we next tested this strategy on tumor cells coincubated with their bone marrow microenvironment (bone marrow progenitor cells or HS5): the anti-MM activity of the tested combination was preserved also in this context (Figure 2D), thus supporting its impact. The histone deacetylase SIRT6 has been earlier reported to act as a ribosome metabolism regulator by corepressing MYC transcriptional activity, which in turn directly modulates splicing factors.3 Importantly, MYC-overexpressing tumors are highly dependent on functional core splicing machinery.15 Based on these data, we hypothesized that MYC-overexpressing MM cells could be particularly sensitive to the investigated strategy. For this purpose, c-Myc gain-of-function models were used by choosing the U266 cell line.16 Although SD6 slightly enhanced its anti-MM activity in SIRT6 knocked-down cells than in control cells, the ectopic expression of c-MYC followed by SIRT6 silencing significantly enhanced the spliceosome modulator activity, the supporting the role of c-MYC in our strategy. (Figure 2E) To endorse a link between MYC and SIRT6 also in MM, we analyzed the CoMMpass data set and observed greater SIRT6 levels among patients with MM carrying higher MYC levels (Figure 2F). Consistently, to detect differentially spliced genes according to MYC expression, we distributed patients with MM in the CoMMpass data set in deciles and compared bottom vs top using isoform switch analysis (performed with Isoform Switch Analyze R package in R). Although no significant genome-wide differences were observed in alternative splicing events, 13 genes resulted in being differently spliced in the 2 groups. (Figure 2G) Among these, RPL22L1 and RUVBL1, previously reported as crucial for RNA processing, increased in their nonsense mediated decay–sensitive isoforms and decreased in their active isoforms (supplemental Figure 3A-B). To support these data, we screened c-Myc– and/or SIRT6-silenced U266 cells using a quantitative polymerase chain reaction–based approach. As shown in Figure 2H, c-Myc overexpression resulted in the dysregulation of nonsense mediated decay–sensitive isoforms of both RUVBL1 and RPL22L1; by contrast, no difference was observed in their active isoforms. Therefore, the unbalance among these 2 genes isoforms, corroborates the spliceosome as the Achilles’ heel for MYC-driven tumors.17,18
Splicing dysregulation triggered by SIRT6 damping crates an exploitable vulnerability for MM aggressive disease. (A) Cell viability curves of MM cells treated with SD6, S6, or their combination. Synergy maps under the curves (calculated with Combenefit Software) and combination index score (calculated with CalcuSyn software) for indicated set of drugs combination. (B) Survival curves of MM cells transfected with scramble or SIRT6-targeting short hairpin RNAs (shRNAs), and then treated with SD6 for 48 hours. Western blot analysis confirmed SIRT6 knockdown. (C) CD138+ cells collected from patients with MM were treated with indicated doses of SD6, S6 (100 μM), and their combination for 48 hours. Cell viability was measured by CTG assay. Cells deriving from the same patient are represented with same color in each graph; (D) H929 GFP+ cells were treated with S6 (100 μM), SD6 (0.5 μM), or their combination in the presence or absence of bone marrow stem cells (left) or HS5 (right) for 48 hours. Cell viability was measured with Fluorescence-activated cell sorting (FACS) analysis after propidium iodide staining. Specific viability of MM cells was evaluated after GFP+ gating strategy and presented as a percentage of control. (E) Upper panel shows MYC and SIRT6 mRNA levels in indicated gene-edited U266 cells. In the lower panel, viability of these cells after growing doses of SD6 for 48 hours is shown. pLV empty and pLV c-Myc–overexpressing U266 cells were transduced with shRNA targeting SIRT6 (clone#911) or scramble control); (F) Scatter plot showing significant difference in SIRT6 expression in low vs high c-MYC–expressing patients included in the CoMMpass data set. Patients were divided according to their c-Myc expression in deciles (first and tenth deciles were analyzed). (G) The graph shows genes for which significant switched isoforms were found comparing c-Myc low-expressing vs high-expressing (1st vs 10th decile) patients included in the CoMMpass data set; differential isoform usage score (diF) and log10 q value are displayed on x- and y-axis, respectively. RPL22L1 and RUVBL1 switched isoforms are indicated. (H) RUVBL1 and RPL22L1 isoforms (wild-type and nonsense mediated decay) expression level were evaluated in pLV c-Myc U266 cells transduced with shRNA targeting SIRT6 (clone#911) or scramble control. Indicated genes expression level was assessed by quantitative real-time polymerase chain reaction. Data were analyzed according to the DDCt method, and GAPDH was used as housekeeping gene. (A-H) Data are presented as mean ± standard deviation (n = 3); ∗P < .05; ∗∗P < .01; ∗∗∗P < .001; ∗∗∗∗P < .0001; if not differently indicated in the figure; unpaired t test.
SIRT6 is a chromatin-bound deacetylase, specifically acting on H3K9 and H3K56.19-22 Hence, we next investigated whether it directly modulates the chromatin structure of splicing factor genes by interrogating publicly available data sets of SIRT6 ChIP-Seq experiments (GSE 130689) and looking at H3K9 and H3K56 acetylation levels together with RNA polymerase II (PolII) binding in SIRT6-expressing (wild-type) and knockout mouse embryonic stem cells.23 As shown in supplemental Figure 4, a sharp peak of SIRT6 binding colocalized with H3K56Ac on SF3B2, SFPQ, and SF3A2 genes promoters in SIRT6 knockout compared with wild-type cells, whereas H3K9 acetylation remains barely unchanged, thus suggesting these splicing factors as direct targets of SIRT6; remarkably, Pol II binding was distributed accordingly. Overall, we provide evidence that targeting SIRT6 in MM cells results in massive instability, which relies on RNA processing addiction triggered by pervasive spliceosome members’ activity. Thus, SIRT6 inhibition combined with spliceosome modulators prompts massive cell death, mostly in MM subgroups overexpressing MYC because of their higher splicing deregulation. Based on these findings, we propose SIRT6 as a novel actionable target for MM, thus providing the framework for testing a synthetic lethal approach in clinical trials basically focused on more aggressive diseases.
Acknowledgments: This work was supported in part by the Associazione Italiana per la Ricerca sul Cancro (AIRC, IG #23438 [M.C.] and MYFG# 21552 [A.C.]), Italian Ministry of Health (GR-2016-02361523 [A.C.]), Associazione Italiana Leucemie Linfomi e Mieloma (AIL sezione di Genova), and University of Genoa, Italy. The authors acknowledge the Multiple Myeloma Research Foundation for sharing the CoMMpass study data set.
Contribution: E.G. and M.C. designed the research and wrote the manuscript; E.G. performed the experiments and the statistical and bioinformatic analysis; D.S., P.B., and C.M. performed the experiments; K.T. performed gene expression microarray; A.C., S.A., F.G., M.M., B.S., N. Alessio, and N. Antonino provided patient samples; and M.C. and R.M.L. revised the final version of manuscript.
Conflict-of-interest disclosure: The authors declare no competing financial interests.
Correspondence: Michele Cea, Clinic of Hematology, Department of Internal Medicine, University of Genoa, Viale Benedetto XV n.6 16132, Genoa, Italy; e-mail: michele.cea@unige.it.

