

Key Points
Optimal fludarabine exposure in those with relapsed/refractory B-cell ALL receiving CD19-specific CAR T-cell therapy was AUC ≥13.8 mg × h/L.
Suboptimal exposure led to a 2.5-fold higher risk of relapse and twofold higher risk of relapse/loss of B-cell aplasia.

Abstract
Chimeric antigen receptor (CAR) T cells provide a therapeutic option in hematologic malignancies. However, treatment failure after initial response approaches 50%. In allogeneic hematopoietic cell transplantation, optimal fludarabine exposure improves immune reconstitution, resulting in lower nonrelapse mortality and increased survival. We hypothesized that optimal fludarabine exposure in lymphodepleting chemotherapy before CAR T-cell therapy would improve outcomes. In a retrospective analysis of patients with relapsed/refractory B-cell acute lymphoblastic leukemia undergoing CAR T-cell (tisagenlecleucel) infusion after cyclophosphamide/fludarabine lymphodepleting chemotherapy, we estimated fludarabine exposure as area under the curve (AUC; mg × h/L) using a validated population pharmacokinetic (PK) model. Fludarabine exposure was related to overall survival (OS), cumulative incidence of relapse (CIR), and a composite end point (loss of B-cell aplasia [BCA] or relapse). Eligible patients (n = 152) had a median age of 12.5 years (range, <1 to 26), response rate of 86% (n = 131 of 152), 12-month OS of 75.1% (95% confidence interval [CI], 67.6% to 82.6%), and 12-month CIR of 36.4% (95% CI, 27.5% to 45.2%). Optimal fludarabine exposure was determined as AUC ≥13.8 mg × h/L. In multivariable analyses, patients with AUC <13.8 mg × h/L had a 2.5-fold higher CIR (hazard ratio [HR], 2.45; 95% CI, 1.34-4.48; P = .005) and twofold higher risk of relapse or loss of BCA (HR, 1.96; 95% CI, 1.19-3.23; P = .01) compared with those with optimal fludarabine exposure. High preinfusion disease burden was also associated with increased risk of relapse (HR, 2.66; 95% CI, 1.45-4.87; P = .001) and death (HR, 4.77; 95% CI, 2.10-10.9; P < .001). Personalized PK-directed dosing to achieve optimal fludarabine exposure should be tested in prospective trials and, based on this analysis, may reduce disease relapse after CAR T-cell therapy.
Introduction
Acute lymphoblastic leukemia (ALL) is the most common malignancy occurring in children, and for patients with relapsed or refractory (R/R) B-cell ALL (B-ALL), the prognosis is dismal.1-3 Several groups have reported the use of CD19-specific chimeric antigen receptor (CAR) T cells as a therapeutic option for patients with R/R B-ALL.4-12 Accessibility of this cellular therapy was broadened with the US Food and Drug Administration approval of tisagenlecleucel, a CD19-specific CAR T cell for R/R B-ALL in patients age <26 years.12 Despite initial response to CD19-specific CAR T-cell therapy in the setting of R/R B-ALL, the incidence of relapse among responders is estimated at 40% to 50%, demonstrating a need to improve this treatment strategy.5-7,10
The current successful application of CAR T-cell therapy has required pretreatment of patients with lymphodepleting chemotherapy (LDC). Most commonly, LDC uses a combination of cyclophosphamide and fludarabine; however, dosing, duration, and intensity of LDC has varied across institutions and trials.4-12 The addition of fludarabine to cyclophosphamide has been shown to improve CAR T-cell kinetics and initial response and decrease rejection in both B-ALL and non-Hodgkin lymphoma.8,13,14 Dose intensity of cyclophosphamide has also been shown to improve response and peak CAR T-cell expansion in pediatric and young adult patients with R/R B-ALL and progression-free survival and cytokine milieu in adult patients with R/R non-Hodgkin lymphoma.9,15 In patients undergoing allogeneic hematopoietic cell transplantation, optimal fludarabine exposure has been found to decrease nonrelapse mortality, as a result of improved immune reconstitution, and subsequently improve survival.16 Fludarabine exposure has not yet been studied in patients undergoing CAR T-cell therapy. We report the results of a cohort of pediatric and young adult patients with R/R B-ALL who received tisagenlecleucel and define the optimal fludarabine exposure associated with improved outcomes.
Methods
Study design
We conducted a retrospective analysis of pediatric and young adult patients with R/R B-ALL as part of the Pediatric Real-World CAR Consortium (PRWCC; n = 15 centers). Independent institutional review board approval was obtained by all centers, and data were collected using a Health Insurance Portability and Accountability Act–compliant REDCap database. The study was conducted in accordance with the Declaration of Helsinki. Two hundred patients underwent collection/manufacture for planned standard-of-care CD19-specific CAR T-cell therapy (tisagenlecleucel). Patients in this analysis were excluded if they did not receive their tisagenlecleucel infusion (n = 15), they did not have evaluable response data at the cutoff date (n = 1), they received lymphodepletion other than the tisagenlecleucel package insert LDC (fludarabine at 30 mg/m2 per day for 4 days and cyclophosphamide at 500 mg/m2 per day for 2 days; n = 7), their weight was not supported by the population pharmacokinetic (PK) model (n = 2), or the number of days between lymphodepletion and infusion was >3 (n = 23; supplemental Figure 1).
Outcomes of interest
The main outcomes of interest were overall survival (OS), cumulative incidence of relapse (CIR), and cumulative incidence of a composite end point (relapse or loss of B-cell aplasia [BCA]). Other outcomes of interest were response rate, cytokine release syndrome (CRS), and immune effector cell–associated neurotoxicity syndrome (ICANS). Complete remission (CR) was defined as ≤5% bone marrow blasts by morphology, absence of circulating lymphoblasts, and no evidence of extramedullary (EM) disease. Minimal residual disease negativity was defined as <0.01% abnormal B cells assessed by flow cytometry. Relapse was defined as any (medullary or EM) evidence of hematologic, cytogenetic, and/or molecular recurrence of primary disease. CD19+ B-cell recovery was defined as any detectable CD19+ B cells (>1 cell per mcL) on a peripheral blood lymphocyte flow cytometric panel. Toxicity grading was described according to the American Society for Transplantation and Cellular Therapy17 for CRS and ICANS. Additionally, patients were further delineated based on their disease burden: high disease burden (≥5% lymphoblasts, central nervous system 3 disease, and/or isolated EM disease) or no (undetectable) or low disease burden (<5% lymphoblasts, central nervous system disease ≤2, and/or no detectable EM disease) based on the previous PRWCC analysis.18 Fludarabine exposure (area under the curve [AUC]) for each patient was calculated using a population PK model as previously published.19 The patient variables required to calculate an estimated fludarabine exposure include estimated glomerular filtration rate (using either the Cockroft-Gault or Schwartz equation depending on age), actual body weight, height, and dosage of fludarabine used where actual body weight and estimated glomerular filtration rate are the best predictors of fludarabine PKs.19
Statistical analysis
For all analyses, tisagenlecleucel infusion date was considered time 0, with a data cutoff of 6 March 2020. The impact of different factors on the chance of response was assessed through Mann-Whitney-Wilcoxon test for continuous variables, χ2 or Fisher’s exact test for categorical variables (univariable analysis), and logistic regression (multivariable analysis). OS for all treated patients was defined as time from infusion to death resulting from any cause. OS in responding patients was defined as time from day of response (day 28 from CAR infusion) to death resulting from any cause. Patients alive were censored at their last follow-up date. Time to relapse was defined as time from date of infusion to date of disease relapse, and time to composite end point was defined as time from date of infusion to date of either disease relapse or loss of BCA, whichever occurred first. For both end points, patients alive without disease relapse (and loss of BCA for composite end point) were censored at their date of last follow-up. Death and allogeneic hematopoietic cell transplantation without disease relapse (and loss of BCA) were considered competing events. Patients who died before day 28 or did not achieve CR after tisagenlecleucel were not at risk of relapse and therefore were excluded from CIR and composite end point analyses. Kaplan-Meier analysis was used to estimate OS, and Aalen-Johansen estimator was used for CIR and the composite end point (prodlim; https://CRAN.R-project.org/package=prodlim). Potential follow-up was estimated using reverse Kaplan-Meier estimate. Differences in survival curves between groups were tested using log-rank test or Gray’s test for cumulative incidence. Impact of clinical factors associated with response and fludarabine exposure on survival end points was assessed using Cox models (cause-specific hazards models in presence of competing risks). Estimated fludarabine (cumulative) AUC for each patient was plotted as a continuous variable against hazard ratios (HRs) for relapse, and optimal exposure was explored using HR plots (Greg; https://CRAN.R-project.org/package=Greg). In both logistic and Cox models, variables with P value <.1 in univariable analysis were included in multivariable analysis. A P value <.05 was considered statistically significant. A. Mauguen conducted statistical analysis of the data. All authors had access to the primary data and results of analyses.
Results
Patient characteristics
A total of 152 patients met inclusion criteria for analysis (supplemental Figure 1). Baseline patient characteristics are shown in supplemental Table 1. Median age at diagnosis was 8 years (range, <1 to 25), and median age at tisagenlecleucel infusion was 12.5 years (range, <1 to 26). Median time from initial diagnosis to infusion was 2.9 years (range, 0.3-13.7). CR was achieved in 86% (n = 131 of 152) of patients. Death before day 28 disease assessment occurred in 3% (n = 5 of 152) of patients, and 11% (n = 16 of 152) of patients did not achieve CR. Univariable analysis of baseline patient characteristics found preinfusion disease burden (P = .001), prior CD19-directed therapy (P = .01), and race (P = .025) as factors associated with response (supplemental Table 2). The PRWCC previously reported that preinfusion disease burden and race were prognostic for response.18,20
Fludarabine exposure and response
Mean dose of fludarabine received was 41 mg per dose (range, 11-70), and estimated mean fludarabine cumulative AUC before tisagenlecleucel infusion was 14.4 mg × h/L (standard deviation [SD], 1.6; range, 11.1-22.4). Impact of fludarabine AUC on response was explored in the entire cohort. In the context of a limited sample of nonresponding patients (n = 16), fludarabine AUC was found to be higher in nonresponders than responders, with a mean of 14.7 mg × h/L (SD, 1.6; range, 11.1-16.7) and 14.4 mg × h/L (SD, 1.5; range, 11.7-22.4), respectively (Mann-Whitney-Wilcoxon P = .046). Univariable analysis of baseline characteristics and response is shown in supplemental Table 2. Multivariable analysis of baseline characteristics prognostic for response in this cohort (i.e., race, preinfusion disease burden, and prior CD19-directed therapy) revealed that fludarabine AUC was not predictive of response after adjustment (P = .26; Table 1).
Multivariable analysis of response by patient characteristics significant in univariable analysis
| Characteristic | Odds ratio | 95% CI | P |
|---|---|---|---|
| Cumulative fludarabine AUC, mg × h/L | 0.81 | 0.56-1.21 | .26 |
| Race* | .019 | ||
| Black/Hispanic | Ref | ||
| White | 5.28 | 1.37-25.7 | |
| Preinfusion disease burden | <.001 | ||
| None or low | Ref | ||
| High | 0.06 | 0.00-0.32 | |
| Prior CD19-directed therapy | .007 | ||
| No | Ref | ||
| Yes | 0.16 | 0.04-0.60 |
Ref, reference.
No events were observed in the other race groups.
Fludarabine exposure and outcomes
Median potential follow-up was 1.1 year (quartile 1, 0.8; quartile 3, 1.7 years). After achieving response, 52 patients relapsed, and 12-month CIR in responding patients was 36.4% (95% confidence interval [CI], 27.5% to 45.2%). Cumulative incidence of a clinically important composite end point (relapse or loss of BCA) was 55.2% (95% CI, 46.0-64.4) at 12 months, with relapse or loss of BCA occurring in 76 patients and only loss of BCA occurring in 52 patients post-tisagenlecleucel. A total of 40 patients died in this cohort. Twelve- and 24-month OS for the entire cohort were 75.1% (95% CI, 67.6% to 82.6%) and 56.5% (95% CI, 41.8% to 71.2%), respectively.
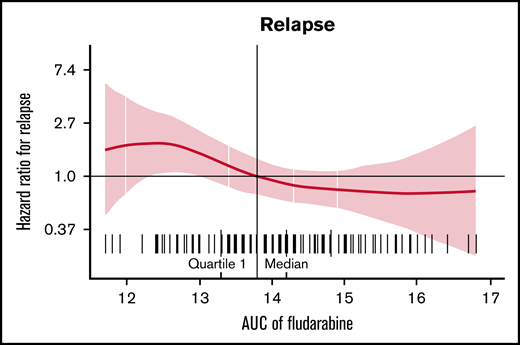
Estimated fludarabine AUC for each patient was plotted as a continuous variable against cumulative risk of relapse (Figure 1). Optimal fludarabine exposure was defined as AUC ≥13.8 mg × h/L, because this is where, graphically, the HR curve for CIR crossed HR of 1 (Figure 1). This threshold was used as the optimal fludarabine exposure for all outcomes of interest (ie, OS, CIR, and composite end point), because the threshold for other end points was similar (data not shown). In this cohort, 67% (n = 102 of 152) had optimal fludarabine exposure. Univariable and multivariable analyses incorporating baseline patient factors and our covariate of interest, optimal/suboptimal fludarabine exposure, were performed with our outcomes of interest (Table 2). After multivariable adjustment, both high preinfusion disease burden and suboptimal fludarabine exposure were associated with increased risk of relapse (HR, 2.66; P = .001 and HR, 2.45; P = .005) and increased composite end point (HR, 2.02; P = .005 and HR, 1.96; P = .01; Table 2). OS was not associated with suboptimal fludarabine exposure in the entire cohort (HR, 1.53; P = .26) or when analyzing responding patients only (HR, 1.97; P = .14), whereas preinfusion disease burden (HR, 4.77; P < .001 and HR, 2.90; P = .013) and age (HR, 0.41; P = .008 and HR, 0.34; P = .010) were associated with survival as previously reported by the PRWCC (supplemental Table 3; Table 2).18 In an analysis of patients with high preinfusion disease burden, suboptimal fludarabine exposure was associated with reduced OS for all treated patients (HR, 2.27; P = .03) and for responding patients only (HR, 3.50; P = .02). Outcomes of interest for cohorts of patients based on fludarabine exposure and pretreatment disease burden are shown in Figure 2. Patients who received optimal or suboptimal fludarabine exposure had no difference in pretreatment disease burden or other factors associated with response in this cohort (supplemental Table 4).
Univariable and multivariable analyses of outcomes of interest based on patient characteristics in responding patients
| CIR | Cumulative incidence of composite end point (relapse or loss of BCA) | OS in responding patients | ||||||||||||||||
|---|---|---|---|---|---|---|---|---|---|---|---|---|---|---|---|---|---|---|
| Characteristic | Univariable | Multivariable | Univariable | Multivariable | Univariable | Multivariable | ||||||||||||
| HR | 95% CI | P | HR | 95% CI | P | HR | 95% CI | P | HR | 95% CI | P | HR | 95% CI | P | HR | 95% CI | P | |
| Sex | .13 | .40 | .10 | .69 | ||||||||||||||
| Female | Ref | Ref | Ref | Ref | ||||||||||||||
| Male | 0.64 | 0.36-1.13 | 0.81 | 0.50-1.31 | 0.51 | 0.23-1.13 | 0.83 | 0.35-2.01 | ||||||||||
| N of prior lines of therapy | 1.09 | 0.92-1.28 | .33 | 1.04 | 0.90-1.19 | .63 | 1.16 | 0.93-1.45 | .20 | |||||||||
| Time from diagnosis to infusion, mo | 0.99 | 0.99-1.00 | .20 | 1.00 | 0.99-1.00 | .22 | 0.99 | 0.98-1.00 | .31 | |||||||||
| Age at diagnosis, y | .005 | .075 | .052 | .21 | .011 | 0.14-0.80 | .010 | |||||||||||
| <1 or >10 | Ref | Ref | Ref | Ref | Ref | Ref | ||||||||||||
| 1-10 | 0.43 | 0.24-0.78 | 0.55 | 0.29-1.06 | 0.62 | 0.39-1.00 | 0.72 | 0.43-1.21 | 0.34 | 0.14-0.80 | 0.34 | |||||||
| Preinfusion disease burden | .006 | .001 | .014 | .005 | .013 | Ref | 1.20-7.00 | .013 | ||||||||||
| None or low | Ref | Ref | Ref | Ref | Ref | 2.90 | ||||||||||||
| High | 2.26 | 1.25-4.10 | 2.66 | 1.45-4.87 | 1.82 | 1.13-2.95 | 2.02 | 1.24-3.29 | 2.88 | 1.19-6.96 | ||||||||
| Initial cytogenetic risk | .43 | .54 | .41 | |||||||||||||||
| Favorable | Ref | Ref | Ref | |||||||||||||||
| Intermediate | 1.87 | 0.68-5.15 | 1.27 | 0.58-2.80 | 2.67 | 0.56-12.7 | ||||||||||||
| Unfavorable | 1.68 | 0.62-4.53 | 1.51 | 0.71-3.24 | 1.96 | 0.42-9.11 | ||||||||||||
| Prior HCT | .92 | .64 | .88 | |||||||||||||||
| No | Ref | Ref | Ref | |||||||||||||||
| Yes | 0.93 | 0.23-3.85 | 0.77 | 0.24-2.44 | 0.86 | 0.12-6.37 | ||||||||||||
| Prior CD19-directed therapy | .43 | .82 | .98 | |||||||||||||||
| No | Ref | Ref | Ref | |||||||||||||||
| Yes | 1.32 | 0.67-2.61 | 1.07 | 0.60-1.90 | 1.01 | 0.38-2.71 | ||||||||||||
| Prior relapse | .062 | .14 | .55 | .19 | ||||||||||||||
| ≥1 | Ref | Ref | Ref | Ref | ||||||||||||||
| Refractory | 0.42 | 0.15-1.17 | 0.49 | 0.18-1.38 | 1.22 | 0.64-2.33 | 0.42 | 0.10-1.80 | ||||||||||
| CNS or EM disease | .17 | .93 | .68 | |||||||||||||||
| No | Ref | Ref | Ref | |||||||||||||||
| Yes | 1.50 | 0.84-2.68 | 1.02 | 0.64-1.64 | 0.84 | 0.37-1.90 | ||||||||||||
| Race | .98 | .71 | .73 | |||||||||||||||
| Black/Hispanic | Ref | Ref | Ref | |||||||||||||||
| Other | 1.14 | 0.34-3.89 | 0.63 | 0.19-2.07 | 1.20 | 0.26-5.44 | ||||||||||||
| White | 1.02 | 0.55-1.88 | 0.75 | 0.33-1.73 | ||||||||||||||
| Cumulative fludarabine AUC, mg × h/L | .029 | .005 | .025 | .010 | .056 | .14 | ||||||||||||
| ≥13.8 | Ref | Ref | Ref | Ref | Ref | Ref | ||||||||||||
| <13.8 | 1.95 | 1.08-3.52 | 2.45 | 1.34-4.48 | 1.77 | 1.09-2.88 | 1.96 | 1.19-3.23 | 2.25 | 1.00-5.06 | 1.97 | 0.80-4.85 | ||||||
Bold font indicates significance.
CNS, central nervous system; HCT, hematopoetic cell transplantation; Ref, reference.
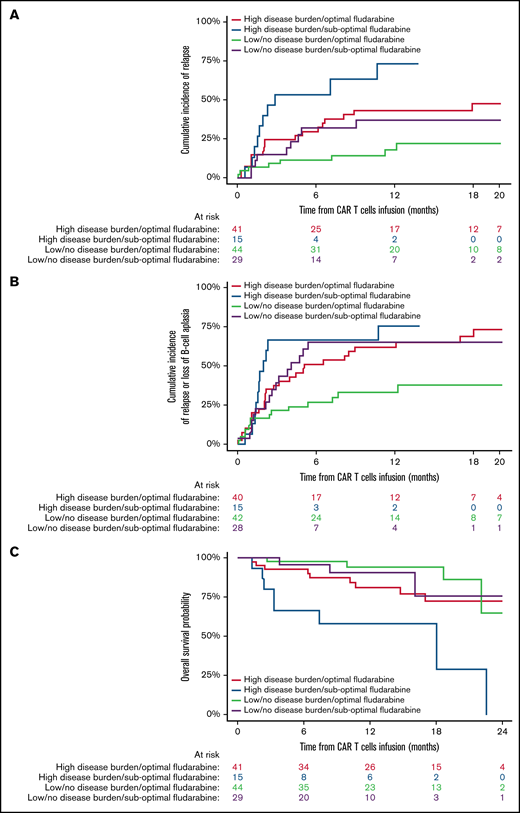
Impact of fludarabine exposure and preinfusion disease burden on outcomes after tisagenlecleucel in responding patients. Patients were grouped based on fludarabine exposure (optimal vs suboptimal) and preinfusion disease burden (high vs low/no). (A) CIR among responders to tisagenlecleucel. (B) Cumulative incidence of composite end point among responders to tisagenlecleucel. (C) OS of all responding patients after tisagenlecleucel.
Impact of fludarabine exposure and preinfusion disease burden on outcomes after tisagenlecleucel in responding patients. Patients were grouped based on fludarabine exposure (optimal vs suboptimal) and preinfusion disease burden (high vs low/no). (A) CIR among responders to tisagenlecleucel. (B) Cumulative incidence of composite end point among responders to tisagenlecleucel. (C) OS of all responding patients after tisagenlecleucel.
Fludarabine exposure and toxicity
CRS and severe CRS (defined as grade ≥3) were observed in 64% (n = 97 of 152) and 22% (n = 33 of 152) of patients, respectively. Neurotoxicity was seen in 24% (n = 36 of 152) of patients and severe neurotoxicity (defined as grade ≥3) in 8% (n = 12 of 152) of patients. Neurotoxicity grading was heterogenous with ICANS (n = 98), CAR T cell–related encephalopathy (n = 21), and other grading systems (n = 22). Optimal fludarabine exposure was not associated with increased CRS or neurotoxicity (limited to ICANS-graded patients; Table 3). Severe CRS occurred in 18% (n = 18 of 102) of patients who received optimal fludarabine exposure compared with 30% (n = 15 of 50) of patients in the suboptimal fludarabine exposure group (P = .10). There was also no difference between optimal and suboptimal fludarabine exposure and overall ICANS (22% [n = 15 of 67] vs 29% [n = 9 of 31]; P = .61) or severe ICANS (7% [n = 5 of 67] vs 13% [n = 4 of 31]; P = .46), respectively (Table 3).
Toxicity rates according to optimal and suboptimal fludarabine exposure
| Characteristic | Suboptimal (<13.8 mg × h/L) | Optimal (≥13.8 mg × h/L) | P |
|---|---|---|---|
| CRS grade ≥3 (severe CRS) | 15/50 (30) | 18/102 (18) | .09 |
| ICANS grade ≥1 | 9/31 (29) | 15/67 (22) | .61 |
| ICANS grade ≥3 (severe ICANS) | 4/31 (13) | 5/67 (7) | .46 |
| Characteristic | Suboptimal (<13.8 mg × h/L) | Optimal (≥13.8 mg × h/L) | P |
|---|---|---|---|
| CRS grade ≥3 (severe CRS) | 15/50 (30) | 18/102 (18) | .09 |
| ICANS grade ≥1 | 9/31 (29) | 15/67 (22) | .61 |
| ICANS grade ≥3 (severe ICANS) | 4/31 (13) | 5/67 (7) | .46 |
Data presented as n/N (%).
Infection post–CAR T-cell therapy occurred in 38% of patients (n = 57 of 152), including in 35% (n = 36 of 102) and 42% (n = 21 of 50) of patients who received optimal vs suboptimal fludarabine exposure, respectively (P = .42). In our cohort, 4 patients died as a result of infection, all of whom received suboptimal fludarabine. Grade 4 neutropenia was seen in 66% (n = 97 of 148) of patients (67% of patients receiving suboptimal fludarabine and 65% of patients receiving optimal fludarabine; P = .84). In addition, there was no correlation between receiving optimal fludarabine exposure and resolution of neutropenia (P = .75) or time to recovery (in patients who recovered; P = .61).
Discussion
LDC before CAR T-cell therapy has been shown to be a requisite for efficacy with the current generation of investigational or commercial CAR T cells.8,9,14,15 Using a validated population PK model, we found that fludarabine exposure was a major driver of outcomes with standard cyclophosphamide and fludarabine LDC before tisagenlecleucel for R/R B-ALL in a real-world setting. To our knowledge, this is the first study to define optimal fludarabine exposure for CAR T-cell therapy. Optimal fludarabine exposure was found to be ≥13.8 mg × h/L and was associated with reduced disease relapse and a clinically relevant composite end point of relapse or loss of BCA. OS was not affected by fludarabine exposure in the entire cohort or in responding patients only. However, this does not deemphasize these results, because OS is not an ideal surrogate end point, given patients who experienced relapse could be enrolled in other trials or receive other therapies directly affecting their survival. Furthermore, fludarabine exposure was noted to affect OS in patients with high preinfusion tumor burden, a cohort of patients previously reported to have dismal outcomes with CAR T-cell therapy.18 Fludarabine exposure as part of LDC is an easily modifiable factor that could improve the durability and efficacy of CAR T-cell therapy. Validation of these results will require a prospective trial targeting optimal fludarabine dosing as part of the LDC regimen.
Paradoxically, we noted nonresponding patients received an overall higher mean fludarabine dose; however, in a multivariable analysis, fludarabine exposure was not predictive of response. We suspect this finding was due to the small number of nonresponders (n = 16 of 152) in this cohort.
The mechanism by which fludarabine exposure was associated with improved outcomes in this cohort was not determined and remains speculative. LDC before CAR T-cell therapy has been shown to be a requisite for efficacy with the current generation of investigational or commercial CAR T cells.8,9,14,15
Higher-intensity LDC has been shown to improve lymphodepletion and has been associated with improved response after CD19-specific CAR T cells.9 Other potential mechanisms include increased availability of cytokines and/or improvement of the cytokine milieu, which has also been observed after more intense lymphodepletion.15,21
An important consideration in personalizing fludarabine dosing is to determine if any increase in toxicity is seen with higher/optimal fludarabine LDC. Previous studies have noted the association of delayed neurotoxicity in adult patients with leukemia treated with fludarabine.22-24 Although no increase in toxicity was noted in the current analysis, this is an important consideration for prospective studies. Additionally, long-term evaluation of immune reconstitution and/or increased infectious risk with the use of higher/optimal fludarabine is warranted, because this is a long-term and potentially severe complication after CD19-directed CAR T-cell therapy.25,26 In this cohort, no apparent increased infection risk was noted in patients who received optimal fludarabine exposure, although this analysis was limited by the short duration of follow-up.
The primary limitations of this analysis are retrospective/heterogenous reporting and use of a population PK model (accuracy of 80% to 85% as compared with direct measurement of fludarabine AUC). However, the use of a fludarabine population PK model is clinically feasible, and we generated unique data on the association of fludarabine exposure and outcomes after CAR T-cell therapy. Patients also received cyclophosphamide as part of their LDC; however, cyclophosphamide PKs were not included in our analysis, because the number of active cyclophosphamide metabolites makes estimation of exposure infeasible. This analysis also raises the possibility of using alternative LDC agents that have more predictable PKs, thereby creating a more favorable environment for CAR T-cell expansion, persistence, and durability. Prospective studies with larger cohort sizes and predictable LDC exposures are warranted to improve CAR T-cell therapy.
In summary, optimal (higher) fludarabine exposure before CD19-specific CAR T-cell therapy (tisagenlecleucel) in pediatric and young adult patients with R/R B-ALL is associated with lower relapse probability. This analysis should be replicated with other CAR T-cell products that use fludarabine-based LDC to identify the optimal fludarabine exposure for individual products. This unique analysis using estimated fludarabine exposure through a population PK model highlights the need for a prospective study that incorporates individualized fludarabine PKs. Personalized fludarabine dosing, an easily modifiable factor based on weight and renal function, has the potential to improve disease control, which presently is unacceptably high after CAR T-cell therapy.
Acknowledgments
The authors acknowledge the following individuals for their major roles in supporting successful execution of this multi-institutional study: administrative support, Anika Dove and Daisy Torres; legal counsel and contracting, Neil Morimoto; data management, Anne Marcy, Michelle Fujimoto, Jennifer Sheppard, Jean Sosna, Victoria Koch, Katie Doherty, Emily Bakinowski, Elizabeth Klein, Daritzya Baraja, Courtney Newbold, Glenn McWillians, Maggie Dyer, Kasey Abrahamnson, Angie Peltz, Ahmed Tahoun, Mary Suarez, Megan Hanby, Stacy Cooper, and Brad Muller; and editorial assistance, Joe Olechnowicz.
This work was supported by a St Baldrick’s/Stand Up 2 Cancer Pediatric Dream Team Translational Cancer Research Grant (C.L.M.). Stand Up 2 Cancer is a program of the Entertainment Industry Foundation administered by the American Association for Cancer Research. C.L.M is a member of the Parker Institute for Cancer Immunotherapy, which supports the Stanford University Cancer Immunotherapy Program. This work was also supported by the Virginia and D.K. Ludwig Fund for Cancer Research. Memorial Sloan Kettering Cancer Center authors acknowledge support from National Cancer Institute, National Institutes of Health, Cancer Center Support Grant P30 CA008748.
Authorship
Contribution: All authors were involved in conception and design and collection and assembly of patient data. K.J.C. and L.M.S. had full access to all the data in the study and take responsibility for the integrity of the data and the accuracy of the data analysis. L.M.S. performed administrative duties. C.B. and L.M.S. designed the data collection tool. V.A.F., J.J.B., and K.J.C. designed this study. A. Mauguen performed the statistical analysis; and all authors were involved in data analysis and interpretation, manuscript writing, and final manuscript approval and are accountable for all aspects of this work.
Conflict-of-interest disclosure: C.L.P. has served on an advisory committee for Novartis. H.E.S. has served on an advisory committee and speaker’s bureau for Novartis. S.P.M. has served on an advisory committee for Novartis and Jazz Pharmaceuticals. M.R.V. has served on an advisory committee for Novartis, has been a consultant for and is a current equity holder in Fate Therapeutics and Bmogen, reports honoraria from Medexus and Jazz Pharmaceuticals, and has been a consultant for Up-to-Date. G.D.M. has served on the ELIANA trial steering committee and speaker’s bureau and has served as a consultant for and received honoraria from Novartis. P.A.B. has served on an advisory committee for Novartis, Kite, Takeda, Janssen, Kura, Servier, and Jazz Pharmaceuticals. M.Q. reports honoraria from Medexus and Jazz Pharmaceuticals and has served as a consultant for Novartis and Mesoblast. M.H. has served on an advisory board for Sobi and Novartis. P.S. has served as a consultant for Takeda and Mesoblast. K.J.C. has served as a consultant for and received research funding from Novartis, has served as a consultant for Mesoblast, and has received research funding from Celgene. C.L.M. is an inventor on multiple patents for CAR T cells, is a cofounder of and holds equity in Lyell Immunopharma and Syncopation Life Sciences, which are developing CAR-based therapies, and consults for Lyell Immunopharma, NeoImmune Tech, Apricity, Nektar, Immatics, Ensome, and Mammoth. T.W.L. reports consultancy relationships with Novartis, Cellectis, Bayer, Deciphera, Juno Health, and Y-mAbs Therapeutics and has received research funding from Pfizer, Novartis, and Bayer. The remaining authors declare no competing financial interests.
Correspondence: Kevin J. Curran, Memorial Sloan Kettering Cancer Center, 1275 York Ave, New York, NY 10065; e-mail: currank@mskcc.org; and Liora M. Shultz, Stanford University School of Medicine, 1000 Welch Rd, Suite #300, Stanford, CA 94304; e-mail: lioras@stanford.edu.

